Fat Quantification in the Vertebral Body: Comparison of Modified Dixon Technique with Single-Voxel Magnetic Resonance Spectroscopy
- Affiliations
-
- 1Department of Radiology, Seoul National University Hospital, Seoul, Korea. dalnara3@gmail.com
- 2Department of Radiology, Seoul National University College of Medicine, Seoul, Korea.
- 3Department of Radiological Science, College of Health Science, Gimcheon University, Gimcheon, Korea.
- 4Institute of Radiation Medicine, Seoul National University Medical Research Center, Seoul, Korea.
- KMID: 2429926
- DOI: http://doi.org/10.3348/kjr.2018.0174
Abstract
OBJECTIVE
To compare the lumbar vertebral bone marrow fat-signal fractions obtained from six-echo modified Dixon sequence (6-echo m-Dixon) with those from single-voxel magnetic resonance spectroscopy (MRS) in patients with low back pain.
MATERIALS AND METHODS
Vertebral bone marrow fat-signal fractions were quantified by 6-echo m-Dixon (repetition time [TR] = 7.2 ms, echo time (TE) = 1.21 ms, echo spacing = 1.1 ms, total imaging time = 50 seconds) and single-voxel MRS measurements in 25 targets (23 normal bone marrows, two focal lesions) from 24 patients. The point-resolved spectroscopy sequence was used for localized single-voxel MRS (TR = 3000 ms, TE = 35 ms, total scan time = 1 minute 42 seconds). A 2 × 2 × 1.5 cm³ voxel was placed within the normal L2 or L3 vertebral body, or other lesions including a compression fracture or metastasis. The bone marrow fat spectrum was characterized on the basis of the magnitude of measurable fat peaks and a priori knowledge of the chemical structure of triglycerides. The imaging-based fat-signal fraction results were then compared to the MRS-based results.
RESULTS
There was a strong correlation between m-Dixon and MRS-based fat-signal fractions (slope = 0.86, R² = 0.88, p < 0.001). In Bland-Altman analysis, 92.0% (23/25) of the data points were within the limits of agreement. Bland-Altman plots revealed a slight but systematic error in the m-Dixon based fat-signal fraction, which showed a prevailing overestimation of small fat-signal fractions (< 20%) and underestimation of high fat-signal fractions (> 20%).
CONCLUSION
Given its excellent agreement with single-voxel-MRS, 6-echo m-Dixon can be used for visual and quantitative evaluation of vertebral bone marrow fat in daily practice.
Keyword
MeSH Terms
Figure
-
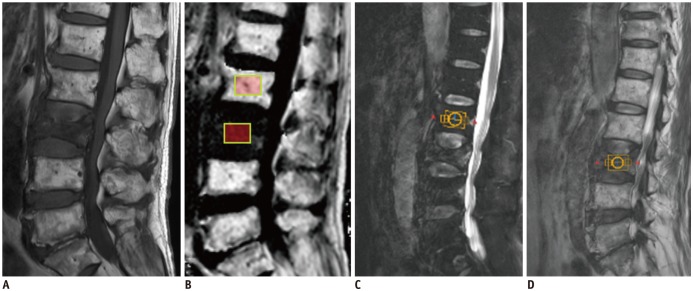
Fig. 1 79-year-old man with acute osteoporotic compression fracture at L3 vertebral body.Median plane from sagittal T1-weighted image (A) shows acute compression fracture of L3 vertebral body with decreased bone marrow signals. Sagittal FF image derived from six-echo modified Dixon sequence method (B) shows decreased FF at affected L3 vertebra, with normal high FFs at other lumbar vertebral bodies. Two 2 × 1.5-cm2 regions-of-interest are shown on affected L3 vertebral body and normal L2 vertebral body. Sagittal (C) image showing 2 × 2 × 1.5-cm2 VOI placed on normal L2 vertebral body for MRS analysis. Another VOI of same size was placed at L3 vertebra (D). FF = fat fraction, MRS = magnetic resonance spectroscopy, VOI = volume of interest
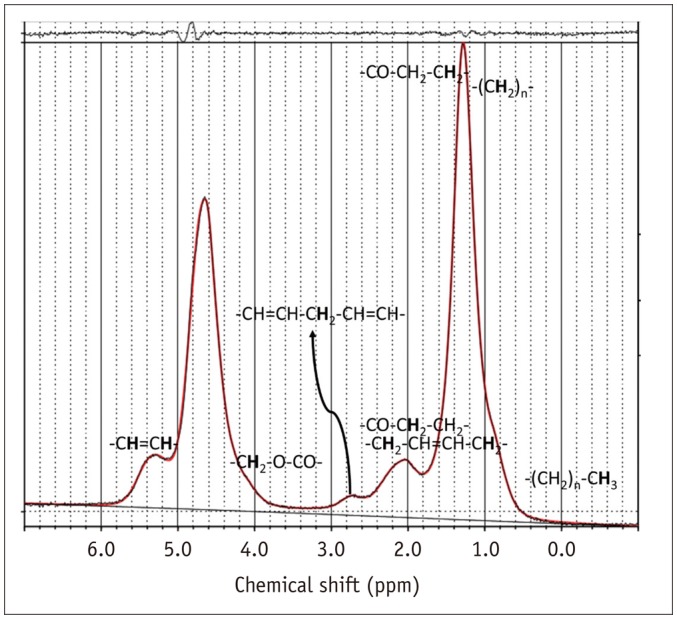
Fig. 2 Typical MRS spectrum from normal L3 vertebral body of 42-year-old woman with nonspecific low back pain.Various peaks are indicated for fat at 0.90, 1.30, 1.59, 2.00, 2.25, 2.77, 4.20, and 5.31 ppm, and water peak is indicated at 4.65 ppm.
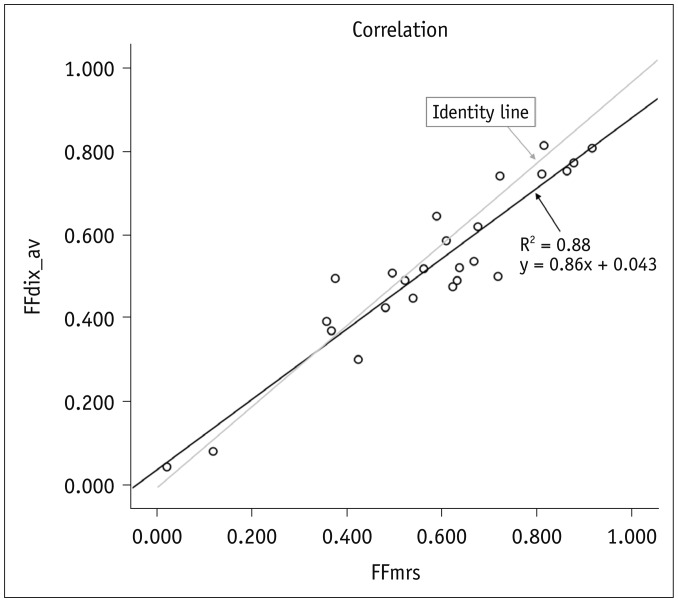
Fig. 3 Graph showing linear regression model for FFmrs versus FFdix measurements.Correlation coefficient R2 = 0.88, with p < 0.001. FFdix = magnetic resonance image-based FF, FFmrs = spectroscopy-based FF
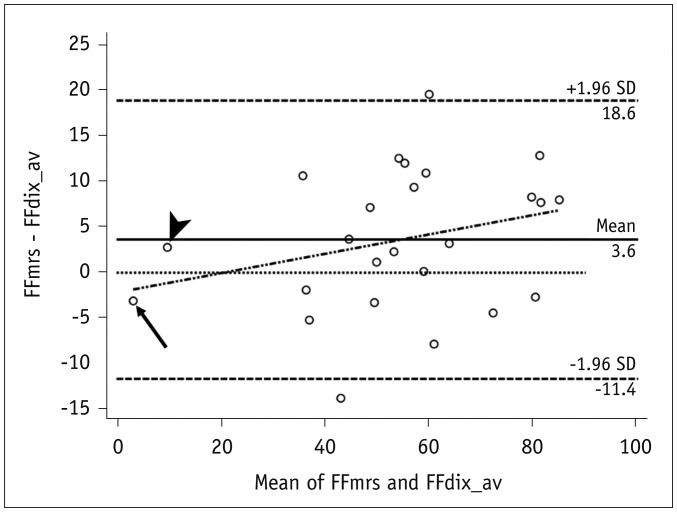
Fig. 4 Bland-Altman plot showing mean measurement bias of 3.6% (FFmrs > FFdix), and limits of agreement ranging from −11% to 18%.Small systematic error is present with FFdix, which showed slight overestimation of small FF (< 20%) and underestimation of high FF (> 20%). Subject with smallest mean FF (arrow) shows overestimation of FFdix, whereas subject with second smallest mean FF (arrowhead) shows underestimation. SD = standard deviation
Reference
-
1. Hu HH, Kim HW, Nayak KS, Goran MI. Comparison of fat-water MRI and single-voxel MRS in the assessment of hepatic and pancreatic fat fractions in humans. Obesity (Silver Spring). 2010; 18:841–847. PMID: 19834463.
Article2. Livingstone RS, Begovatz P, Kahl S, Nowotny B, Strassburger K, Giani G, et al. Initial clinical application of modified Dixon with flexible echo times: hepatic and pancreatic fat assessments in comparison with (1)H MRS. MAGMA. 2014; 27:397–405. PMID: 24306514.
Article3. Kim YP, Kannengiesser S, Paek MY, Kim S, Chung TS, Yoo YH, et al. Differentiation between focal malignant marrow-replacing lesions and benign red marrow deposition of the spine with T2*-corrected fat-signal fraction map using a three-echo volume interpolated breath-hold gradient echo Dixon sequence. Korean J Radiol. 2014; 15:781–791. PMID: 25469090.4. Yoo HJ, Hong SH, Kim DH, Choi JY, Chae HD, Jeong BM, et al. Measurement of fat content in vertebral marrow using a modified dixon sequence to differentiate benign from malignant processes. J Magn Reson Imaging. 2017; 45:1534–1544. PMID: 27690264.
Article5. Griffith JF, Yeung DK, Antonio GE, Lee FK, Hong AW, Wong SY, et al. Vertebral bone mineral density, marrow perfusion, and fat content in healthy men and men with osteoporosis: dynamic contrast-enhanced MR imaging and MR spectroscopy. Radiology. 2005; 236:945–951. PMID: 16055699.
Article6. Griffith JF, Yeung DK, Antonio GE, Wong SY, Kwok TC, Woo J, et al. Vertebral marrow fat content and diffusion and perfusion indexes in women with varying bone density: MR evaluation. Radiology. 2006; 241:831–838. PMID: 17053202.
Article7. Li X, Kuo D, Schafer AL, Porzig A, Link TM, Black D, et al. Quantification of vertebral bone marrow fat content using 3 Tesla MR spectroscopy: reproducibility, vertebral variation, and applications in osteoporosis. J Magn Reson Imaging. 2011; 33:974–979. PMID: 21448966.
Article8. Karampinos DC, Melkus G, Baum T, Bauer JS, Rummeny EJ, Krug R. Bone marrow fat quantification in the presence of trabecular bone: initial comparison between water-fat imaging and single-voxel MRS. Magn Reson Med. 2014; 71:1158–1165. PMID: 23657998.
Article9. Longo R, Pollesello P, Ricci C, Masutti F, Kvam BJ, Bercich L, et al. Proton MR spectroscopy in quantitative in vivo determination of fat content in human liver steatosis. J Magn Reson Imaging. 1995; 5:281–285. PMID: 7633104.
Article10. Kim H, Taksali SE, Dufour S, Befroy D, Goodman TR, Petersen KF, et al. Comparative MR study of hepatic fat quantification using single-voxel proton spectroscopy, two-point dixon and three-point IDEAL. Magn Reson Med. 2008; 59:521–527. PMID: 18306404.
Article11. Thomsen C, Becker U, Winkler K, Christoffersen P, Jensen M, Henriksen O. Quantification of liver fat using magnetic resonance spectroscopy. Magn Reson Imaging. 1994; 12:487–495. PMID: 8007779.
Article12. Mehta SR, Thomas EL, Bell JD, Johnston DG, Taylor-Robinson SD. Non-invasive means of measuring hepatic fat content. World J Gastroenterol. 2008; 14:3476–3483. PMID: 18567074.
Article13. Fischer MA, Nanz D, Shimakawa A, Schirmer T, Guggenberger R, Chhabra A, et al. Quantification of muscle fat in patients with low back pain: comparison of multi-echo MR imaging with single-voxel MR spectroscopy. Radiology. 2013; 266:555–563. PMID: 23143025.
Article14. Yoo YH, Kim HS, Lee YH, Yoon CS, Paek MY, Yoo H, et al. Comparison of multi-echo Dixon methods with volume interpolated breath-hold gradient echo magnetic resonance imaging in fat-signal fraction quantification of paravertebral muscle. Korean J Radiol. 2015; 16:1086–1095. PMID: 26357503.
Article15. Berglund J, Ahlström H, Johansson L, Kullberg J. Two-point Dixon method with flexible echo times. Magn Reson Med. 2011; 65:994–1004. PMID: 21413063.
Article16. Eggers H, Brendel B, Duijndam A, Herigault G. Dual-echo Dixon imaging with flexible choice of echo times. Magn Reson Med. 2011; 65:96–107. PMID: 20860006.
Article17. Kukuk GM, Hittatiya K, Sprinkart AM, Eggers H, Gieseke J, Block W, et al. Comparison between modified Dixon MRI techniques, MR spectroscopic relaxometry, and different histologic quantification methods in the assessment of hepatic steatosis. Eur Radiol. 2015; 25:2869–2879. PMID: 25903702.
Article18. Shen W, Gong X, Weiss J, Jin Y. Comparison among T1-weighted magnetic resonance imaging, modified Dixon method, and magnetic resonance spectroscopy in measuring bone marrow fat. J Obes. 2013; 2013:298675. PMID: 23606951.
Article19. Hines CD, Yu H, Shimakawa A, McKenzie CA, Brittain JH, Reeder SB. T1 independent, T2* corrected MRI with accurate spectral modeling for quantification of fat: validation in a fat-water-SPIO phantom. J Magn Reson Imaging. 2009; 30:1215–1222. PMID: 19856457.20. Karampinos DC, Ruschke S, Dieckmeyer M, Eggers H, Kooijman H, Rummeny EJ, et al. Modeling of T2* decay in vertebral bone marrow fat quantification. NMR Biomed. 2015; 28:1535–1542. PMID: 26423583.21. Régis-Arnaud A, Guiu B, Walker PM, Krausé D, Ricolfi F, Ben Salem D. Bone marrow fat quantification of osteoporotic vertebral compression fractures: comparison of multi-voxel proton MR spectroscopy and chemical-shift gradient-echo MR imaging. Acta Radiol. 2011; 52:1032–1036. PMID: 21948596.
Article22. Shen W, Scherzer R, Gantz M, Chen J, Punyanitya M, Lewis CE, et al. Relationship between MRI-measured bone marrow adipose tissue and hip and spine bone mineral density in African-American and Caucasian participants: the CARDIA study. J Clin Endocrinol Metab. 2012; 97:1337–1346. PMID: 22319043.
Article23. Yu H, Shimakawa A, McKenzie CA, Brodsky E, Brittain JH, Reeder SB. Multiecho water-fat separation and simultaneous R2* estimation with multifrequency fat spectrum modeling. Magn Reson Med. 2008; 60:1122–1134. PMID: 18956464.24. Karampinos DC, Ruschke S, Dieckmeyer M, Diefenbach M, Franz D, Gersing AS, et al. Quantitative MRI and spectroscopy of bone marrow. J Magn Reson Imaging. 2018; 47:332–353. PMID: 28570033.
Article25. Dieckmeyer M, Ruschke S, Cordes C, Yap SP, Kooijman H, Hauner H, et al. The need for T2 correction on MRS-based vertebral bone marrow fat quantification: implications for bone marrow fat fraction age dependence. NMR Biomed. 2015; 28:432–439. PMID: 25683154.26. Liu CY, McKenzie CA, Yu H, Brittain JH, Reeder SB. Fat quantification with IDEAL gradient echo imaging: correction of bias from T(1) and noise. Magn Reson Med. 2007; 58:354–364. PMID: 17654578.27. Grimm A, Meyer H, Nickel MD, Nittka M, Raithel E, Chaudry O, et al. Evaluation of 2-point, 3-point, and 6-point Dixon magnetic resonance imaging with flexible echo timing for muscle fat quantification. Eur J Radiol. 2018; 103:57–64. PMID: 29803386.
Article
- Full Text Links
-
- Actions
-
Cited
- CITED
-
- Close
- Share
-
- Similar articles
-
- Comparison of Multi-Echo Dixon Methods with Volume Interpolated Breath-Hold Gradient Echo Magnetic Resonance Imaging in Fat-Signal Fraction Quantification of Paravertebral Muscle
- Investigation of Varied MR Spectra by TE and Metabolite Amount in the Localized Voxel using the MR Cone-shape Phantom
- Non-invasive quantification of hepatic fat content in healthy dogs by using proton magnetic resonance spectroscopy and dual gradient echo magnetic resonance imaging
- Correlation Between Vertebral Marrow Fat Fraction Measured Using Dixon Quantitative Chemical Shift MRI and BMD Value on Dual-energy X-ray Absorptiometry
- Magnetic Resonance Spectroscopy Finding in a Patient with Cerebral Fat Embolism
