Body Fat Percentile Curves for Korean Children and Adolescents: A Data from the Korea National Health and Nutrition Examination Survey 2009-2010
- Affiliations
-
- 1Department of Food Science and Nutrition, Dankook University, Yongin, Korea.
- 2Division of Health and Nutrition Survey, Korea Centers for Disease Control and Prevention, Cheongwon, Korea. kwoh27@korea.kr
- KMID: 1786944
- DOI: http://doi.org/10.3346/jkms.2013.28.3.443
Abstract
- A valid assessment of obesity in children and adolescents is important due to significant change in body composition during growth. This study aimed to develop percentile curves of body fat and fat free mass using the Lambda, Mu, and Sigma method, and to examine the relationship among body mass index (BMI), fat mass and fat free mass in Korean children and adolescents, using the Korea National Health and Nutrition Examination Survey (KNHANES) 2009-2010. The study subjects were 834 for boys and 745 for girls aged between 10 and 18 yr. Fat mass and fat free mass were measured by dual-energy x-ray absorptiometry. The patterns of development in body fat percentage, fat mass and fat free mass differed for boys and girls, showing a decreased fat mass with an increased fat free mass in boys but gradual increases with age in girls. The considerable proportion of boys and girls with relatively normal fat mass appeared to be misclassified to be at risk of overweight based on the BMI criteria. Therefore, the information on the percentiles of body fat and fat free mass with their patterns would be helpful to complement assessment of overweight and obesity based on BMI for Korean children and adolescents.
Keyword
MeSH Terms
Figure
-

Fig. 1 Percentile curves of the 5th, 25th, 50th, 75th, 85th, and 95th for body fat percentage (%BF), fat mass index (FMI) and fat free mass index (FFMI) by sex and age. FMI, fat mass (kg)/height (m)2; FFMI, fat free mass (kg)/height (m)2.
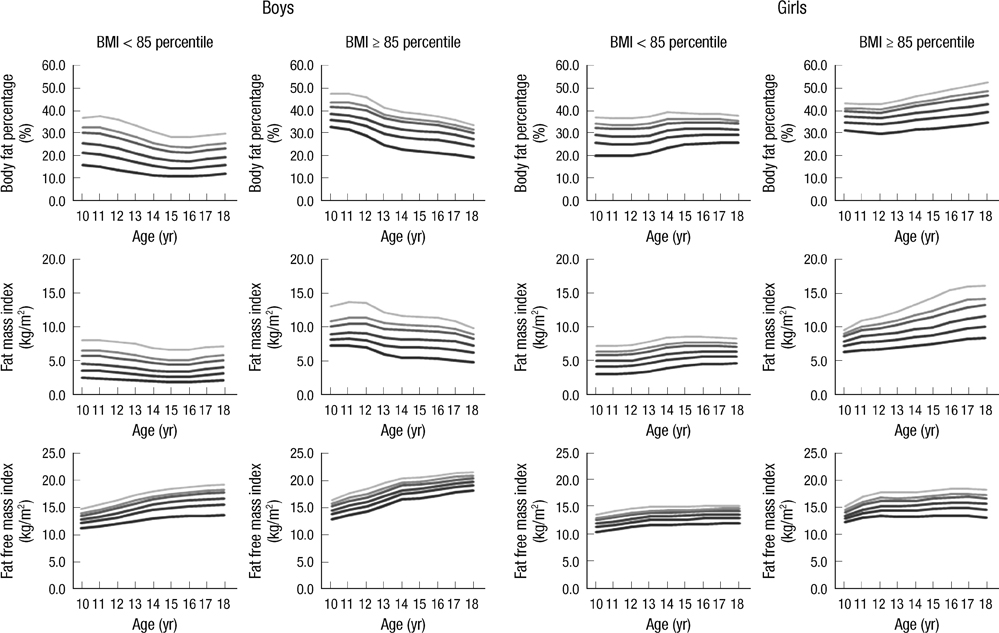
Fig. 2 Percentile curves of the 5th, 25th, 50th, 75th, 85th and 95th for body fat percentage (%BF), fat mass index (FMI) and fat free mass index (FFMI) according to body mass index (BMI) level by sex and age. FMI, fat mass (kg)/height (m)2; FFMI, fat free mass (kg)/height (m)2.
Cited by 2 articles
-
Reference Values of Body Composition Indices: The Korean National Health and Nutrition Examination Surveys
Hye Won Park, Ha Yeong Yoo, Chul-Hyun Kim, Hyeoijin Kim, Byung Ok Kwak, Kyo Sun Kim, Sochung Chung
Yonsei Med J. 2015;56(1):95-102. doi: 10.3349/ymj.2015.56.1.95.Body mass index and body composition scaling to height in children and adolescent
Sochung Chung
Ann Pediatr Endocrinol Metab. 2015;20(3):125-129. doi: 10.6065/apem.2015.20.3.125.
Reference
-
1. Lobstein T, Baur L, Uauy R. IASO International Obesity Task Force. Obesity in children and young people: a crisis in public health. Obes Rev. 2004. 5:4–104.2. Oh K, Jang MJ, Lee NY, Moon JS, Lee CG, Yoo MH, Kim YT. Prevalence and trends in obesity among Korean children and adolescents in 1997 and 2005. Korean J Pediatr. 2008. 51:950–955.3. Aronne LJ, Segal KR. Adiposity and fat distribution outcome measures: assessment and clinical implications. Obes Res. 2002. 10:14S–21S.4. Lee J, Chung DS, Kang JH, Yu BY. Comparison of visceral fat and liver fat as risk factors of metabolic syndrome. J Korean Med Sci. 2012. 27:184–189.5. Lafortuna CL, Maffiuletti NA, Agosti F, Sartorio A. Gender variations of body composition, muscle strength and power output in morbid obesity. Int J Obes (Lond). 2005. 29:833–841.6. Cole TJ, Bellizzi MC, Flegal KM, Dietz WH. Establishing a standard definition for child overweight and obesity worldwide: international survey. BMJ. 2000. 320:1240–1243.7. Ogden CL, Kuczmarski RJ, Flegal KM, Mei Z, Guo S, Wei R, Grummer-Strawn LM, Curtin LR, Roche AF, Johnson CL. Centers for Disease Control and Prevention 2000 growth charts for the United States: improvements to the 1977 National Center for Health Statistics version. Pediatrics. 2002. 109:45–60.8. Sweeting HN. Measurement and definitions of obesity in childhood and adolescence: a field guide for the uninitiated. Nutr J. 2007. 6:32.9. Brann LS. Classifying preadolescent boys based on their weight status and percent body fat produces different groups. J Am Diet Assoc. 2008. 108:1018–1022.10. Freedman DS, Wang J, Maynard LM, Thornton JC, Mei Z, Pierson RN, Dietz WH, Horlick M. Relation of BMI to fat and fat-free mass among children and adolescents. Int J Obes (Lond). 2005. 29:1–8.11. Freedman DS, Wang J, Thornton JC, Mei Z, Sopher AB, Pierson RN Jr, Dietz WH, Horlick M. Classification of body fatness by body mass index-for-age categories among children. Arch Pediatr Adolesc Med. 2009. 163:805–811.12. Demerath EW, Schubert CM, Maynard LM, Sun SS, Chumlea WC, Pickoff A, Czerwinski SA, Towne B, Siervogel RM. Do changes in body mass index percentile reflect changes in body composition in children? data from the Fels Longitudinal Study. Pediatrics. 2006. 117:e487–e495.13. Neovius M, Rasmussen F. Evaluation of BMI-based classification of adolescent overweight and obesity: choice of percentage body fat cutoffs exerts a large influence: the COMPASS Study. Eur J Clin Nutr. 2008. 62:1201–1207.14. Kurtoglu S, Mazicioglu MM, Ozturk A, Hatipoglu N, Cicek B, Ustunbas HB. Body fat reference curves for healthy Turkish children and adolescents. Eur J Pediatr. 2010. 169:1329–1335.15. Ma J, Feng N, Zhang SW, Pan YP, Huang YB. Comparison of changes in body composition during puberty development of obese and normal-weight children in China. Biomed Environ Sci. 2009. 22:413–418.16. Ogden CL, Li Y, Freedman DS, Borrud LG, Flegal KM. Smoothed percentage body fat percentiles for U.S. children and adolescents, 1999-2004. Natl Health Stat Report. 2011. 1–7.17. McCarthy HD, Cole TJ, Fry T, Jebb SA, Prentice AM. Body fat reference curves for children. Int J Obes (Lond). 2006. 30:598–602.18. Laurson KR, Eisenmann JC, Welk GJ. Body fat percentile curves for U.S. children and adolescents. Am J Prev Med. 2011. 41:S87–S92.19. Cole TJ, Pan H. LMSChartmaker. Tyne and Wear. 2005. accessed on 1 March 2012. England: Harlow Healthcare;Available at http://www.healthforallchildren.co.uk.20. Cole TJ, Green PJ. Smoothing reference centile curves: the LMS method and penalized likelihood. Stat Med. 1992. 11:1305–1319.21. Cole TJ. The LMS method for constructing normalized growth standards. Eur J Clin Nutr. 1990. 44:45–60.22. Korea Centers for Disease Control and Prevention. Standard growth charts of Korean children and adolescents in 2007. 2007. Seoul: Korea Centers for Disease Control and Prevention.23. Lee K, Lee S, Kim SY, Kim SJ, Kim YJ. Percent body fat cutoff values for classifying overweight and obesity recommended by the International Obesity Task Force (IOTF) in Korean children. Asia Pac J Clin Nutr. 2007. 16:649–655.24. Wells JC. Body composition in childhood: effects of normal growth and disease. Proc Nutr Soc. 2003. 62:521–528.25. Maynard LM, Wisemandle W, Roche AF, Chumlea WC, Guo SS, Siervogel RM. Childhood body composition in relation to body mass index. Pediatrics. 2001. 107:344–350.26. Deurenberg P, Deurenberg-Yap M, Guricci S. Asians are different from Caucasians and from each other in their body mass index/body fat percent relationship. Obes Rev. 2002. 3:141–146.27. Wang J, Thornton JC, Russell M, Burastero S, Heymsfield S, Pierson RN Jr. Asians have lower body mass index (BMI) but higher percent body fat than do whites: comparisons of anthropometric measurements. Am J Clin Nutr. 1994. 60:23–28.28. Deurenberg-Yap M, Niti M, Foo LL, Ng SA, Loke KY. Diagnostic accuracy of anthropometric indices for obesity screening among Asian adolescents. Ann Acad Med Singapore. 2009. 38:3–6.29. Nakao T, Komiya S. Reference norms for a fat-free mass index and fat mass index in the Japanese child population. J Physiol Anthropol Appl Human Sci. 2003. 22:293–298.30. Wells JC. A critique of the expression of paediatric body composition data. Arch Dis Child. 2001. 85:67–72.31. VanItallie TB, Yang MU, Heymsfield SB, Funk RC, Boileau RA. Height-normalized indices of the body's fat-free mass and fat mass: potentially useful indicators of nutritional status. Am J Clin Nutr. 1990. 52:953–959.32. Wells JC, Coward WA, Cole TJ, Davies PS. The contribution of fat and fat-free tissue to body mass index in contemporary children and the reference child. Int J Obes Relat Metab Disord. 2002. 26:1323–1328.33. Park H, Park K, Kim MH, Kim GS, Chung S. Gender differences in relationship between fat-free mass index and fat mass index among Korean children using body composition chart. Yonsei Med J. 2011. 52:948–952.34. Kim HI, Kim JT, Yu SH, Kwak SH, Jang HC, Park KS, Kim SY, Lee HK, Cho YM. Gender differences in diagnostic values of visceral fat area and waist circumference for predicting metabolic syndrome in Koreans. J Korean Med Sci. 2011. 26:906–913.35. Helba M, Binkovitz LA. Pediatric body composition analysis with dual-energy X-ray absorptiometry. Pediatr Radiol. 2009. 39:647–656.
- Full Text Links
-
- Actions
-
Cited
- CITED
-
- Close
- Share
-
- Similar articles
-
- Reference Values of Body Composition Indices: The Korean National Health and Nutrition Examination Surveys
- Cutoff values of body mass index for severe obesity in Korean children and adolescents: the 99th percentile versus 120% of the 95th percentile
- Reference Values for Waist Circumference and Waist–Height Ratio in Korean Children and Adolescents
- Factors Related to Eating Habits and Nutrition Status of Mother Affecting on Body Mass Index of Children aged 1-5years: Data from the Fifth Korea National Health and Nutrition Examination Survey, 2010-2011
- Diagnosis of Severe Obesity in Korean Children and Adolescents
