Prediction of Plasma Hemoglobin Concentration by Near-Infrared Spectroscopy
- Affiliations
-
- 1Department of Anesthesiology and Pain Medicine, Ilsan Hospital, Dongguk University College of Medicine, Goyang, Korea. ylee@dongguk.ac.kr
- 2Department of Anesthesiology and Pain Medicine, Sanggye Paik Hospital, Inje University College of Medicine, Seoul, Korea.
- KMID: 1785828
- DOI: http://doi.org/10.3346/jkms.2008.23.4.674
Abstract
- The estimation of plasma hemoglobin concentration (Hb) is among one of the daily activities in the practice of clinical anesthesiology. The near-infrared spectroscopy of the brain (rSO2) represents a balance between cerebral oxygen delivery and consumption. This study was designed to assess the value of rSO2 in the prediction of the Hb level while other variables were mathematically controlled. Thirty healthy adult patients undergoing spine surgery, expected to have a moderate degree of intraoperative bleeding, were enrolled in this study. General anesthesia was given and ventilation was mechanically controlled. Measurement of Hb and PaCO2 were performed at random periods of time. We obtained a total of 97 data combinations for the 30 study patients. The Hb was regressed by independent variables including rSO2 and PaCO2. A multilinear regression analysis was performed and the final regression equation was expressed only with statistically significant variables. The measured Hb was tightly regressed with three variables. The final regression equation was Hb=+8.580+0.238.rSO2-0.338.PaCO2-0.004.anesthetic exposure duration (Tmin) (p=0.000, r(2)=0.809). Near-infrared spectroscopy was shown to be a valuable predictor of plasma Hb in the clinical anesthesiology setting.
MeSH Terms
Figure
-

Fig. 1 Multilinear regression analysis of Hb by rSO2 and PaCO2. Regression equation was Hb=+8.332+0.238 · rSO2-0.338 · PaCO2 (p=0.000, r2=0.809). Changes of rSO2 and PaCO2 reflected the changes of Hb.
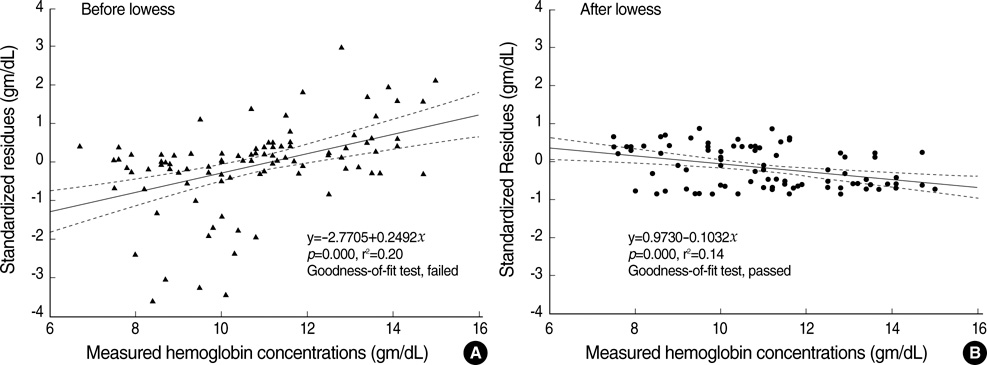
Fig. 2 Standardized residuals vs. Hb before (triangle-up symbols and dotted line) and after (round symbols and straight line) lowess technique. A window is placed about χ (Hb); data points that lie inside the window are weighted so that nearby points get the weight and a robust weighted regression is to predict y value at χ. The parameter, controlling the window's size, is set at 0.2.
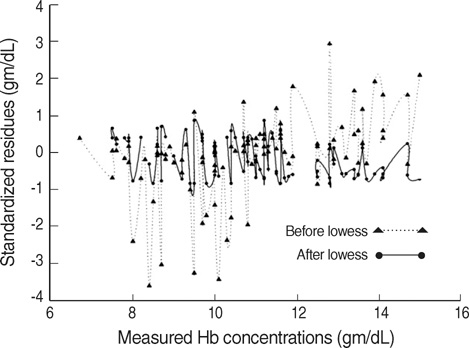
Fig. 3 Scatter plot of standardized residuals (predicted Hb-Hb) and Hb before (a) and after (b) lowess techniques. Lowess'ed data points were fitted linearly more successfully, which revealed the existence of hemoglobin dependence of prediction of Hb by rSO2. Predicted Hb tends to underestimate Hb at higher Hb, while overestimate Hb at lower Hb.
Reference
-
1. Sanchez-Carrillo CI, Ramirez-Sanchez TJ, Zambrana-Castaneda M, Selwyn BJ. Test of a noninvasive instrument for measuring hemoglobin concentration. Int J Technol Assess Health Care. 1989. 5:659–667.
Article2. Esenaliev RO, Petrov YY, Hartrumpf O, Deyo DJ, Prough DS. Continuous, noninvasive monitoring of total hemoglobin concentration by an optoacoustic technique. Appl Opt. 2004. 43:3401–3407.
Article3. Petrova IY, Esenaliev RO, Petrov YY, Brecht HP, Svensen CH, Olsson J, Deyo DJ, Prough DS. Optoacoustic monitoring of blood hemoglobin concentration: a pilot clinical study. Opt Lett. 2005. 30:1677–1679.
Article4. Kasler M, von Glass W, Albrecht HP, Lang T. Noninvasive intraoperative measurement of intracapillary hemoglobin oxygenation and relative hemoglobin concentration in surgical skin flaps. HNO. 1990. 38:375–378.5. Rabe H, Stupp N, Ozgun M, Harms E, Jungmann H. Measurement of transcutaneous hemoglobin concentration by noninvasive whitelight spectroscopy in infants. Pediatrics. 2005. 116:841–843.
Article6. Dunn AK, Devor A, Bolay H, Andermann ML, Moskowitz MA, Dale AM, Boas DA. Simultaneous imaging of total cerebral hemoglobin concentration, oxygenation, and blood flow during functional activation. Opt Lett. 2003. 28:28–30.
Article7. Venables WN, Ripley BD. Modern applied statistics with S-PLUS. 1999. 3rd ed. New-York: Springer-Verlag;281–285.8. Muizelaar JP, Bouma GJ, Levasseur JE, Kontos HA. Effect of hematocrit variations on cerebral blood flow and basilar artery diameter in vivo. Am J Physiol. 1992. 262(4 Pt 2):H949–H954.
Article9. Rebel A, Ulatowski JA, Kwansa H, Bucci E, Koehler RC. Cerebrovascular response to decreased hematocrit: effect of cell-free hemoglobin, plasma viscosity, and CO2. Am J Physiol Heart Circ Physiol. 2003. 285:H1600–H1608.10. Harrigan MR, Satti JA, Deveikis JP, Thompson BG. Effect of hematocrit on calculation of cerebral blood flow and lambda in xenon CT. Keio J Med. 2000. 49:Suppl 1. A36–A37.11. Dullenkopf A, Lohmeyer U, Salgo B, Gerber AC, Weiss M. Non-invasive monitoring of haemoglobin concentration in paediatric surgical patients using near-infrared spectroscopy. Anaesthesia. 2004. 59:453–458.
Article12. Boarini DJ, Kassell NF, Coester HC, Butler M, Sokoll MD. Comparison of systemic and cerebrovascular effects of isoflurane and halothane. Neurosurgery. 1984. 15:400–409.
Article13. Kuroda Y, Murakami M, Tsuruta J, Murakawa T, Sakabe T. Blood flow velocity of middle cerebral artery during prolonged anesthesia with halothane, isoflurane, and sevoflurane in humans. Anesthesiology. 1997. 87:527–532.
Article
- Full Text Links
-
- Actions
-
Cited
- CITED
-
- Close
- Share
-
- Similar articles
-
- Two-channel Near-infrared Spectroscopic Analysis of Association of Paranoia Symptoms with Prefrontal Activation
- Clinical Application of Near Infrared Spectroscopy
- Increased Ventrolateral Prefrontal Cortex Activation during Accurate Eyewitness Memory Retrieval: An Exploratory Functional Near-Infrared Spectroscopy Study
- Prefrontal hemodynamic responses and the degree of flow experience among occupational therapy students during their performance of a cognitive task
- Calculi in Hydrocele: Incidence and Results of Infrared Spectroscopy Analysis
