Hepatic Arterioportal Shunts: Dynamic CT and MR Features
- Affiliations
-
- 1Department of Radiology, Seoul National University College of Medicine and the Institute of Radiation Medicine, SNUMRC. choibi@radcom.snu.ac.kr
- 2Department of Diagnostic Radiology, Chonbuk National University Hospital.
- KMID: 1758441
- DOI: http://doi.org/10.3348/kjr.2002.3.1.1
Abstract
- With the increased temporal resolution available in dynamic computed tomography (CT) and magnetic resonance imaging (MRI), hepatic arterioportal shunts are now more frequently encountered than in the past. The condition occurs in various hepatic diseases in which portal or hepatic venous flow is compromised. The underlying mechanism and the degree of shunt affect its appearance at dynamic imaging. The dynamic CT and MRI findings have been summarized as early enhancement of peripheral portal veins, and wedge-shaped transient parenchymal enhancement during the hepatic arterial phase. Recognition of arterioportal shunt can suggest the presence of a previously unsuspected disorder and avoids false-positive diagnosis or overestimation of a hepatic disease. Familiarity with the pathophysiology of arterioportal shunt also allows investigation of the hepatic hemodynamic changes occurring in various hepatic diseases.
Keyword
MeSH Terms
-
Arteriovenous Fistula/*diagnosis/etiology/physiopathology
Carcinoma, Hepatocellular/complications
Chemoembolization, Therapeutic/adverse effects
*Hepatic Artery
Human
Liver Circulation/physiology
Liver Diseases/complications
Liver Neoplasms/complications
*Magnetic Resonance Imaging
Portal System/physiology
*Portal Vein
*Tomography, X-Ray Computed
Figure
-

Fig. 1 Portal vein thrombosis occurring in pylephlebitis. A. CT scan obtained during hepatic arterial phase shows transient high attenuation of the right anterior segments of the right lobe and segments III and IV (arrows). B. Portal venous phase image shows bland thrombi, producing inflow obstruction, within the portal veins (arrows). The portal vein supplying segment II is patent (arrowheads). Note that the straight border of transient hepatic attenuation difference on the hepatic arterial phase image (arrows in (A)) intersects the hepatic vein (small arrow in (B)).
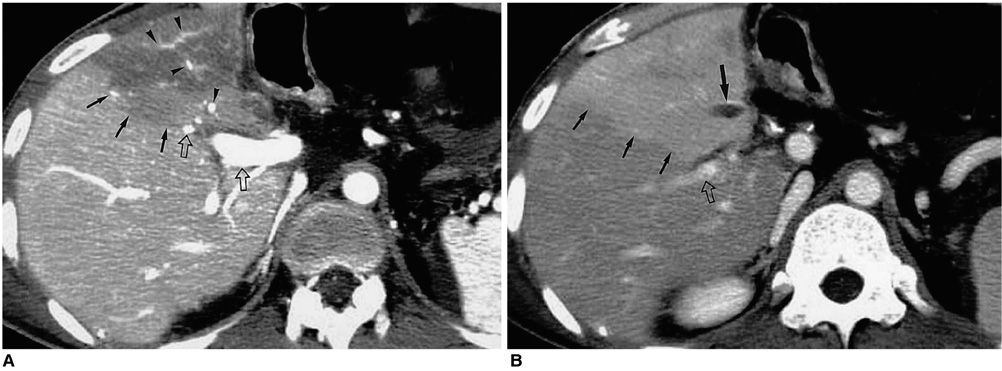
Fig. 2 Attenuation differences secondary to hepatic vein obstruction in a transplanted liver. A. CT scan obtained during portal venous phase shows hypoattenuation of the anterior segment of the transplanted right lobe despite normal enhancement of the portal veins (arrowheads) inside the corresponding area. B. CT scan obtained during the equilibrium phase reveals thrombosed hepatic vein (arrow) which was ligated during surgery. The anterior segment of the transplanted right lobe appears hyperattenuated, producing a negative image of (A). Note that the straight border (small arrows in (A) and (B)) of transient hepatic attenuation difference intersects the portal veins (open arrows in (A) and (B)).
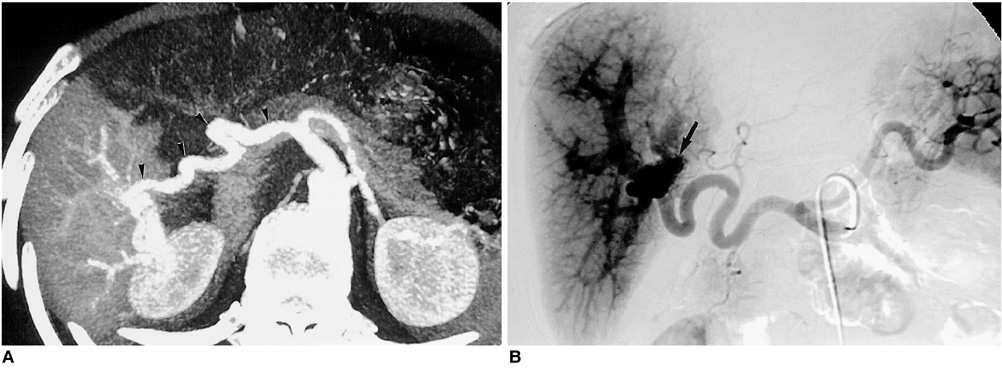
Fig. 3 Arterioportal fistula in a 42-year-old man with symptoms of portal hypertension such as recurrent gastrointestinal bleeding and ascites. He had undergone percutaneous liver biopsy seven years earlier. A. A maximum-intensity projection image of CT scans obtained during hepatic arterial phase shows hyperattenuation of the right lobe of the liver, with an enlarged hepatic artery (arrowheads). B. Celiac angiogram demonstrates that shunted arterial flow from the fistulous point (arrow) is instantaneously drained into portal branches in the entire right lobe of the liver. Subsequent embolization of the fistula relieved this patient's symptoms.
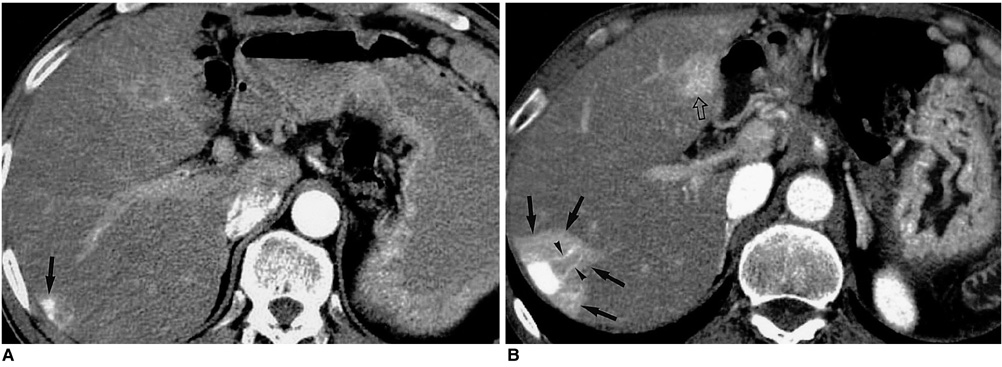
Fig. 4 Arterioportal shunt secondary to hemangioma in a patient with pancreatic carcinoma. A. CT scan obtained during hepatic arterial phase shows a hemangioma (arrow) at the right lobe of the liver. B. Follow-up CT scan obtained six months later shows wedge-shaped transient hyperattenuation of the adjacent parenchyma (arrows), with early opacification of the peripheral portal veins (arrowheads). Another area of transient parenchymal enhancement is apparent (open arrow), and was secondary to another small hemangioma in contiguous section (not shown). The change observed in the degree of Arterioportal shunt between figures (A) and (B) might be due to diminished portal blood flow caused by severe stenosis of the main portal vein (not shown).

Fig. 5 Arterioportal shunt secondary to percutaneous ethanol injection therapy in a patient with HCC. A. CT scan obtained during portal venous phase shows a perfusion defect at the site of previous percutaneous ethanol injection therapy (arrows), as well as multiple nodular tumors with iodized-oil uptake (arrowheads). An extrahepatic metastatic nodule, probably located at the previous needle tract for another percutaneous ethanol injection therapy (open arrow), is visible. B. Celiac angiogram obtained before transarterial chemoembolization indicated an area of patchy staining (arrowheads) in the right hepatic lobe due to the presence of arterioportal shunt, as well as various other nodular staining lesions (arrows). C. Precontrast CT obtained two weeks after transarterial chemoembolization shows wedge-shaped retention of iodized oil in the area corresponding to arterioportal shunt (arrowheads). Follow-up CT (not shown) indicated that in contrast to other nodular uptake by tumors, this retention had washed out.
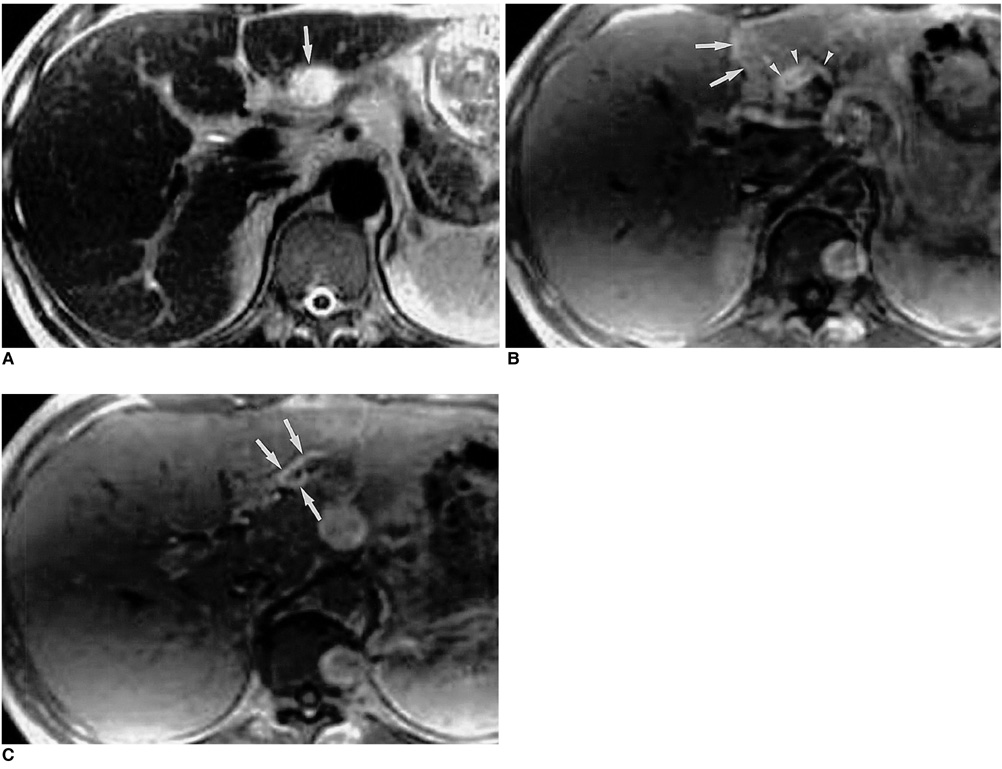
Fig. 6 Arterioportal shunt secondary to hemangioma. A. T2-weighted MRI shows an exophytic hemangioma (arrow) with bright signal intensity in the left lobe of the liver. B. Gadolinium-enhanced dynamic MRI obtained during hepatic arterial phase shows a focal hyperintense area due to arterioportal shunt in adjacent parenchyma (arrows), as well as peripheral nodular enhancement of the hemangioma (arrowheads). C. Further cranial section demonstrates early enhancement of the peripheral portal veins (arrows).
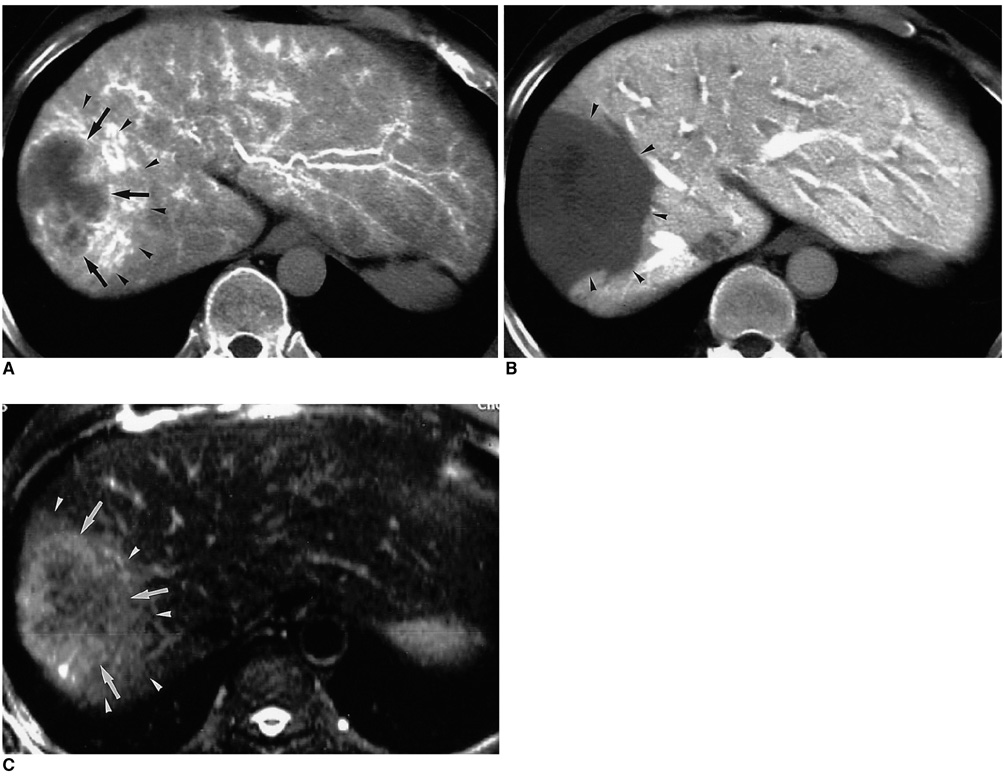
Fig. 7 Arterioportal shunt secondary to hepatocellular carcinoma. A. CT scan obtained during hepatic arteriography shows wedgeshaped hyperperfusion (arrowheads) around the tumor (arrows). B. CT performed during arterial portography shows a perfusion defect at the corresponding area (arrowheads). C. T2-weighted MRI shows a hyperintense area (arrowheads) around the tumor (arrows), which corresponds to the area of arterioportal shunt.
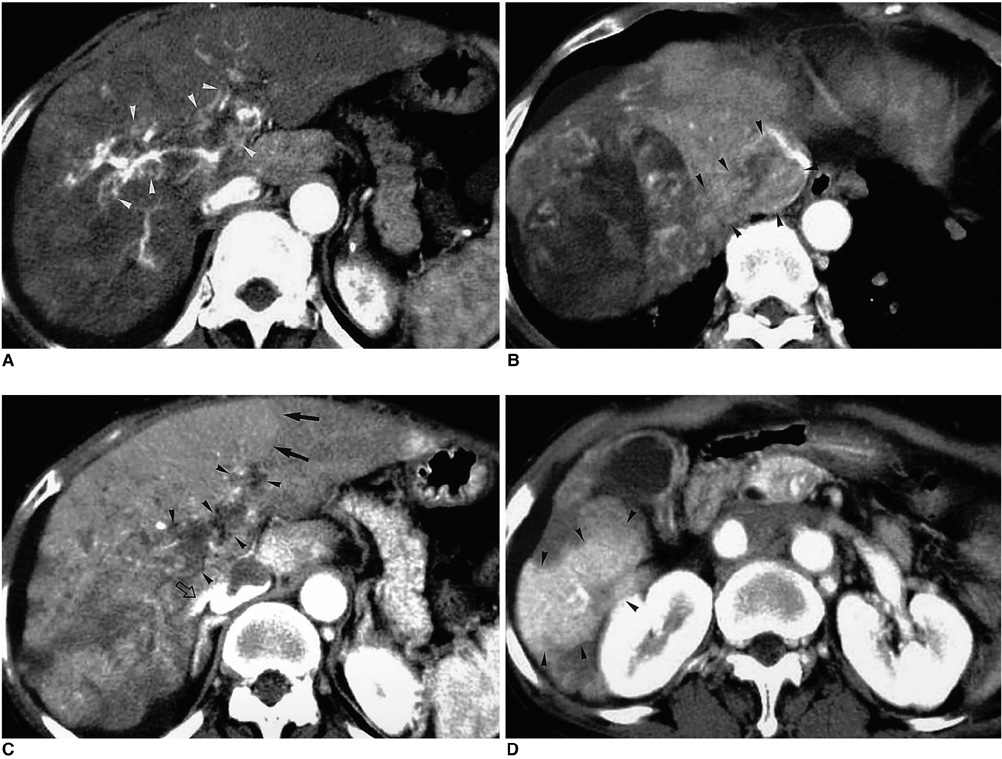
Fig. 8 A 53-year-old man with hepatocellular carcinoma. A. CT scan obtained during the aortic phase shows a 'thread-and-streak' sign at the tumor thrombus in the portal vein (arrowheads). B. Hepatic arterial phase image shows diffuse hepatocellular carcinoma with heterogeneous attenuation in the right lobe invading the right hepatic vein and inferior vena cava (arrowheads). Note the 'thread-and-streak' sign at the tumor thrombus. C. CT scan obtained caudad to figure (B) shows diffuse hepatocellular carcinoma in the right lobe invading the portal vein (arrowheads). The straight border at the left lobe (arrows) does not indicate the tumor margin but appears to be caused by arterioportal shunt. Note that blood flow in the inferior accessory hepatic vein (open arrow) is highly opacified. D. Portal venous phase image shows an area of abnormal hyperattenuation at segment VI (arrowheads). In this case, the shunted flows from the tumor thrombus in the hepatic and portal veins seem to drain into segment VI and then into the inferior accessory hepatic vein.
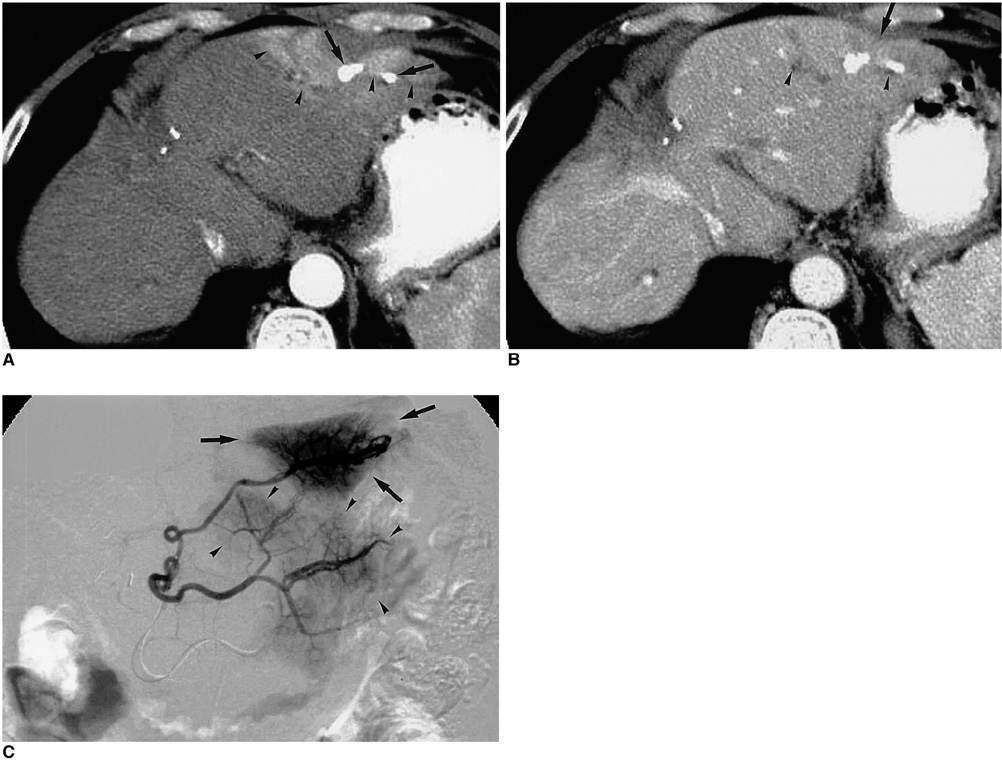
Fig. 9 Arterioportal shunt secondary to transarterial chemoembolization. A. CT scan obtained during hepatic arterial phase shows peripheral wedge-shaped hyperattenuation caused by arterioportal shunt at the left lobe of the liver (arrowheads). Note the nodular iodized-oil uptake (arrows) inside the hyperattenuating area. B. Portal venous phase image shows that parenchymal enhancement has returned to normal. Note the retracted capsule (arrow) and minimally dilated bile ducts (arrowheads); both findings may indicate the presence of ischemic injury due to repeated transarterial chemoembolization. C. Left hepatic arteriogram reveals wedge-shaped staining and retrograde opacification of the peripheral portal vein in the corresponding area (arrows) and other areas (arrowheads).
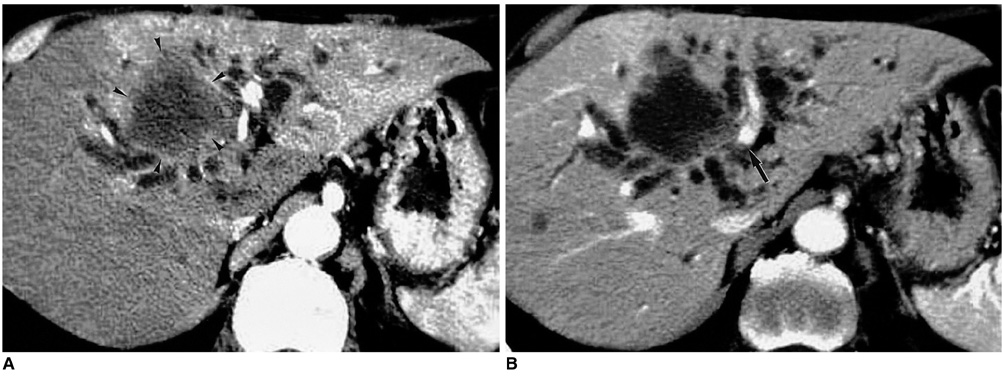
Fig. 10 Arterioportal shunt secondary to cholangiocarcinoma. A. CT scan obtained during hepatic arterial phase shows diffuse hyperattenuation at the left lobe of the liver, as well as a large hypoattenuating mass (arrowheads) and dilated bile ducts. B. Portal venous phase image demonstrates that parenchymal enhancement has returned to nearly normal. Note that the left portal vein is encased by the tumor (arrow).

Fig. 11 Nodular-shaped nontumorous arterioportal shunt mimicking hepatic tumor in cirrhotic liver. A. CT scan obtained during hepatic arterial phase shows a nodular hyperattenuating lesion (arrow) in the right lobe of the liver. Note the subtle, tiny portal branch inside the lesion. B. Subsequent hepatic angiogram shows multiple patchy areas of staining in the liver (arrowheads), with early opacification of the portal veins. C. Follow-up CT scan obtained during hepatic arterial phase shows no hyperattenuating lesion in the same area, indicating that the lesion depicted in (A) was a nontumorous arterioportal shunt.
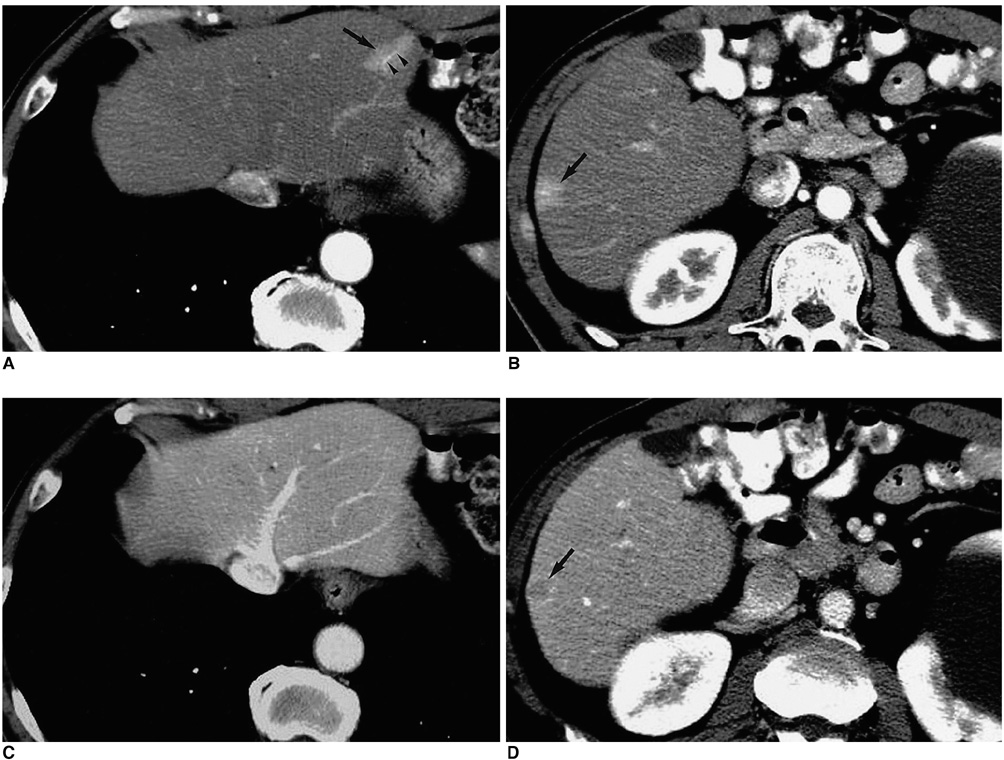
Fig. 12 Tumorous (hepatocellular carcinoma) and nontumorous arterioportal shunt in cirrhotic liver. A, B. CT scans obtained during hepatic arterial phase depict focal hyperattenuating lesions in segment II (arrow in (A)) and segment VI (arrow in (B)). Both lesions are rectangular-shaped and located in subcapsular areas. Note the enhanced peripheral portal vein (arrowheads in (A)) inside the lesion in segment II. C, D. Portal venous phase images show no lesion in segment II, indicating that the lesion depicted in (A) is a nontumorous arterioportal shunt; however, a nodular hypoattenuating lesion with rim enhancement is seen in segment VI (arrow in (D)), indicating hepatocellular carcinoma. Note that the size and shape of the lesion in segment VI differ slightly between the hepatic arterial phase (B) and portal venous phase (D) images, indicating the presence of arterioportal shunt around the tumor.
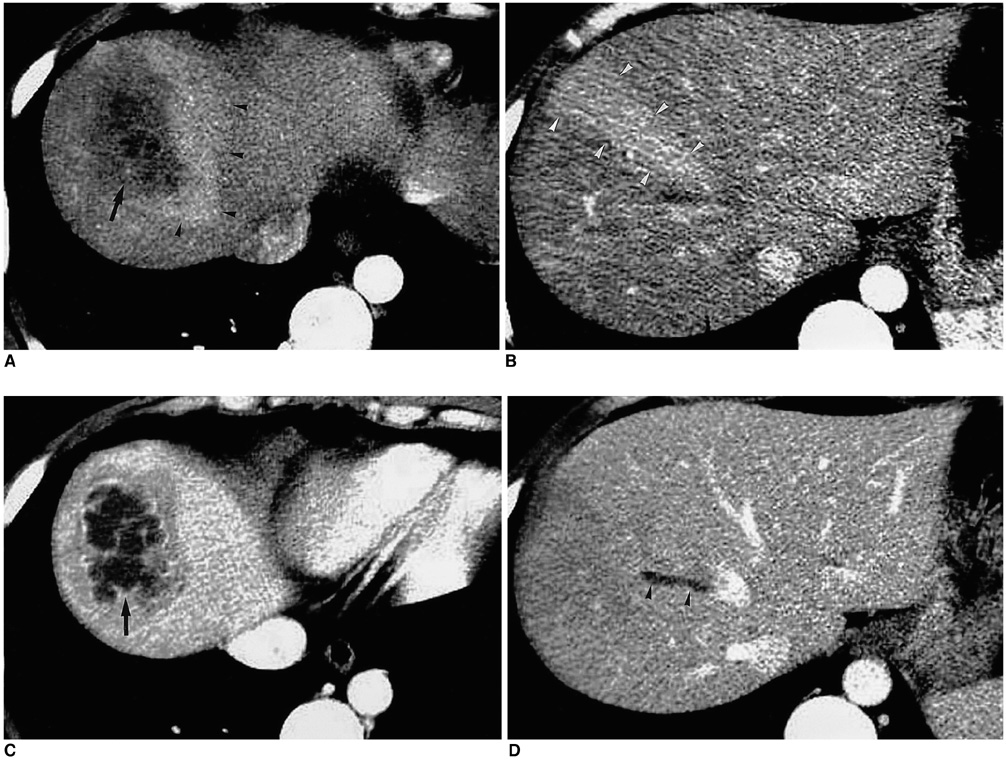
Fig. 13 Arterioportal shunt secondary to hepatic abscess. A, B. CT scans obtained during hepatic arterial phase show a hepatic abscess (arrow), with wedge-shaped hyperattenuation (arrowheads) in the adjacent parenchyma. C, D. Portal venous phase images depict abscess wall enhancement, and the demarcation of the abscess is clearer than in the hepatic arterial phase image (arrow). Portal venous phase images show that parenchymal enhancement has returned to normal. Note that the wedge-shaped parenchymal hyperattenuation demonstrated by hepatic arterial phase imaging points to the thrombosed hepatic vein (arrowheads).
Cited by 2 articles
-
Atypical Appearance of Hepatocellular Carcinoma and Its Mimickers: How to Solve Challenging Cases Using Gadoxetic Acid-Enhanced Liver Magnetic Resonance Imaging
Jae Hyun Kim, Ijin Joo, Jeong Min Lee
Korean J Radiol. 2019;20(7):1019-1041. doi: 10.3348/kjr.2018.0636.Characterizing Computed Tomography-Detected Arterial Hyperenhancing-Only Lesions in Patients at Risk of Hepatocellular Carcinoma: Can Non-Contrast Magnetic Resonance Imaging Be Used for Sequential Imaging?
So Hyun Park, Bohyun Kim, So Yeon Kim, Seung Joon Choi, Jimi Huh, Hye Jin Kim, Kyung Won Kim, Seung Soo Lee
Korean J Radiol. 2020;21(3):280-289. doi: 10.3348/kjr.2019.0447.
Reference
-
1. Choi BI, Chung JW, Itai Y, Matsui O, Han JK, Han MC. Hepatic abnormalities related to blood flow: evaluation with dual-phase helical CT. Abdom Imaging. 1999. 24:340–356.2. Ternberg JL, Butcher HR Jr. Blood flow relation between hepatic artery and portal vein. Science. 1965. 150:1030–1031.3. Itai Y, Matsui O. Blood flow and liver imaging. Radiology. 1997. 202:306–314.4. McCuskey RS. A dynamic and static study of hepatic arterioles and hepatic sphincters. Am J Anat. 1966. 119:455–477.5. Bookstein JJ, Cho KJ, Davis GB, Dail D. Arterioportal communications: observations and hypotheses concerning transsinusoidal and transvasal types. Radiology. 1982. 142:581–590.6. Cho KJ, Lunderquist A. The peribiliary vascular plexus: the microvascular architecture of the bile duct in the rabbit and in clinical cases. Radiology. 1983. 147:357–364.7. Itai Y, Furui S, Ohtomo K, et al. Dynamic CT features of arterioportal shunts in hepatocellular carcinoma. AJR. 1986. 146:723–727.8. Sato M, Ishida H, Konno K, et al. Longstanding arterioportal fistula after laparoscopic liver biopsy. Abdom Imaging. 1999. 24:383–385.9. Itai Y, Moss AA, Goldberg HI. Transient hepatic difference of lobar or segmental distribution detected by dynamic computed tomography. Radiology. 1982. 144:835–839.10. Matsui O, Takashima T, Kadoya M, et al. Segmental staining on hepatic arteriography as a sign of intrahepatic portal vein obstruction. Radiology. 1984. 152:601–606.11. Kanazawa S, Wright KC, Kasi LP, Charnsangavej C, Wallace S. Preliminary experimental evaluation of temporary segmental hepatic venous occlusion: angiographic, pathologic, and scintigraphic findings. J Vasc Interv Radiol. 1993. 4:759–766.12. Murata S, Itai Y, Asato M, et al. Effect of temporary occlusion of the hepatic vein on dual blood in the liver: evaluation with spiral CT. Radiology. 1995. 197:351–356.13. Mathieu D, Vasile N, Menu Y, Van Beers B, Lorphelin JM, Pringot J. Budd-Chiari syndrome: dynamic CT. Radiology. 1987. 165:409–413.14. Aspestrand F, Schrumpf E, Jacobsen M, Hanssen L, Endresen K. Increased lymphatic flow from the liver in different intra- and extrahepatic diseases demonstrated by CT. J Comput Assist Tomogr. 1991. 15:550–554.15. Hiraki T, Kanazawa S, Mimura H, et al. Altered hepatic hemodynamics caused by temporary occlusion of the right hepatic vein: evaluation with Doppler US in 14 patients. Radiology. 2001. 220:357–364.16. Itai Y, Murata S, Kurosaki Y. Straight border sign of the liver: spectrum of CT appearances and causes. RadioGraphics. 1995. 15:1089–1102.17. Sergi Q, Carmen S, Esther P, Eva C, Mercedes PL, Agusti AC. Improved diagnosis of hepatic perfusion disorders: value of hepatic arterial phase imaging during helical CT. RadioGraphics. 2001. 21:65–81.18. Kim TK, Choi BI, Han JK, Chung JW, Park JH, Han MC. Nontumorous arterioportal shunt mimicking hypervascular tumor in cirrhotic liver: two-phase spiral CT findings. Radiology. 1998. 208:597–603.19. Lee W, Chung JW, Kim HB. Acute hepatic vein occlusion: spiral CT findings in an experimental study. Abdom Imaging. 2002. (in press).20. Morse SS, Sniderman KW, Galloway S, et al. Hepatoma, arterioportal shunting, and hyperkinetic portal hypertension: therapeutic embolization. Radiology. 1985. 155:77–82.21. Yu JS, Kim KW, Sung KB, Lee JT, Yoo HS. Small arterial-portal venous shunts: a cause of pseudolesions at hepatic imaging. Radiology. 1997. 203:737–742.22. Tochio H, Okabe Y, Tomita S, et al. Hemodynamic change of intra-hepatic arterial-portal shunting by meal: evaluation by color Doppler imaging. J Gastroenterol Imaging. 1999. 1:707–715.23. Lim JH, Lee SJ, Lee WJ, Lim HK, Choo SW, Choo IW. Iodized oil retention due to postbiopsy arterioportal shunt: a false-positive lesion in the investigation of hepatocellular carcinoma. Abdom Imaging. 1999. 24:165–170.24. Yu JS, Kim KW, Jeong MG, Lee JT, Yoo HS. Nontumorous hepatic arterial-portal venous shunts: MR imaging findings. Radiology. 2000. 217:750–756.25. Ito K, Honjo K, Fujita T, Awaya H, Matsumoto T, Matsunaga N. Hepatic parenchymal hyperperfusion abnormalities detected with multisection dynamic MR imaging: appearance and interpretation. J Magn Reson Imaging. 1996. 6:861–867.26. Ito K, Honjo K, Fujita T, Awaya H, Matsumoto T, Matsunaga N. Enhanced MR imaging of the liver after ethanol treatment of hepatocellular carcinoma: evaluation of areas of hyperperfusion adjacent to the tumor. AJR. 1995. 164:1413–1417.27. Balci NC, Semelka RC, Noone TC, et al. Pyogenic Hepatic Abscesses: MRI findings on T1- and T2-weighted and serial gadolinium-enhanced gradient-echo images. J Magn Reson imaging. 1999. 9:285–290.28. Itai Y, Ohtomo K, Kokubo T, Okada Y, Yamauchi T, Yoshida H. Segmental intensity differences in the liver on MR images: a sign of intrahepatic portal flow stoppage. Radiology. 1988. 167:17–19.29. Itai Y, Ohtomo K, Furui S, Minami M, Yoshikawa K, Yashiro N. Lobar intensity differences of the liver on MR imaging. J Comput Assist Tomogr. 1986. 10:236–241.30. Kawamori Y, Matsui O, Kitagawa K, et al. Segmental hepatic iron deposition due to peripheral portal vein tumor thrombus: MR features. J Comput Assist Tomogr. 1991. 15:1042–1044.31. Scharf J, Hoffmann V, Lehnert T, Anselm H, Richter GM, Kauffmann GW. Pseudolesions at T1-weighted gradient-echo imaging after administration of superparamagnetic iron oxide: comparison with portal perfusion abnormalities at CT during arterial portography. Radiology. 1998. 207:67–72.32. Mori K, Yoshida H, Itai Y, et al. Arterioportal shunts in cirrhotic patients: evaluation of the difference between tumorous and nontumorous arterioportal shunts on MR imaging with superparamagnetic iron oxide. AJR. 2000. 175:1659–1664.33. Okuda K, Musha H, Yoshida T, et al. Demonstration of growing casts of hepatocellular carcinoma in the portal vein by celiac angiography: the thread and streaks sign. Radiology. 1975. 117:303–309.34. Suzuki M, Itoh H, Konishi H, Ida M, Matsui O, Takashima T. Hepatocellular carcinoma involving the portal vein. J Comput Assist Tomogr. 1982. 6:831–832.35. Novick SL, Fishman EK. Portal vein thrombosis: spectrum of helical CT and CT angiographic findings. Abdom Imaging. 1998. 23:505–510.36. Ueda K, Matsui O, Kawamori Y, et al. Hypervascular hepatocellular carcinoma: evaluation of hemodynamics with dynamic CT during hepatic arteriography. Radiology. 1998. 206:161–166.37. Bronowicki J, Vetter D, Dumas F, et al. Transcatheter oily chemoembolization for hepatocellular carcinoma. A 4-year study of 127 French patients. Cancer. 1994. 74:16–24.38. Chung JW, Park JH, Han JK, et al. Hepatic tumors: predisposing factors for complications of transcatheter oily chemoembolization. Radiology. 1996. 198:33–40.39. Chen JH, Chen WP, Huang CL, Shen WC. Dynamic helical CT as a novel technique for diagnosing hepatic perfusion disorders. Hepatogastroenterology. 1999. 46:303–307.40. Zhang Y, Uchida M, Abe T, Nishimura H, Hayabuchi N, Nakashima Y. Intrahepatic peripheral cholangiocarcinoma: comparison of dynamic CT and dynamic MRI. J Comput Assist Tomogr. 1999. 23:670–677.41. Hanafusa K, Ohashi I, Himeno Y, Suzuki S, Shibuya H. Hepatic hemangioma: findings with two-phase CT. Radiology. 1995. 196:465–469.42. Kim KW, Kim TK, Han JK, Kim AY, Lee HJ, Choi BI. Hepatic hemangiomas with arterioportal shunt: findings at two-phase CT. Radiology. 2001. 219:707–711.43. Haratake J, Hisaoka M, Yamamoto O, Horie A. Morphological changes of hepatic microcirculation in experimental rat cirrhosis: a scanning electron microscopic study. Hepatology. 1991. 13:952–956.44. Villeneuve JP, Dagenais M, Huet PM, Roy A, Lapointe R, Marleau D. The hepatic microcirculation in the isolated perfused human liver. Hepatology. 1996. 23:24–31.45. Lee KH, Choi BI, Han JK, Jang HJ, Kim TK, Han MC. Nodular hepatocellular carcinoma: variation of tumor conspicuity on single-level dynamic scan and optimization of fixed delay times for two-phase helical CT. J Comput Assist Tomogr. 2000. 24:212–218.46. Yu JS, Kim KW, Kim EK, Lee JT, Yoo HS. Contrast enhancement of small hepatocellular carcinoma: usefulness of three successive early image acquisitions during multiphase dynamic MR imaging. AJR. 1999. 173:597–604.47. Lim HK, Choi DG, Lee JW, et al. Hepatocellular carcinoma treated with percutaneous radio-frequency ablation: evaluation with follow-up multiphase helical CT. Radiology. 2001. 221:447–454.48. Lee SJ, Lim JH, Lee WJ, Lim HK, Choo SW, Choo IW. Transient subsegmental hepatic parenchymal enhancement on dynamic CT: a sign of postbiopsy arterioportal shunt. J Comput Assist Tomogr. 1997. 21:355–360.49. Fujita T, Honjo K, Ito K, et al. Pictorial essay. Dynamic MR follow-up of small hepatocellular carcinoma after percutaneous ethanol injection therapy. J Comput Assist Tomogr. 1998. 22:379–386.50. Gabata T, Kadoya M, Matsui O, et al. Dynamic CT of hepatic abscesses: significance of transient segmental enhancement. AJR. 2001. 176:675–679.51. Yamashita K, Jin MJ, Hirose Y, et al. CT finding of transient focal increased attenuation of the liver adjacent to the gallbladder in acute cholecystitis. AJR. 1995. 164:343–346.52. Matsui O, Takahashi S, Kadoya M, et al. Pseudolesion in segment IV of the liver at CT during arterial portography: correlation with aberrant gastric venous drainage. Radiology. 1994. 193:31–35.53. Kanematsu M, Hoshi H, Imaeda T, et al. Nonpathological focal enhancements on spiral CT hepatic angiography. Abdom Imaging. 1997. 22:55–59.54. Matsui O, Kadoya M, Takahashi S, et al. Focal sparing of segment IV in fatty livers shown by sonography and CT: correlation with aberrant gastric venous drainage. AJR. 1995. 164:1137–1140.55. Paulson EK, Baker ME, Spritzer CE, Leder RA, Gulliver DJ, Meyers WC. Focal fatty infiltration: a cause of nontumorous defects in the left hepatic lobe during CT arterial portography. J Comput Assist Tomogr. 1993. 17:590–595.56. Grossholz M, Terrier F, Rubbia L, et al. Focal sparing in the fatty liver as a sign of an adjacent space-occupying lesion. AJR. 1998. 171:1391–1395.57. Siegelman ES, Rosen MA. Imaging of hepatic steatosis. Semin Liver Dis. 2001. 21:71–80.58. Kanematsu M, Kondo H, Enya M, Yokoyama R, Hoshi H. Nondiseased portal perfusion defects adjacent to the right ribs shown on helical CT during arterial portography. AJR. 1998. 171:445–448.
- Full Text Links
-
- Actions
-
Cited
- CITED
-
- Close
- Share
-
- Similar articles
-
- Small Arterioportal Shunt: A Pseudolesion Mimicking Hepatocellular Carcinoma in Angiography
- Intrahepatic Arterioportal Shunt:A Mechanism of Hypovascular Hepatocellular Carcinoma
- Spontaneous hepatic arterioportal fistula in extrahepatic portal vein obstruction: Combined endovascular and surgical management
- Hepatic Hemangioma with Arterioportal Shunts
- Embolization of Seve re Arterioportal Shunts in the Patients with Hepatocellular Carcinoma: Safety and Influence on Patient Survival
