Electrophysiological and Histologic Evaluation of the Time Course of Retinal Degeneration in the rd10 Mouse Model of Retinitis Pigmentosa
- Affiliations
-
- 1Department of Physiology, Chungbuk National University School of Medicine, Cheongju 361-763, Korea. ysgoo@chungbuk.ac.kr
- 2Department of Anatomy, Chungbuk National University School of Medicine, Cheongju 361-763, Korea.
- 3Department of Microbiology, Chungbuk National University School of Medicine, Cheongju 361-763, Korea.
- KMID: 1429303
- DOI: http://doi.org/10.4196/kjpp.2013.17.3.229
Abstract
- Among several animal models of retinitis pigmentosa (RP), the more recently developed rd10 mouse with later onset and slower rate of retinal degeneration than rd1 mouse is a more suitable model for testing therapeutic modalities. We therefore investigated the time course of retinal degeneration in rd10 mice before adopting this model in our interventional studies. Electroretinogram (ERG) recordings were carried out in postnatal weeks (PW) 3~5 rd10 (n=23) and wild-type (wt) mice (n=26). We compared the amplitude and implicit time of the b-wave of ERG records from wt and rd10 mice. Our results showed that b-wave amplitudes in rd10 mice were significantly lower and the implicit time of b-waves in rd10 mice were also significantly slower than that in wt mice (20~160 microV vs. 350~480 microV; 55~75 ms vs. 100~150 ms: p<0.001) through PW3 to PW5. The most drastic changes in ERG amplitudes and latencies were observed during PW3 to PW4. In multichannel recording of rd10 retina in PW2 to PW4.5, we found no significant difference in mean spike frequency, but the frequency of power spectral peak of local field potential at PW3 and PW3.5 is significantly different among other age groups (p<0.05). Histologic examination of rd10 retinae showed significant decrease in thickness of the outer nuclear layer at PW3. TUNEL positive cells were most frequently observed at PW3. From these data, we confirm that in the rd10 mouse, the most precipitous retinal degeneration occurs between PW3~PW4 and that photoreceptor degeneration is complete by PW5.
Keyword
MeSH Terms
Figure
-
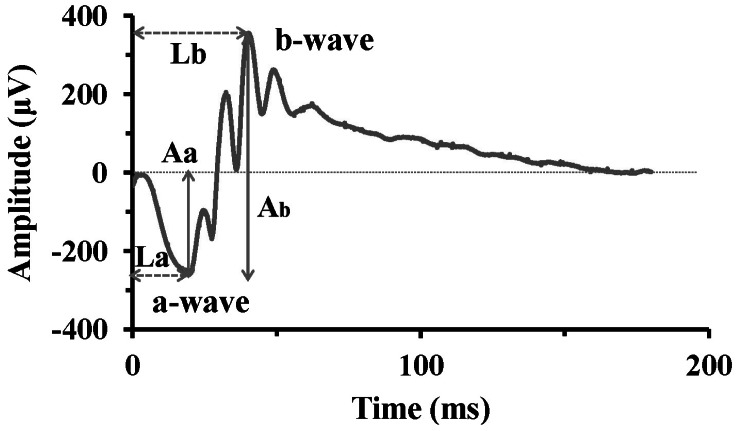
Fig. 1 Typical ERG waveform. The initial negative component, a-wave represents photoreceptor response, while the b-wave, positive peak following the a-wave, represents activities of bipolar cells or Müller cells. The a-wave amplitude (Aa) is measured from the baseline to the a-wave trough, and the b-wave amplitude (Ab) from the a-wave trough to the b-wave peak. The implicit time of a-wave (La) and b-wave (Lb) is measured from the stimulus onset to the a-wave trough and b-wave peak, respectively.
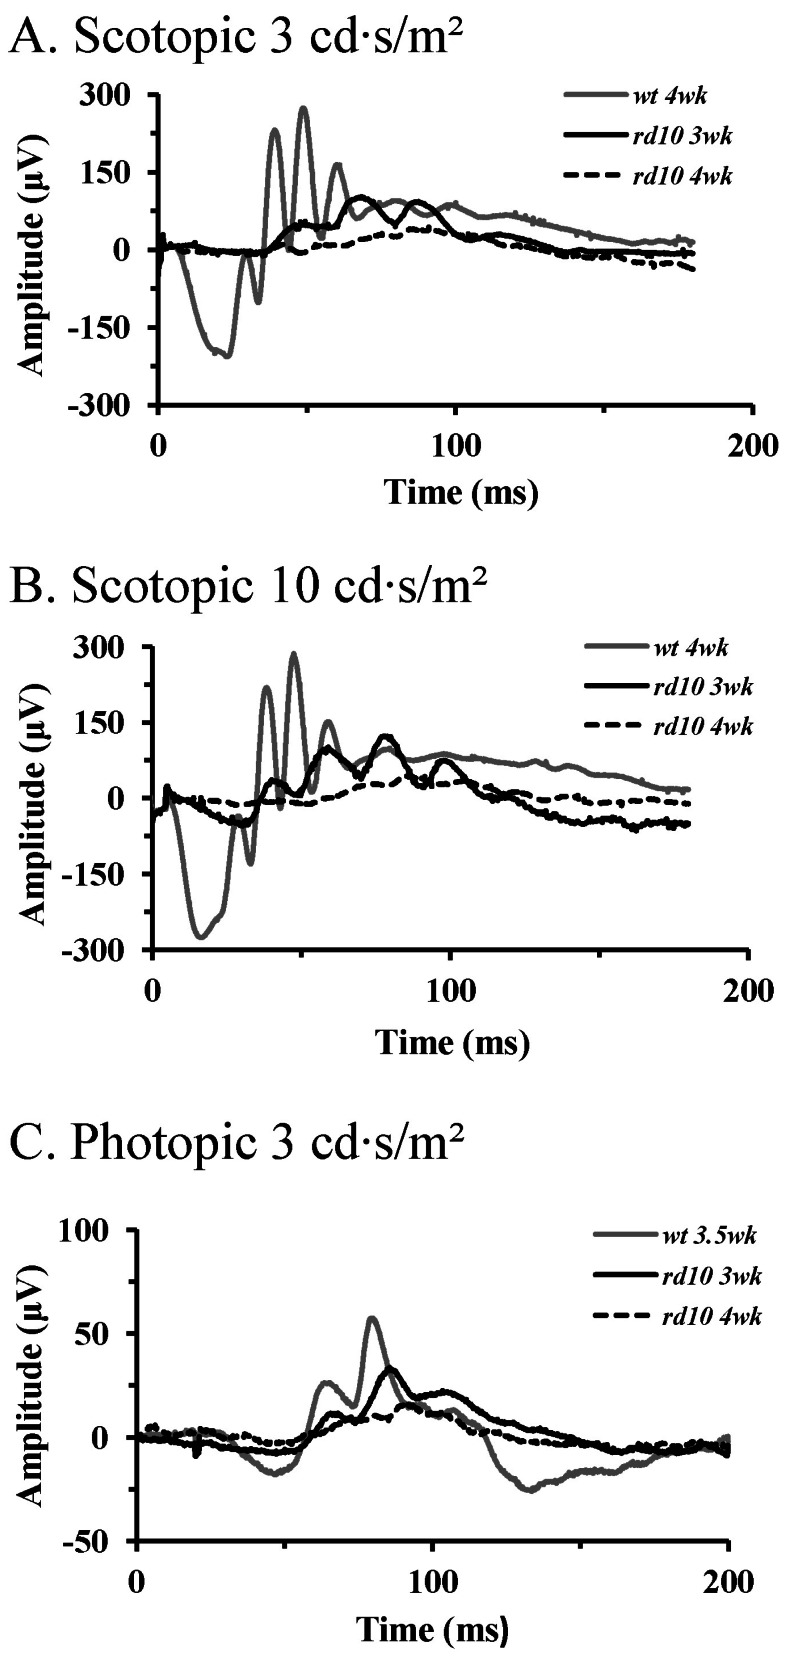
Fig. 2 ERG recordings in wt mice and rd10 mice. (A) Light stimulus condition of scotopic 3 cd·s/m2. (B) Light stimulus condition of scotopic 10 cd·s/m2. (C) Light stimulus condition of photopic 3 cd·s/m2. Dark-adapted responses were recorded after 1 hour of darkad-aptation. Note the increase in amplitudes of the a- and b-wave with increasing light intensities. At the same light intensities, response of the rd10 mice are delayed and reduced in amplitude compared with those of the wt mice. Unlike in wt mice, a-wave in rd10 mice was hardly detectable in postnatal 4 weeks.
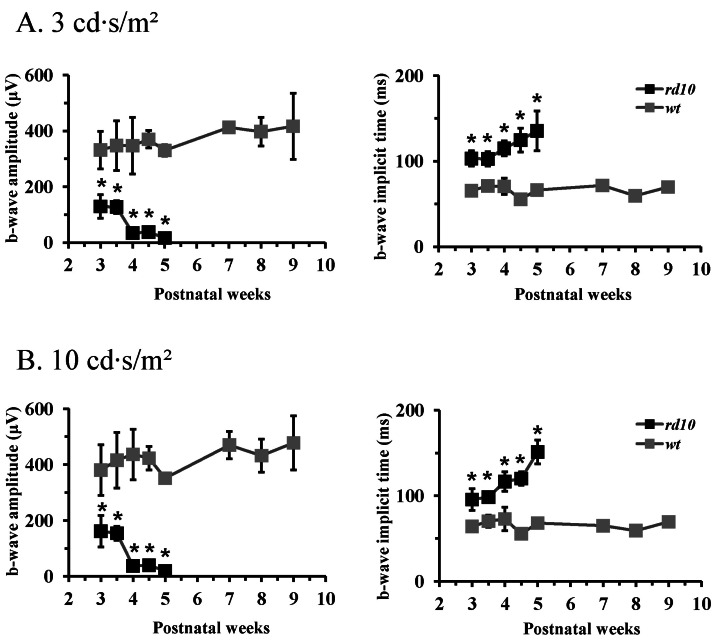
Fig. 3 ERG b-wave of age-matched wt mice and rd10 mice. (A) Light stimulus condition of scotopic 3 cd·s/m2. (B) Light stimulus condition of scotopic 10 cd·s/m2. The b-wave amplitude of rd10 mice is significantly smaller and the implicit time of b-wave is significantly longer than that of wt mice throughout all the postnatal ages. Each point represents the mean±standard deviation (S.D.) (*p<0.001).
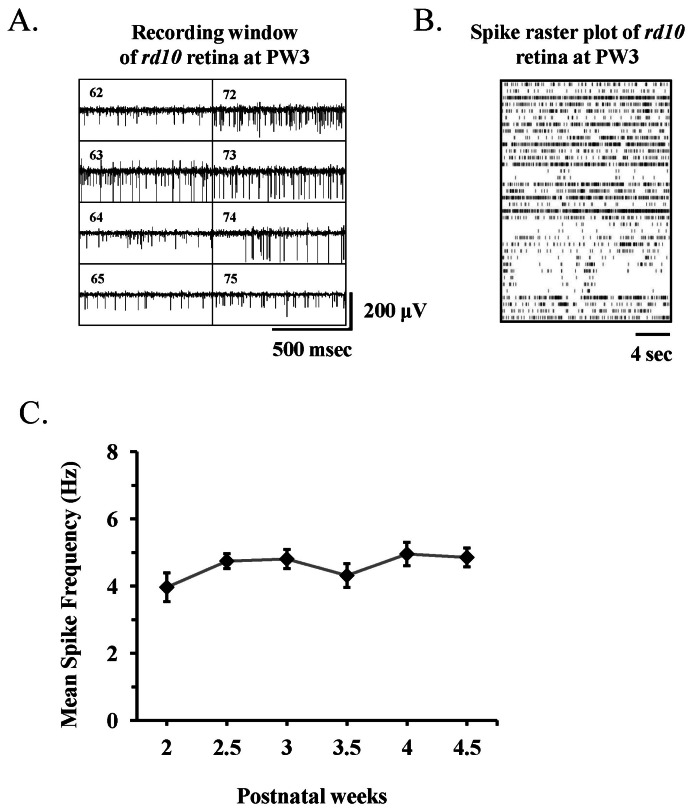
Fig. 4 Spontaneous retinal activity in rd10 mouse recorded with multichannel recording system. (A) Part of real time recording window of data acquisition software (MC_Rack) shows 8 channels of 8×8 multielectrode array. The channel number is shown inside of each channel (e.g., channel 62 means the channel of 6th column and 2nd row). Rd10 mouse at postnatal 3 week (PW3) were used. (B) Raster plots of 36 retinal ganglion cell (RGC) spikes (One RGC spike train per each row of plot) recorded from single rd10 retina at PW3. (C) Mean±standard error of the mean (SEM) firing rate of all cells recorded across different postnatal weeks. There is no statistically significant difference among different postnatal weeks (p>0.05).
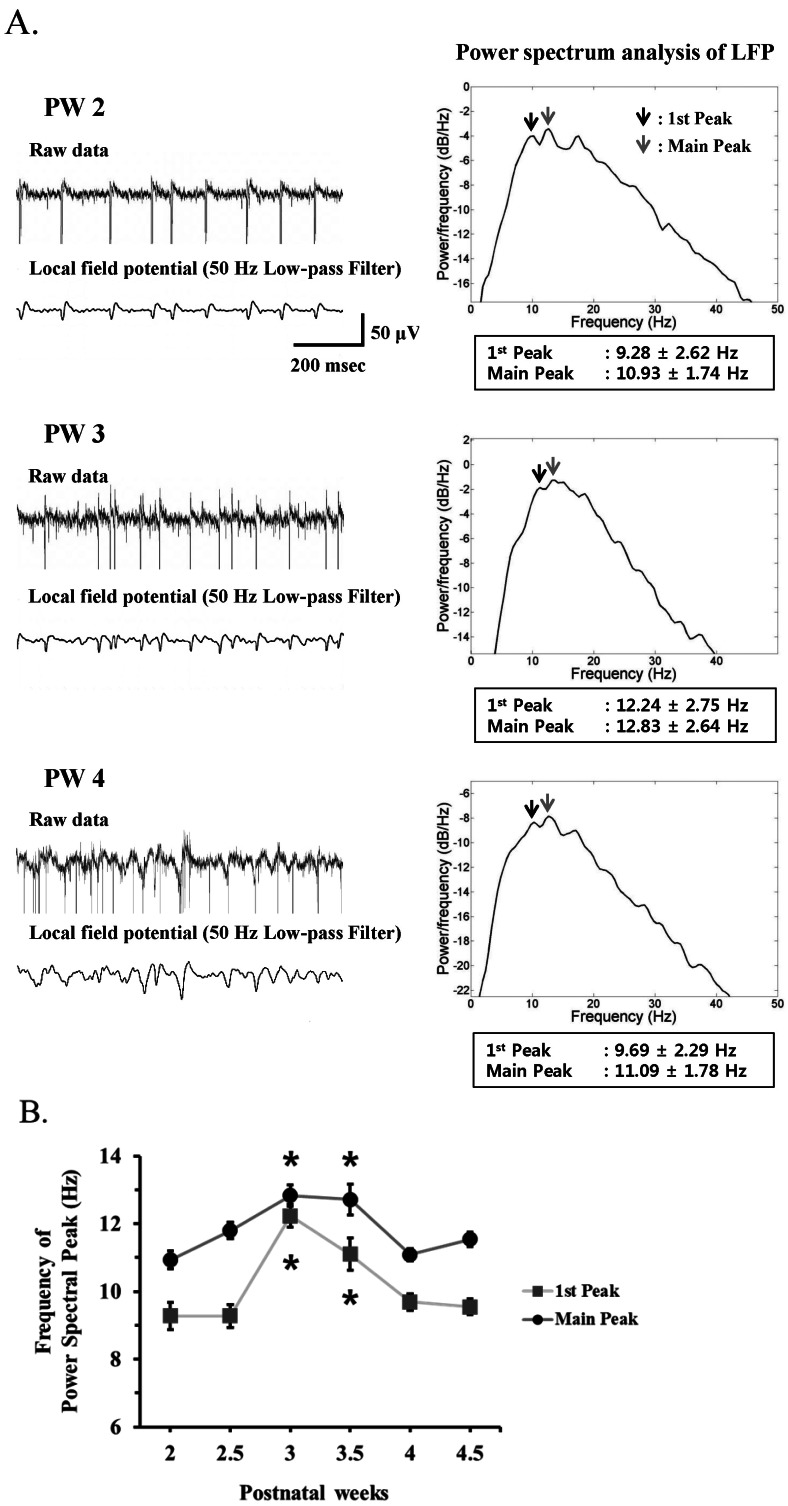
Fig. 5 (A) Left panel. Upper trace: A typical raw waveform of neural activity recorded from postnatal week 2 (PW2), PW3, and PW4 rd10 retina. Lower trace: Local field potential (LFP) waveform obtained from low-pass filtering with 50 Hz cutoff frequency. Right panel: Power spectrum analysis of LFP estimated by the Burg algorithm was shown. Arrows indicate the 1st and main spectral peak. (B) Frequency of power spectral peak of LFP across different postnatal weeks. The 1st and main peak of LFP at PW3 and PW3.5 are significantly different with other age groups (*p<0.05, ANOVA and posthoc Tukey criteria). At each postnatal week, 3 rd10 mice were used. The number of MEA channels for analysis was 44, 87, 68, 50, 95, and 86 at PW2, PW2.5, PW3, PW3.5, PW4, and PW4.5, respectively. Error bars are ±SEM.
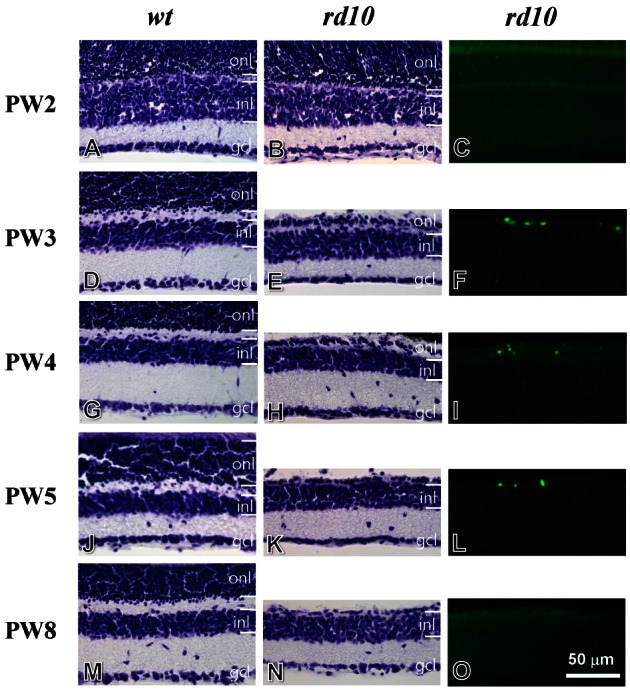
Fig. 6 Cresyl violet staining and TUNEL staining for developing retinae of wt mice (left panel), rd10 mice (middle and right panels). (A~C) Postnatal week 2 (PW2). The retina of the rd10 mice has intact layers, identical to that of the wt mice (A, B). Few TUNEL-stained cells are observed in the rd10 retina (C). (D~F) PW3. Compared to the wt retina (D), the thickness of outer nuclear layer (ONL) is significantly reduced in the rd10 retina (E). A number of TUNEL-stained cells are seen in the ONL of the rd10 retina (F). (G~I) PW4. The morphology of the rd10 retina is similar to that of the PW3 rd10 retina (G~I). (J~L) PW5. Compared to the wt retina (J), one or two row(s) of cells remain(s) in the ONL of the rd10 retina (K). A few TUNEL-stained cells are seen in the ONL of the rd10 retina (L). (M~O) PW8. The morphology of the rd10 retina is similar to the PW5 rd10 retina (M, N). However, TUNEL-stained cells were not detected in the rd10 retina (O). ONL, outer nuclear layer; INL, inner nuclear layer; GCL, ganglion cell layer. Scale bar=50 µm.
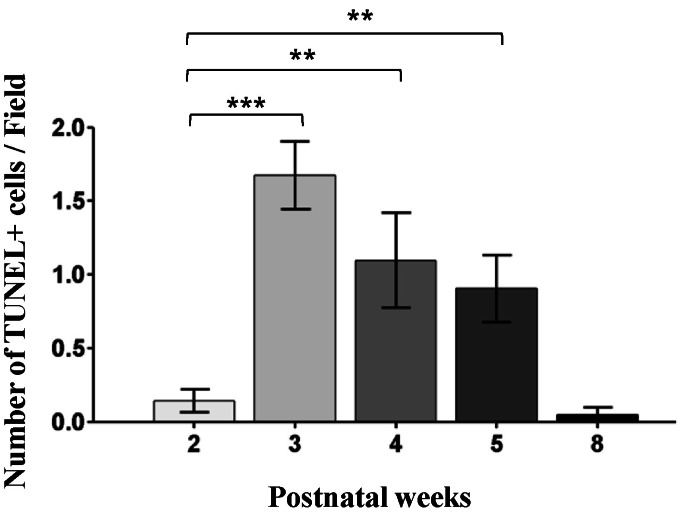
Fig. 7 The number of the TUNEL-stained cells in the developing retinae of the rd10 mice. In comparison to the PW2 rd10 retina, the number of TUNEL-stained cells is significantly increased in the PW3 to PW5 rd10 retinae (***p<0.001, **p<0.01). However, the number of TUNEL-stained cells is reduced in the PW8 rd10 retina. Note that TUNEL-stained cells are most frequently observed in the PW3 rd10 retina.
Reference
-
2. Pagon RA, Daiger SP. Retinitis pigmentosa Overview. GeneReviews. Seattle: University of Washington;2000.3. Chang B, Hawes NL, Hurd RE, Davisson MT, Nusinowitz S, Heckenlively JR. Retinal degeneration mutants in the mouse. Vision Res. 2002; 42:517–525. PMID: 11853768.
Article4. Chang B, Hawes NL, Pardue MT, German AM, Hurd RE, Davisson MT, Nusinowitz S, Rengarajan K, Boyd AP, Sidney SS, Phillips MJ, Stewart RE, Chaudhury R, Nickerson JM, Heckenlively JR, Boatright JH. Two mouse retinal degenerations caused by missense mutations in the beta-subunit of rod cGMP phosphodiesterase gene. Vision Res. 2007; 47:624–633. PMID: 17267005.5. Baehr W, Frederick JM. Naturally occurring animal models with outer retina phenotypes. Vision Res. 2009; 49:2636–2652. PMID: 19375447.
Article6. Goo YS, Ye JH, Lee S, Nam Y, Ryu SB, Kim KH. Retinal ganglion cell responses to voltage and current stimulation in wild-type and rd1 mouse retinas. J Neural Eng. 2011; 8:035003. PMID: 21593549.7. Ryu SB, Ye JH, Goo YS, Kim CH, Kim KH. Decoding of temporal visual information from electrically evoked retinal ganglion cell activities in photoreceptor-degenerated retinas. Invest Ophthalmol Vis Sci. 2011; 52:6271–6278. PMID: 21680865.
Article8. Ryu SB, Ye JH, Goo YS, Kim CH, Kim KH. Temporal response properties of retinal ganglion cells in rd1 mice evoked by amplitude-modulated electrical pulse trains. Invest Ophthalmol Vis Sci. 2010; 51:6762–6769. PMID: 20671284.9. Slatter DH. Fundamentals of veterinary ophthalmology. 3rd ed. Philadelphia: Saunders;2001. p. 419–456.10. Armington JC, Bloom MB. Relations between the amplitudes of spontaneous saccades and visual responses. J Opt Soc Am. 1974; 64:1263–1271. PMID: 4424715.
Article11. Penn RD, Hagins WA. Signal transmission along retinal rods and the origin of the electroretinographic a-wave. Nature. 1969; 223:201–204. PMID: 4307228.
Article12. Miller RF, Dowling JE. Intracellular responses of the Müller (glial) cells of mudpuppy retina: their relation to b-wave of the electroretinogram. J Neurophysiol. 1970; 33:323–341. PMID: 5439340.
Article13. Stockton RA, Slaughter MM. B-wave of the electroretinogram. A reflection of ON bipolar cell activity. J Gen Physiol. 1989; 93:101–122. PMID: 2915211.
Article14. Xu X, Karwoski CJ. Current source density analysis of retinal field potentials. II. Pharmacological analysis of the b-wave and M-wave. J Neurophysiol. 1994; 72:96–105. PMID: 7965036.
Article15. Shiells RA, Falk G. Contribution of rod, on-bipolar, and horizontal cell light responses to the ERG of dogfish retina. Vis Neurosci. 1999; 16:503–511. PMID: 10349971.
Article16. Robson JG, Frishman LJ. Response linearity and kinetics of the cat retina: the bipolar cell component of the dark-adapted electroretinogram. Vis Neurosci. 1995; 12:837–850. PMID: 8924408.
Article17. Pugh EN Jr, Falsini B, Lyurbarsky A. The origin of the major rod- and cone-driven components of the rodent electroretinogram and the effects of age and light-rearing history on the magnitude of these components. Photostasis and Related Phenomena. New York: Plenum Press;1998. p. 128.18. Stett A, Barth W, Haemmerle H, Weiss S, Zrenner E. Electrical multisite stimulation of the isolated chicken retina. Vision Res. 2000; 40:1785–1795. PMID: 10814763.
Article19. Hayes MH. Statistical digital signal processing and modeling. New York: John Wiley & Sons;1996.20. LaVail MM, Matthes MT, Yasumura D, Steinberg RH. Variability in rate of cone degeneration in the retinal degeneration (rd/rd) mouse. Exp Eye Res. 1997; 65:45–50. PMID: 9237863.21. Strettoi E, Porciatti V, Falsini B, Pignatelli V, Rossi C. Morphological and functional abnormalities in the inner retina of the rd/rd mouse. J Neurosci. 2002; 22:5492–5504. PMID: 12097501.
Article22. Strettoi E, Pignatelli V, Rossi C, Porciatti V, Falsini B. Remodeling of second-order neurons in the retina of rd/rd mutant mice. Vision Res. 2003; 43:867–877. PMID: 12668056.
Article23. Lin B, Masland RH, Strettoi E. Remodeling of cone photoreceptor cells after rod degeneration in rd mice. Exp Eye Res. 2009; 88:589–599. PMID: 19087876.
Article24. Chen M, Wang K, Lin B. Development and degeneration of cone bipolar cells are independent of cone photoreceptors in a mouse model of retinitis pigmentosa. PLoS One. 2012; 7:e44036. PMID: 22952865.
Article25. Gargini C, Terzibasi E, Mazzoni F, Strettoi E. Retinal organization in the retinal degeneration 10 (rd10) mutant mouse: a morphological and ERG study. J Comp Neurol. 2007; 500:222–238. PMID: 17111372.
Article26. Lyubarsky AL, Daniele LL, Pugh EN Jr. From candelas to photoisomerizations in the mouse eye by rhodopsin bleaching in situ and the light-rearing dependence of the major components of the mouse ERG. Vision Res. 2004; 44:3235–3251. PMID: 15535992.
Article27. Barhoum R, Martínez-Navarrete G, Corrochano S, Germain F, Fernandez-Sanchez L, de la Rosa EJ, de la Villa P, Cuenca N. Functional and structural modifications during retinal degeneration in the rd10 mouse. Neuroscience. 2008; 155:698–713. PMID: 18639614.
Article28. Ye JH, Goo YS. The slow wave component of retinal activity in rd/rd mice recorded with a multi-electrode array. Physiol Meas. 2007; 28:1079–1088. PMID: 17827655.
- Full Text Links
-
- Actions
-
Cited
- CITED
-
- Close
- Share
-
- Similar articles
-
- Strategies for Mutation Discovery in Retinitis Pigmentosa: Transition to the Next Generation
- A Case of Unilateral Retinitis Pigmentosa
- Advancements in Retinal Prosthesis Systems: A Review of the Literature
- Electrophysiologic Finding of Retinitis Pigmentosa Inversus and Differential Diagnosis from Peripapillary Choroidal Dystrophy
- A Case of Pigmented Paravenous Retino-Choroidal Atrophy and Retinitis Pigmentosa
