The Influence of Contrasts on Directional and Spatial Frequency Tuning in Visual Cortex Areas 17/18 of the Cat
- Affiliations
-
- 1Lab of Veterinary Neuroscience and Research Institute for Veterinary Science, College of Veterinary Medicine, Seoul National University, Seoul, Korea. kimjn@snu.ac.kr
- KMID: 994412
- DOI: http://doi.org/10.3341/kjo.2011.25.1.48
Abstract
- PURPOSE
The purpose of this study was to investigate the effects of contrast display exposure on neuronal directional and spatial frequency tuning. Neuronal responses were recorded from ninety-four neurons in cortical areas 17 and 18 in two adult cats.
METHODS
A multi-channel microelectrode was implanted in cortical areas 17 and 18 of two paralyzed and anaesthetized cats. Various drifting sinusoidal grating contrast displays were presented to one of the cats' eyes in the visual field. Contour plots based on the neuronal responses to the drifting sinusoidal grating displays using various contrasts (i.e., 0.4, 0.7, and 1.0) and velocities (i.e., 4.6, 13.9, 23.1, 32.3, 41.5, 50.8, and 60.0 deg/sec) were plotted as a function of the spatial frequency and the direction associated with each velocity and contrast used.
RESULTS
Five parameters were extracted from these contour plots: 1) optimum response, 2) preferred direction, 3) optimum spatial frequency, 4) directional tuning width, and 5) spatial frequency bandwidth. To determine the optimal velocity, each parameter was plotted against each of the specific display contrasts used, and a 'best fit' line was established. Response amplitudes were dependent on the type of contrast utilized; however, the spatial frequency and directional tuning properties were stable for the cortical neurons assessed.
CONCLUSIONS
The results of the presentation of different contrasts on neuronal directional and spatial frequency tuning are consistent with behavioral results when medium and high contrast displays are used.
Keyword
MeSH Terms
Figure
-
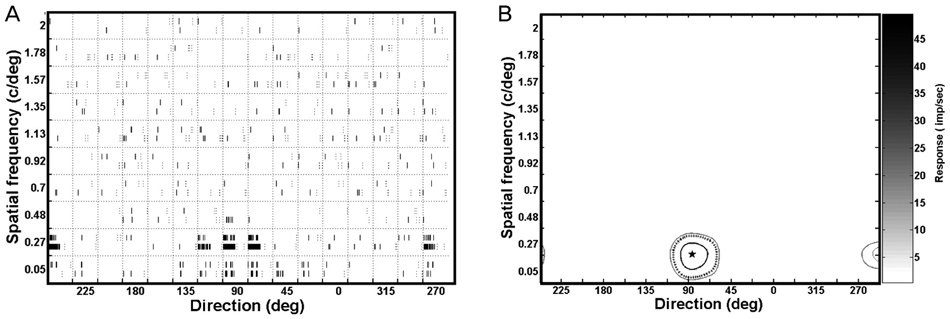
Fig. 1 Quantification of directional / spatial frequency tuning plots (cell no. 0706-c97-u1-v2). The stimuli were sinusoidal gratings using 10 spatial frequencies (the y-axis) in 16 directions (22.5 deg interval, the x-axis) using a specific velocity (50.2 deg/sec) and contrast (100%). The resting discharge was collected during one second, prior to the presentation of the drifting sinusoidal gratings at each orientation. The horizontal axis ranged from 0 to 337.5 and represented 'direction', while the vertical axis ranged from 0.05 to 2.0 cycle/deg and represented 'spatial frequency'. (A) Raster plots of responses of an individual neuron in a joint directional and spatial frequency domain to drifting sinusoidal grating stimuli. Raster plots revealed responses to 160 different stimuli (combinations of 10 spatial frequencies and 16 directions). The horizontal axis represents 2 seconds (stimulation for 1 second and resting discharge for 1 second), while the vertical axis represents two trials. The response strength was calculated during one second. Mean firing rates (n=2) were averaged for each stimulus (i.e., 10 × 16 array). After adding the 17th array with the first array, the 10 × 17 array was processed further using the interp2 (cubic) function to produce a 201 × 341 array. A tuning contour plot showing the joint directional and spatial frequency domain is shown in (B). (B) The contour plot in a joint direction and spatial frequency domain. The contour plot at the 50% of maximum response (star), at the optimal direction (along the x-axis), and at the optimal spatial frequency (along the y-axis) are indicated by asterisks. Five values were calculated (optimal response, 51 impulses/sec; optimal direction, 94.6 deg; tuning width, 42.3 deg; optimal spatial frequency, 0.26 c/deg; bandwidth, 0.29 c/deg) based on the contour plot after measuring the horizontal distance (i.e., tuning width) and vertical distance (i.e., bandwidth) of the boundary.
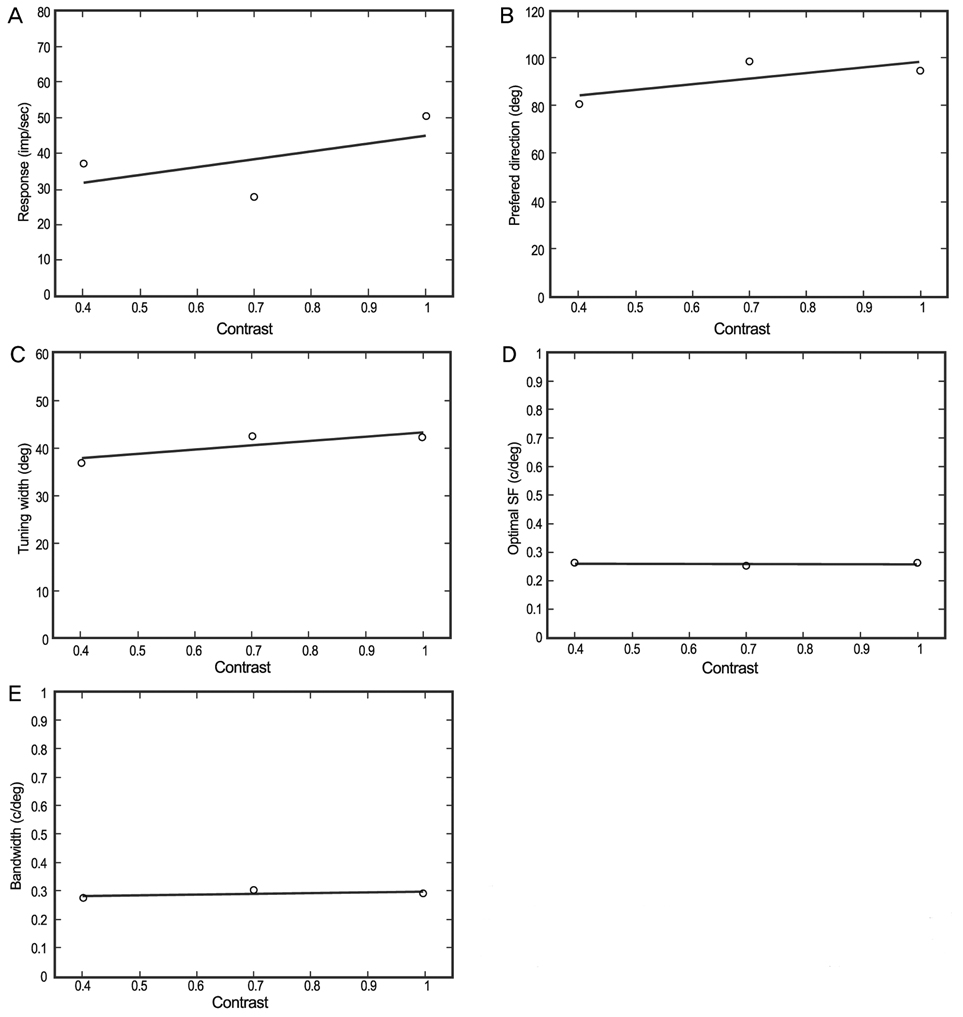
Fig. 2 Changes in five different parameters (A-E) at three contrast levels (0.4, 0.7, and 1.0). (A) Responses for the gratings. The slope of linear regression was fitted to the optimal responses as functions of the various contrasts. (B) Optimal directions. (C) Tuning widths. (D) Optimal spatial frequencies (SF). (E) Band widths.
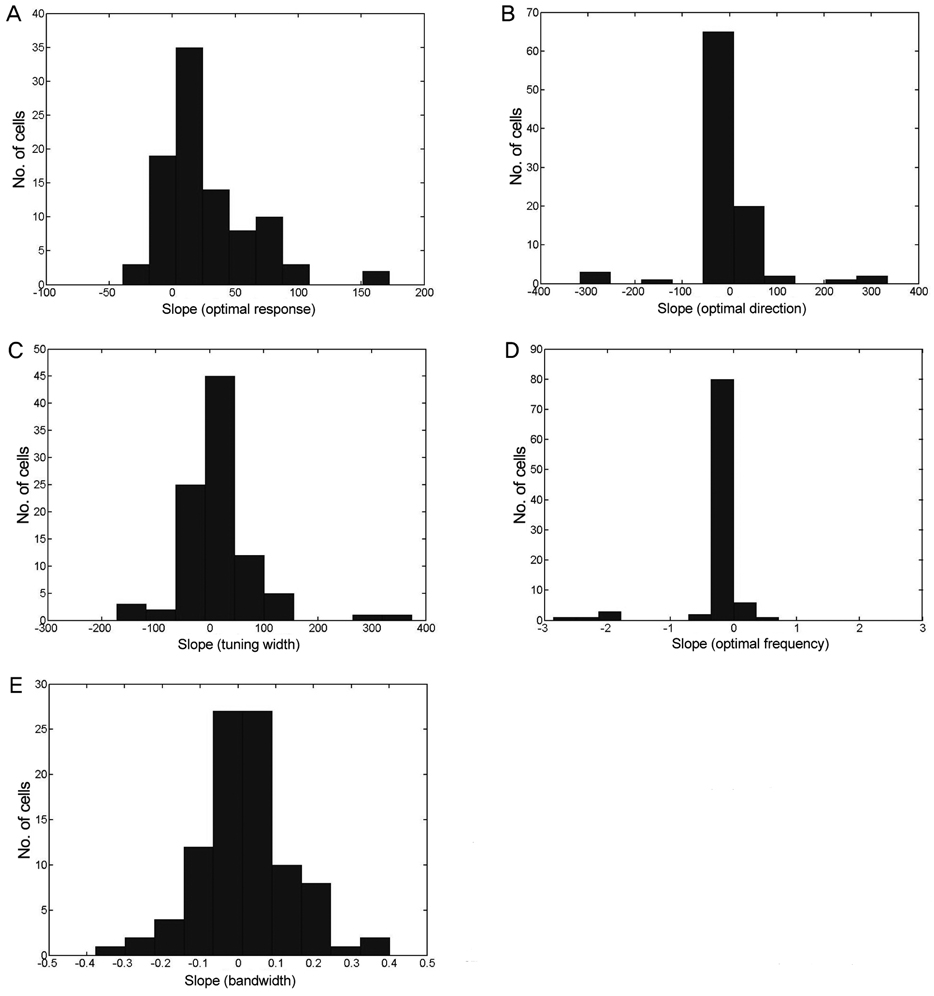
Fig. 3 Distribution of slopes (n = 94) for the five parameters (A-E) in response to changes in the contrast. Most of these slopes (except the response strength, (A) are close to zero, indicating that these functions remained relatively constant as the contrast varied. (A) shows the distribution for the changes in the optimal responses at the optimal direction and optimal spatial frequency (mean, 27.86; SD, 36.69). (B) Shows the distribution of changes in the optimal direction (mean, -0.21; SD, 79.72). (C) Shows the distribution of the changes in the directional tuning width (mean, 14.18; SD, 72.55). (D) shows the distribution of the changes in the optimal spatial frequency (mean, -0.13; SD, 0.50). (E) Shows the distribution of the changes in the spatial frequency (mean, 0.02; SD, 0.13).
Reference
-
1. Tolhurst DJ, Movshon JA. Spatial and temporal contrast sensitivity of striate cortical neurones. Nature. 1975. 257:674–675.2. Albrecht DG, Hamilton DB. Striate cortex of monkey and cat: contrast response function. J Neurophysiol. 1982. 48:217–237.3. Hubel DH, Wiesel TN. Receptive fields, binocular interaction and functional architecture in the cat's visual cortex. J Physiol. 1962. 160:106–154.4. Campbell FW, Cleland BG, Cooper GF, Enroth-Cugell C. The angular selectivity of visual cortical cells to moving gratings. J Physiol. 1968. 198:237–250.5. Campbell FW, Cooper GF, Enroth-Cugell C. The spatial selectivity of the visual cells of the cat. J Physiol. 1969. 203:223–235.6. Maffei L, Fiorentini A. The visual cortex as a spatial frequency analyser. Vision Res. 1973. 13:1255–1267.7. Schiller PH, Finlay BL, Volman SF. Quantitative studies of single-cell properties in monkey striate cortex. III. Spatial frequency. J Neurophysiol. 1976. 39:1334–1351.8. Movshon JA, Thompson ID, Tolhurst DJ. Spatial and temporal contrast sensitivity of neurones in areas 17 and 18 of the cat's visual cortex. J Physiol. 1978. 283:101–120.9. De Valois RL, Albrecht DG, Thorell LG. Spatial frequency selectivity of cells in macaque visual cortex. Vision Res. 1982. 22:545–559.10. Sclar G, Freeman RD. Orientation selectivity in the cat's striate cortex is invariant with stimulus contrast. Exp Brain Res. 1982. 46:457–461.11. Skottun BC, Bradley A, Ramoa AS. Effect of contrast on spatial frequency tuning of neurones in area 17 of cat's visual cortex. Exp Brain Res. 1986. 63:431–435.12. Skottun BC, Bradley A, Sclar G, et al. The effects of contrast on visual orientation and spatial frequency discrimination: a comparison of single cells and behavior. J Neurophysiol. 1987. 57:773–786.13. Anderson JS, Lampl I, Gillespie DC, Ferster D. The contribution of noise to contrast invariance of orientation tuning in cat visual cortex. Science. 2000. 290:1968–1972.14. Alitto HJ, Usrey WM. Influence of contrast on orientation and temporal frequency tuning in ferret primary visual cortex. J Neurophysiol. 2004. 91:2797–2808.15. Sceniak MP, Hawken MJ, Shapley R. Contrast-dependent changes in spatial frequency tuning of macaque V1 neurons: effects of a changing receptive field size. J Neurophysiol. 2002. 88:1363–1373.16. Jones JP, Stepnoski A, Palmer LA. The two-dimensional spectral structure of simple receptive fields in cat striate cortex. J Neurophysiol. 1987. 58:1212–1232.17. Hammond P, Pomfrett CJ. Influence of spatial frequency on tuning and bias for orientation and direction in the cat's striate cortex. Vision Res. 1990. 30:359–369.18. Park YH, Kim JN. Spatial frequency and velocity tunings of neurons in areas 17 and 18 of the cat using a 100 microelectrode array. Korean J Lab Anim Sci. 2004. 20:26–30.19. Rousche PJ, Normann RA. A method for pneumatically inserting an array of penetrating electrodes into cortical tissue. Ann Biomed Eng. 1992. 20:413–422.20. Tusa RJ, Palmer LA, Rosenquist AC. The retinotopic organization of area 17 (striate cortex) in the cat. J Comp Neurol. 1978. 177:213–235.21. Gilbert CD. Laminar differences in receptive field properties of cells in cat primary visual cortex. J Physiol. 1977. 268:391–421.22. Hammond P, Ahmed B. Length summation of complex cells in cat striate cortex: a reappraisal of the "special/standard" classification. Neuroscience. 1985. 15:639–649.23. Henry GH, Bishop PO, Tupper RM, Dreher B. Orientation specificity and response variability of cells in the striate cortex. Vision Res. 1973. 13:1771–1779.24. Dean AF. The relationship between response amplitude and contrast for cat striate cortical neurones. J Physiol. 1981. 318:413–427.25. Peterson MR, Li B, Freeman RD. Direction selectivity of neurons in the striate cortex increases as stimulus contrast is decreased. J Neurophysiol. 2006. 95:2705–2712.
- Full Text Links
-
- Actions
-
Cited
- CITED
-
- Close
- Share
-
- Similar articles
-
- Temporal Changes of Direction and Spatial Frequency Tuning in Visual Cortex Areas 17 and 18
- Distribution of NPY-immunoreactive neurons in the visual cortex of the cat
- Comparative Study between Ultrahigh Spatial Frequency Algorithm and High Spatial Frequency Algorithm in High-Resolution CT of the Lungs
- Comparison of Activation in the Primary Visual Cortex between Anisometropic and Strabismic Amblyopias using Functional MRI
- Image characteristics of cone beam computed tomography using a CT performance phantom
