Lab Anim Res.
2010 Mar;26(1):83-90. 10.5625/lar.2010.26.1.83.
Temporal Changes of Direction and Spatial Frequency Tuning in Visual Cortex Areas 17 and 18
- Affiliations
-
- 1Laboratory of Veterinary Neuroscience and Research Institute for Veterinary Science, College of Veterinary Medicine, Seoul National University, Seoul, Korea. kimjn@snu.ac.kr
- KMID: 1458944
- DOI: http://doi.org/10.5625/lar.2010.26.1.83
Abstract
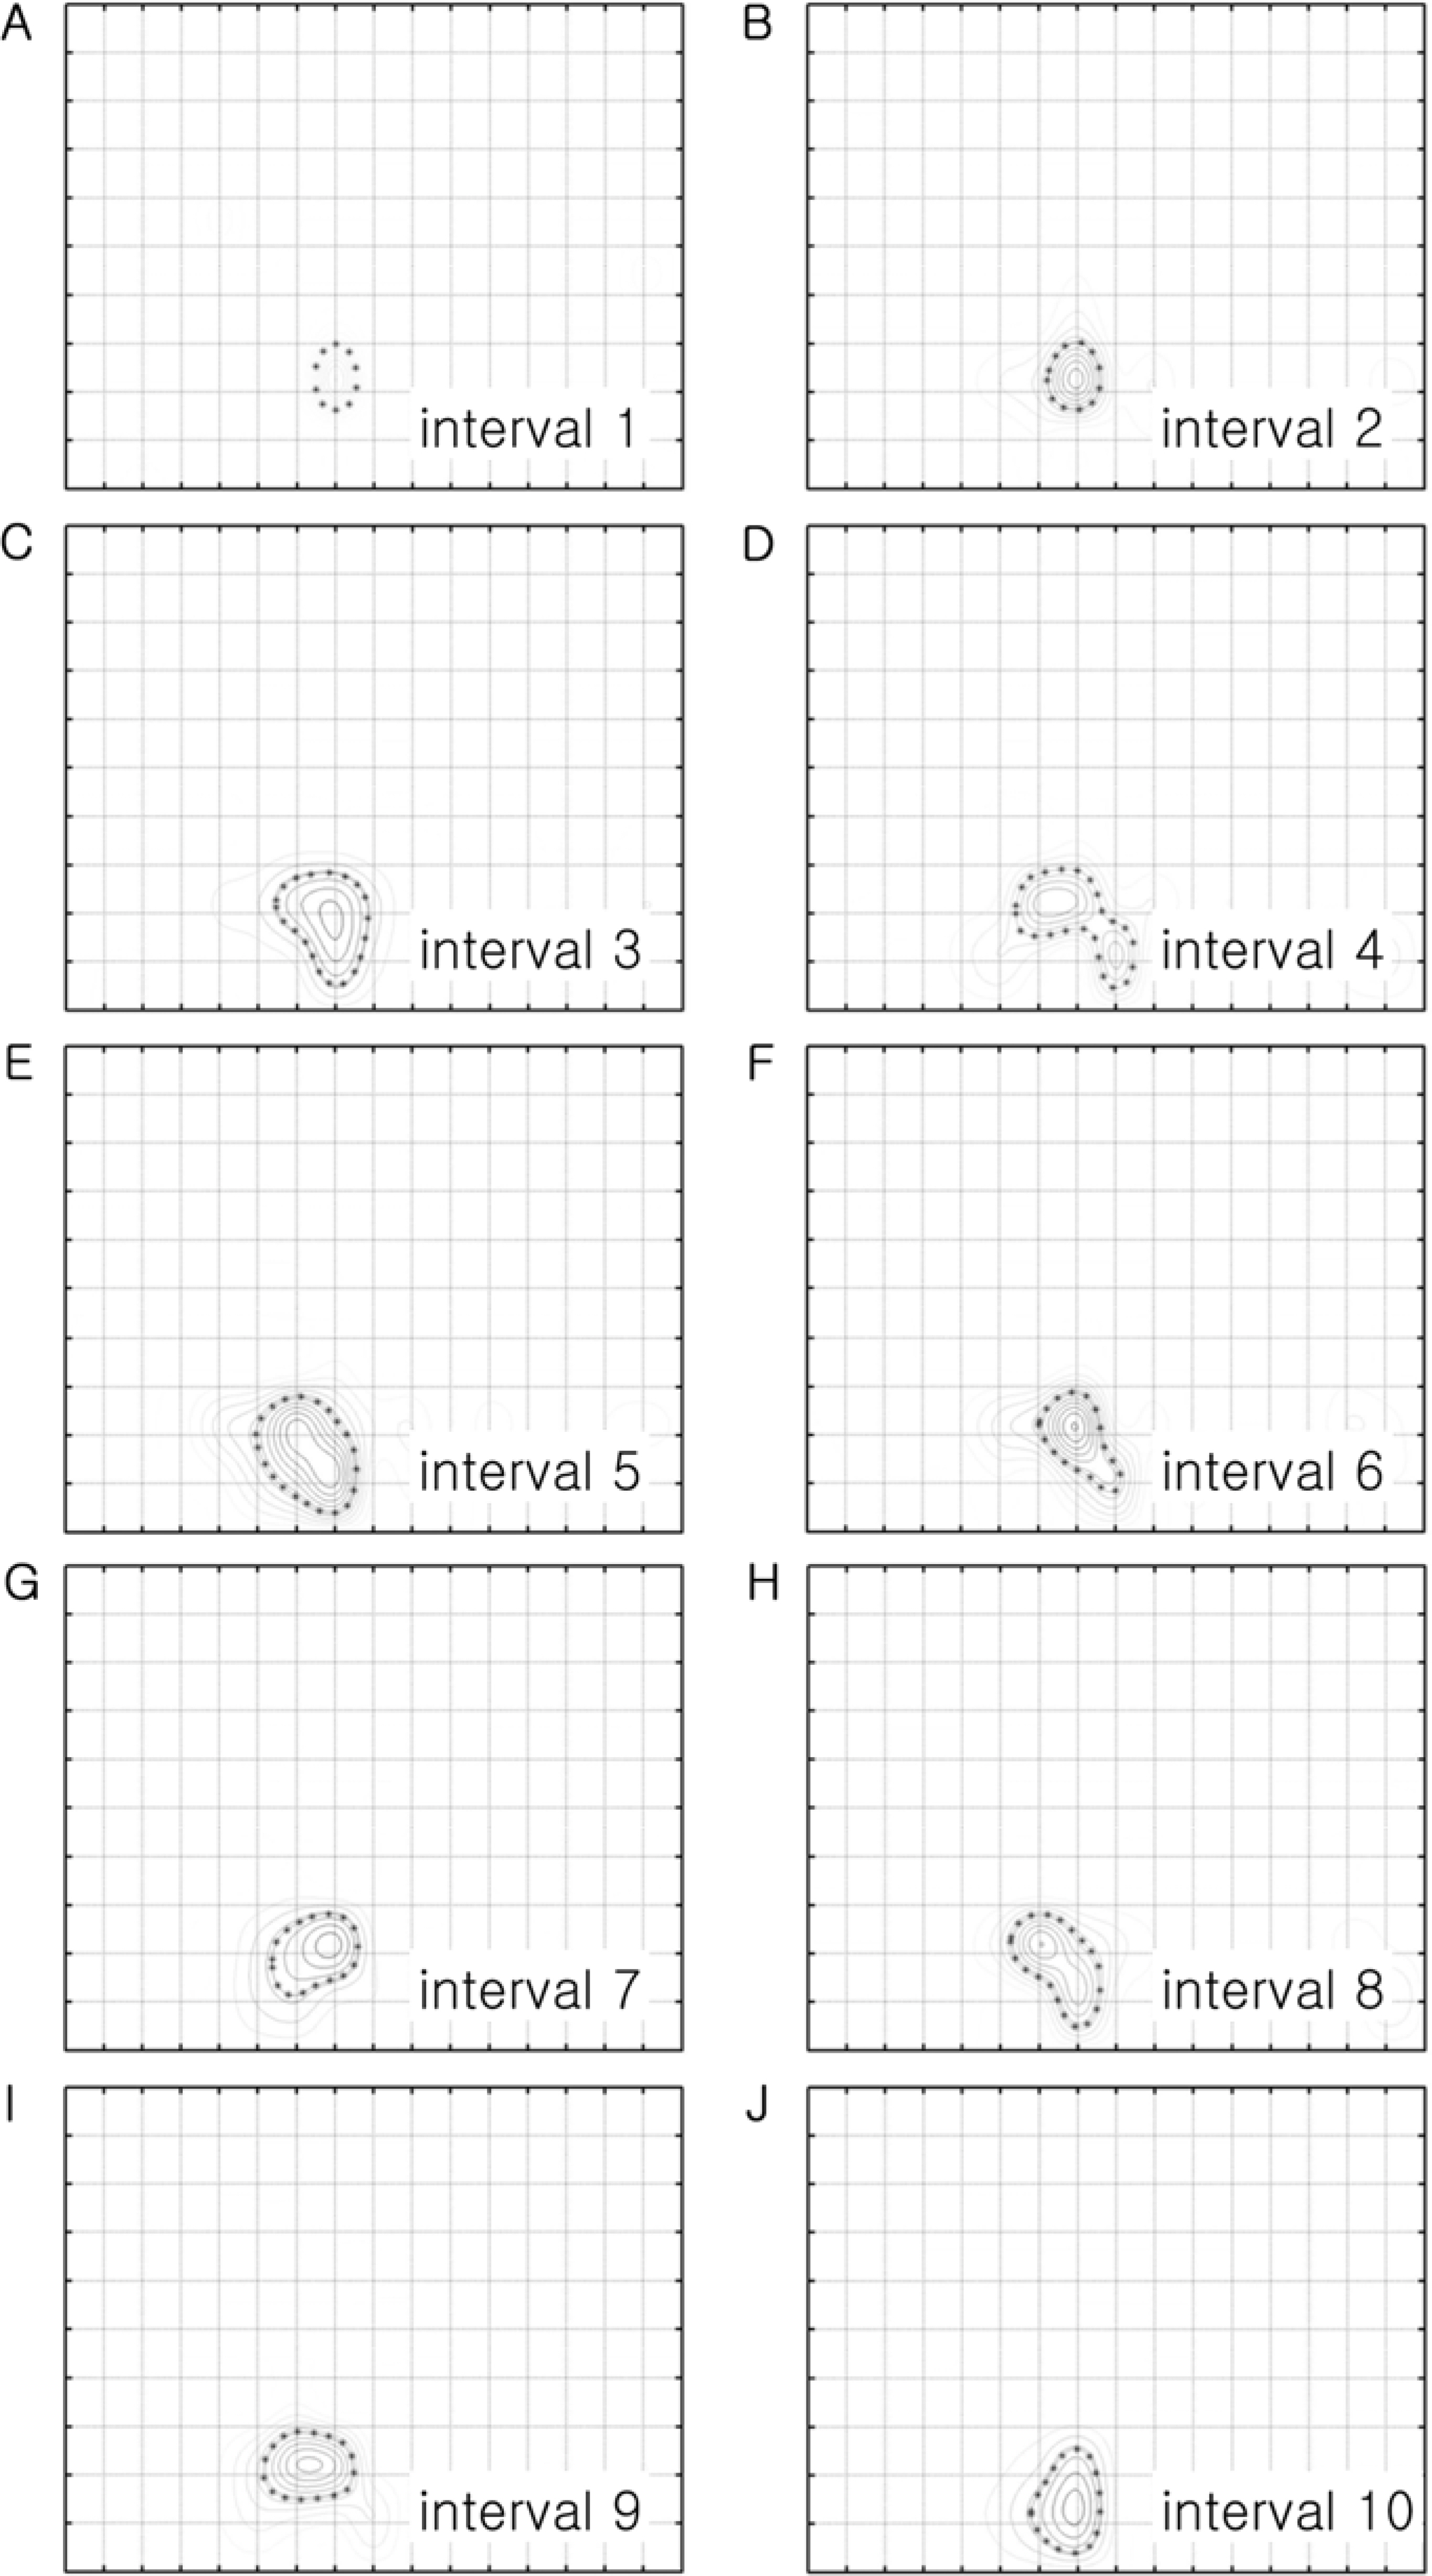
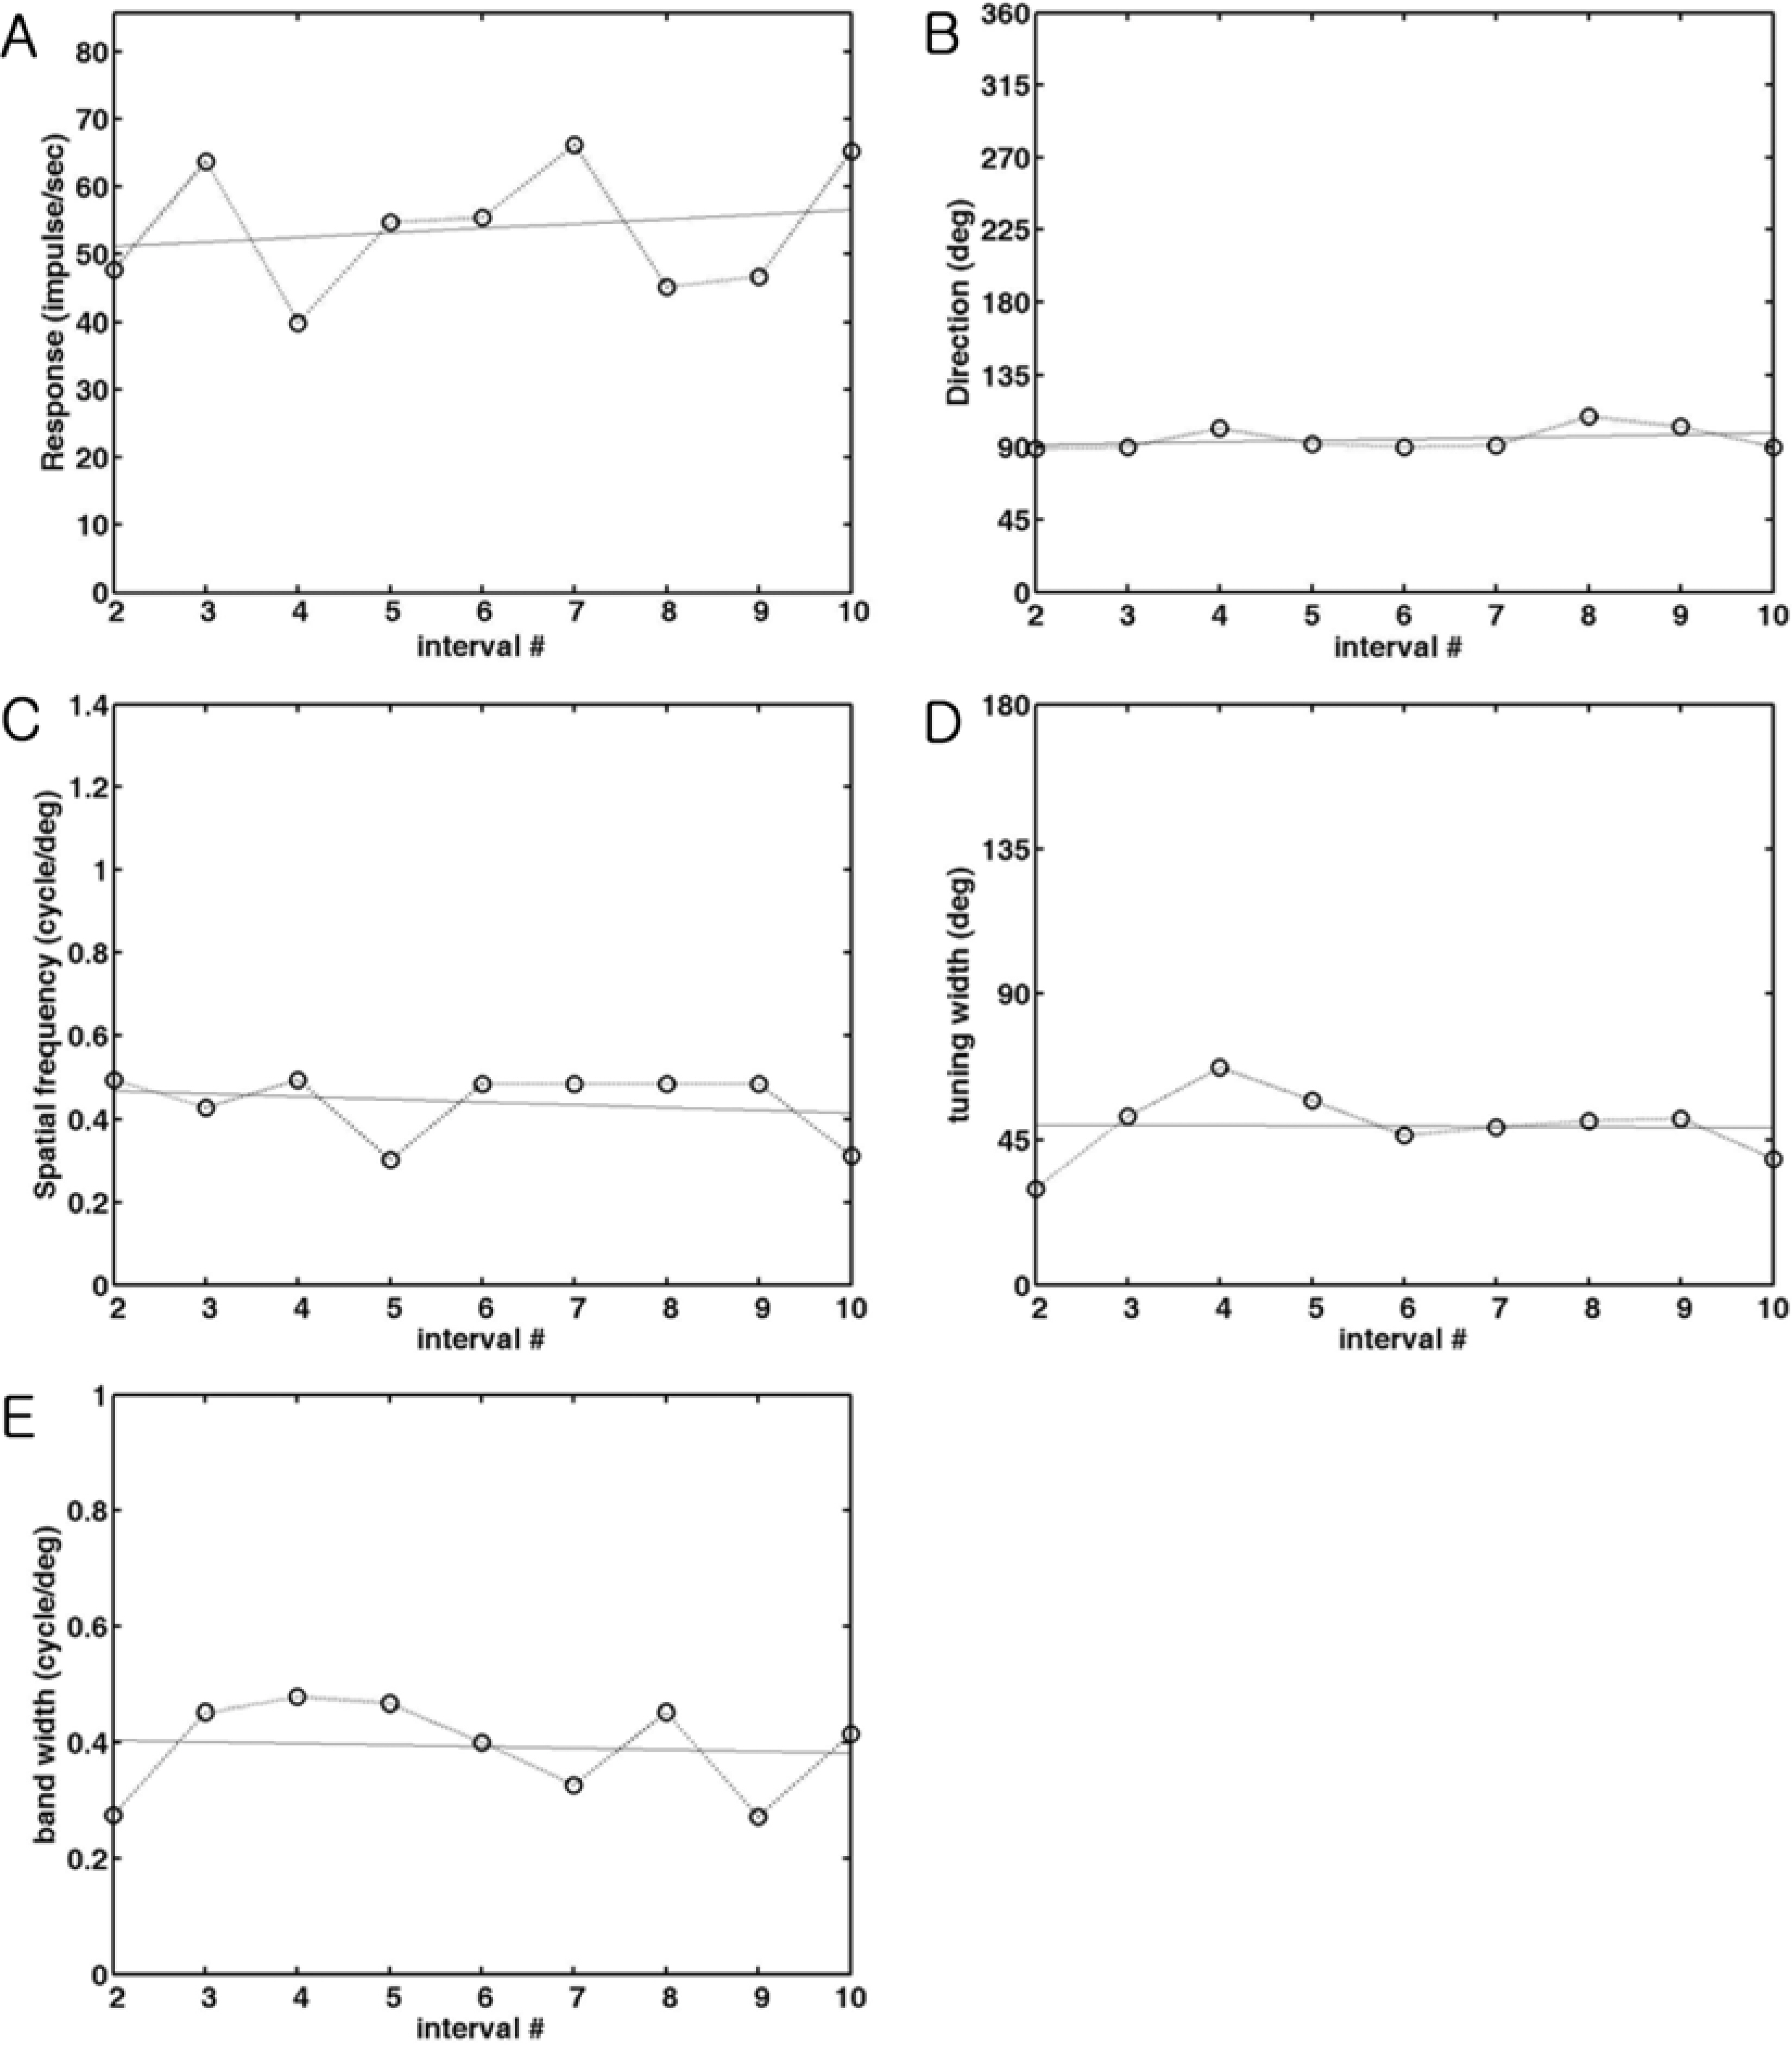
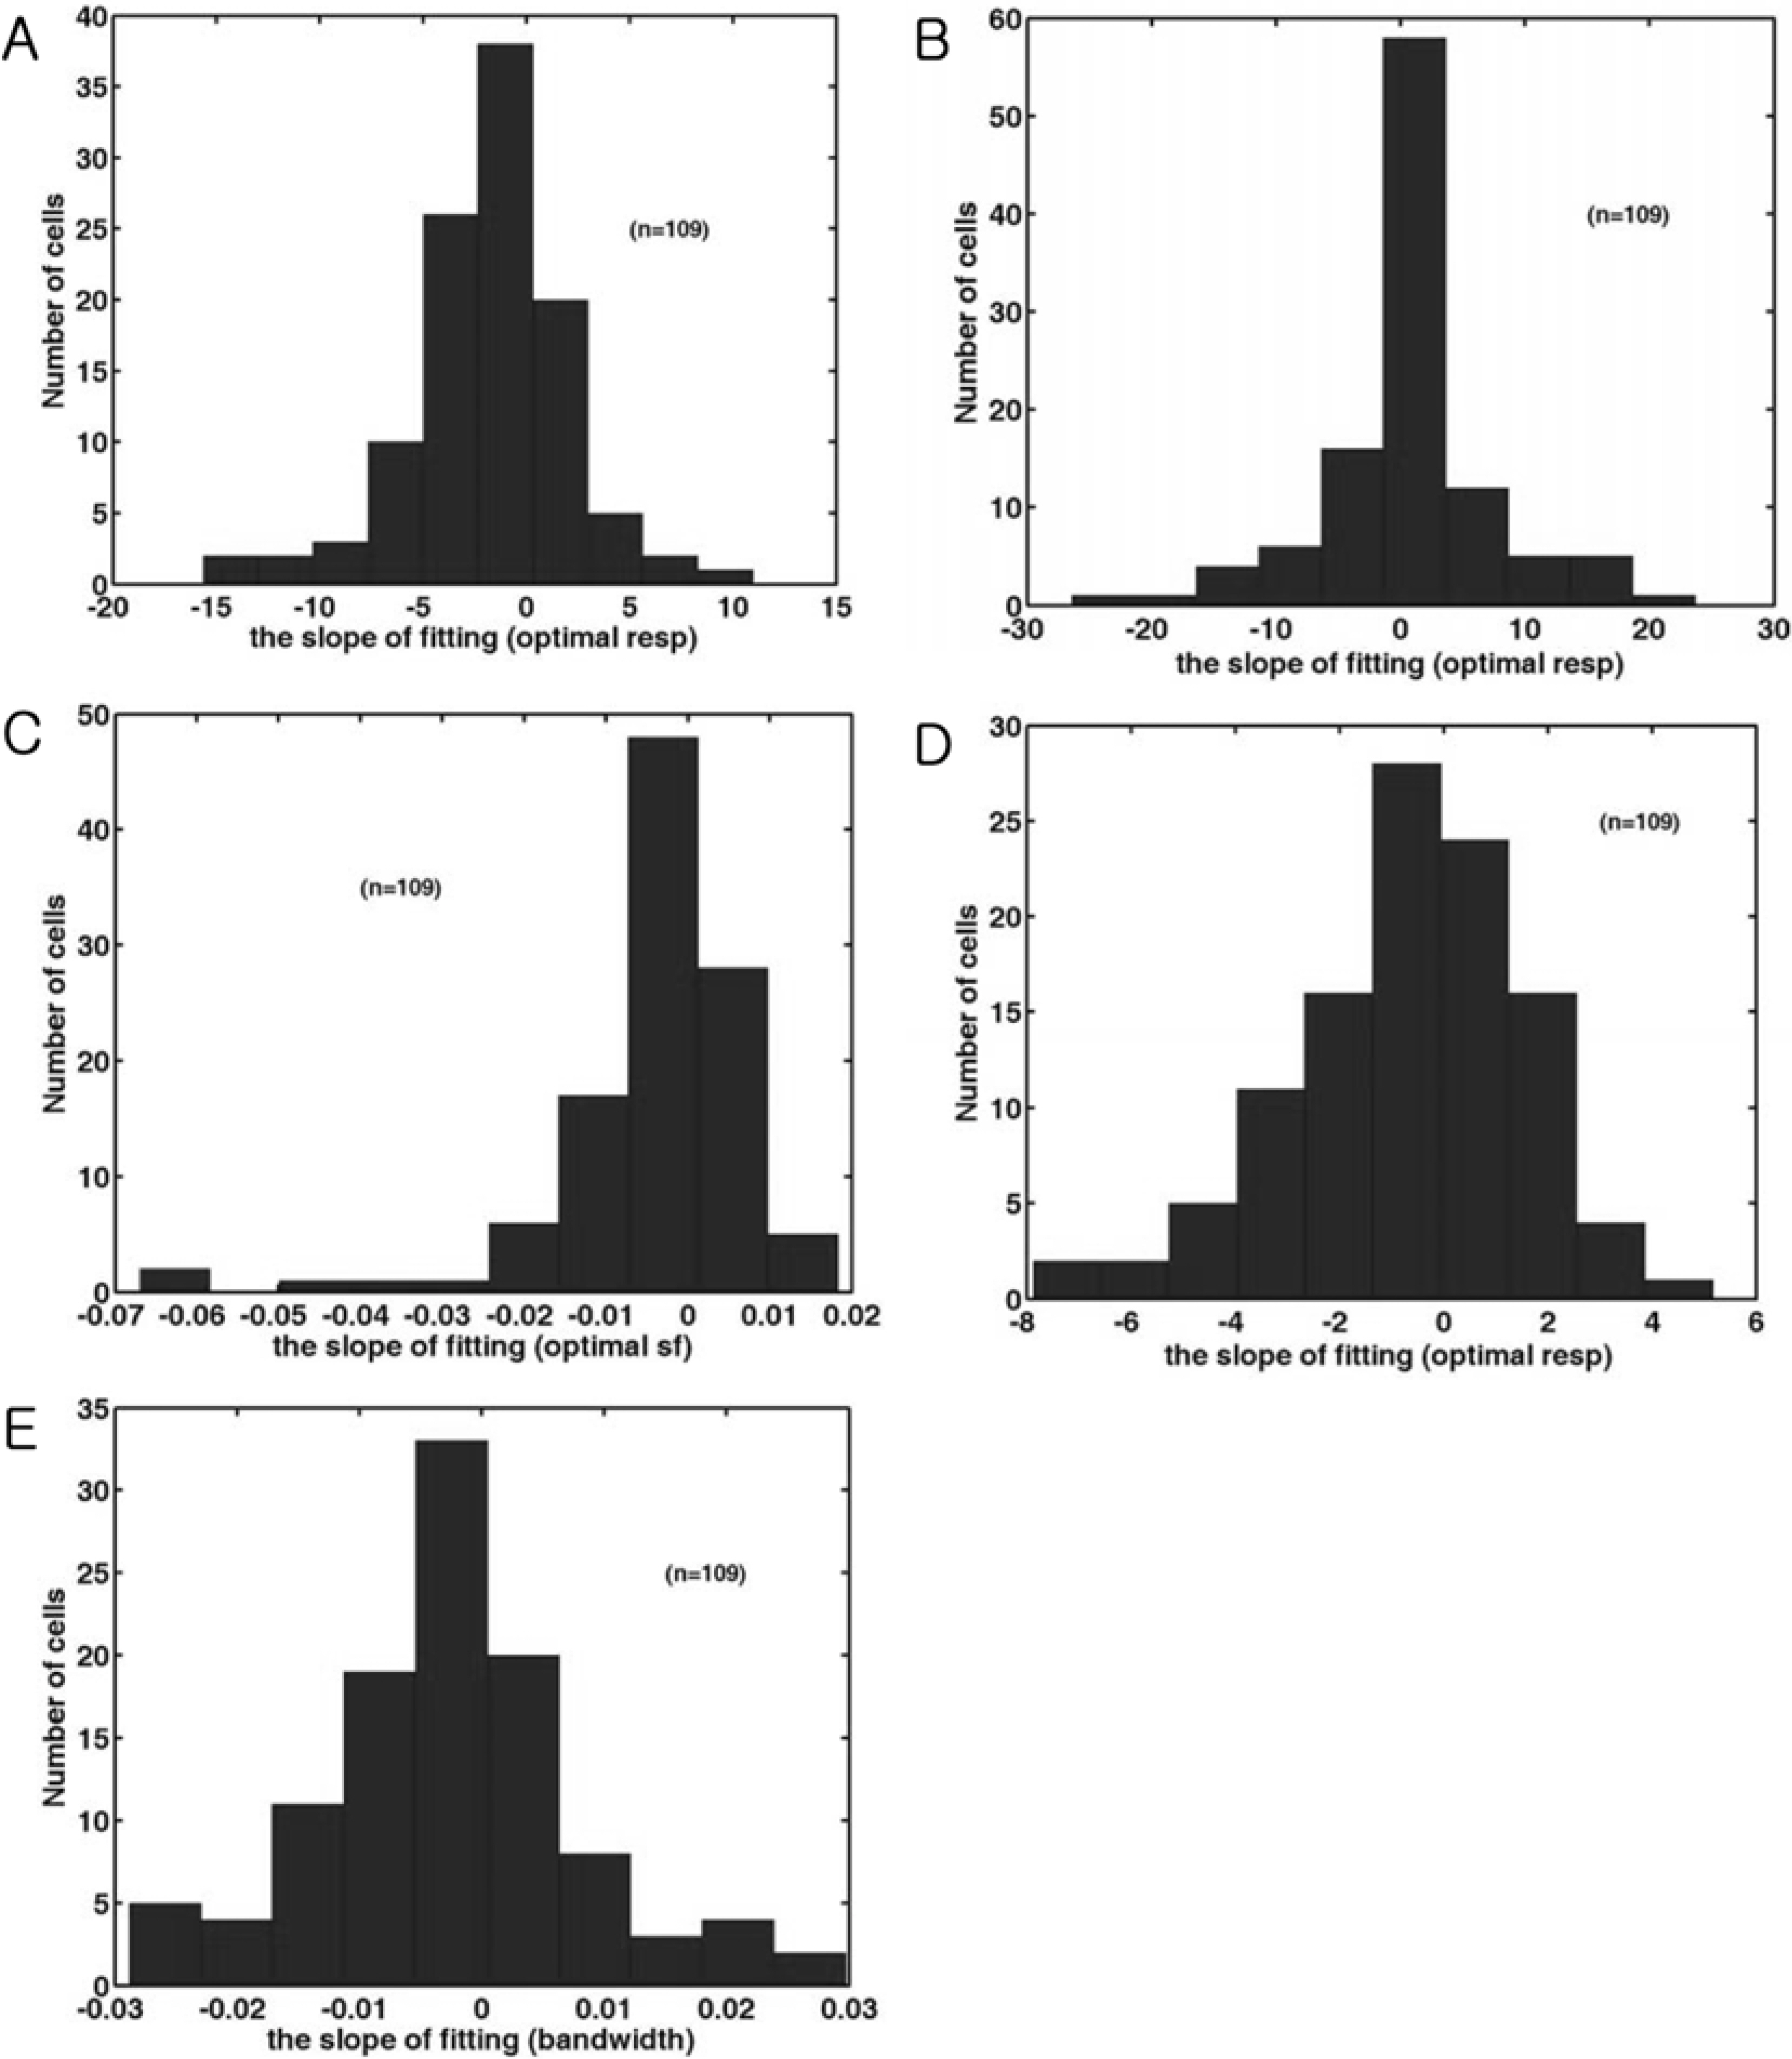
- Spatial frequency and direction tuning to drifting sinusoidal gratings are intrinsic properties of neurons in visual cortex neurons in areas 17 and 18. To investigate the stability of these tuning properties during visual stimulation in anesthetized cats, the temporal dynamics of spatial frequency and direction tuning were analyzed in every 0.1 sec. The responses of cortical neurons (n=109) as a function of spatial frequency as well as direction at a particular velocity for 1 second were measured and plotted as a contour plot. Five parameters from this plot were extracted: optimum response, preferred direction (direction that showed the optimum response), optimum spatial frequency (spatial frequency that showed the optimum response), direction tuning width (the difference between the highest and lowest directions to which the cell was at least half as responsive as it was to its optimum direction) and spatial frequency bandwidth (the difference between the highest and lowest frequencies to which the cell was at least half as responsive as it was to its optimum frequency). Then, this contour plot was further analyzed in every 0.1 sec to investigate whether these five parameters were changed or not during the course of stimulation. These parameters were plotted along the time (0.1 sec step) and a line of fit was found. Both spatial frequency and direction tuning properties were not changed in most of the cells. This suggests that both direction and spatial frequency tuning properties are stable during drifting sinusoidal gratings' stimulation.
Figure
Reference
-
Bredfeldt C.E.., Ringach D.L.2002. Dynamics of spatial frequency tuning in macaque V1. J. Neurosci. 22(5):1976–1984.
ArticleCampbell F.W.., Cleland B.G.., Cooper G.F.., Enroth-Cugell C.1968. The angular selectivity of visual cortical cells to moving gratings. J. Physiol. 198(1):237–250.
ArticleCampbell F.W.., Cooper G.F.., Enroth-Cugell C.1969. The spatial selectivity of the visual cells of the cat. J. Physiol.Celebrini S.., Thorpe S.., Trotter Y.., Imbert M.1993. Dynamics of orientation coding in area V1 of the awake primate. Vis. Neurosci. 10(5):811–825.
ArticleChen G.., Dan Y.., Li C.Y.2005. Stimulation of nonclassical receptive field enhances orientation selectivity in the cat. J. Physiol. 564(1):233–243.
ArticleDe Valois R.L.., Albrecht D.G.., Thorell L.G.1982. Spatial frequency selectivity of cells in macaque visual cortex. Vision Res. 22(5):545–559.
ArticleFrazor R.A.., Albrecht D.G.., Geisler W.S.., Crane A.M.2004. Visual cortex neurons of monkeys and cats: temporal dynamics of the spatial frequency response function. J. Neurophysiol. 91(6):2607–2627.
ArticleTusa R.J.., Palmer L.A.., Rosenquist A.C.1978. The retinotopic organization of area 17 (striate cortex) in the cat. J. Comp. Neurol. 177(2):213–235.
ArticleVolgushev M.., Vidyasagar T.R.., Pei X.1995. Dynamics of the orientation tuning of postsynaptic potentials in the cat visual cortex. Vis. Neurosci. 12(4):621–628.
ArticleGillespie D.C.., Lampl I.., Anderson J.S.., Ferster D.2001. Dynamics of the orientation-tuned membrane potential response in cat primary visual cortex. Nature Neurosci. 4(10):1014–1019.
ArticleHammond P.., Pomfrett C.J.1990. Influence of spatial frequency on tuning and bias for orientation and direction in the cat's striate cortex. Vision Res. 30(3):359–369.
ArticleJones J.P.., Stepnoski A.., Palmer L.A.1987. The two-dimensional spectral structure of simple receptive fields in cat striate cortex. J. Neurophysiol. 58(6):1212–1232.
ArticleKim J.N.., Leem M.A.2008. Temporal coding of the spatial frequency and direction tuning in cat cortical areas 17 and 18. Soc. for Neurosci. 459.8.Maffei L.., Fiorentini A.1973. The visual cortex as a spatial frequency analyzer. Vision Res. 13(7):1255–1267.Malone B.J.., Ringach D.L.2008. Dynamics of tuning in the Fourier domain. J. Neurophysiol. 100(1):239–248.
ArticleMazer J.A.., Vinje W.E.., McDermott J.., Schiller P.H.., Gallant J.L.2002. Spatial frequency and orientation tuning dynamics in area V1. Proc. Natl. Acad. Sci. U S A. 99(3):1645–1650.
ArticleMovshon J.A.., Thompson I.D.., Tolhurst D.J.1978. Spatial and temporal contrast sensitivity of neurones in areas 17 and 18 of the cat's visual cortex. J. Physiol. 283(1):101–120.
ArticleNishimoto S.., Arai M.., Ohzawa I.2005. Accuracy of subspace mapping of spatiotemporal frequency domain visual receptive fields. J. Neurophysiol. 93(6):3524–3536.
ArticlePark Y.., Kim J.N.2004. Spatial frequency and velocity tunings of neurons in areas 17 and 18 of the cat using a 100 microelectrode array. Korean J. Lab. Anim. Sci. 20(1):26–30.Ringach D.L.., Hawken M.J.., Shapley R.1997. Dynamics of orientation tuning in macaque primary visual cortex. Nature. 387(6630):281–284.
ArticleRingach D.L.., Hawken M.J.., Shapley R.2003. Dynamics of orientation tuning in macaque V1: the role of global and tuned suppression. J. Neurophysiol. 90(1):342–352.Rousche P.J.., Normann R.A.1992. A method for pneumatically inserting an array of penetrating electrodes into cortical tissue. Ann. Biomed. Eng. 20(4):413–422.
ArticleSchummers J.., Cronin B.., Wimmer K.., Stimberg M.., Martin R.., Obermayer K.., Koerding K.., Sur M.2007. Dynamics of orientation tuning in cat v1 neurons depend on location within layers and orientation maps. Front Neurosci. 1(1):145–159.
ArticleShapley R.., Hawken M.., Ringach D.L.2003. Dynamics of orientation selectivity in the primary visual cortex and the importance of cortical inhibition. Neuron. 38(5):689–699.
ArticleShapley R.., Hawken M.., Xing D.2007. The dynamics of visual responses in the primary visual cortex. Prog. Brain Res. 165(1):21–32.
ArticleSharon D.., Grinvald A.2002. Dynamics and constancy in cortical spatiotemporal patterns of orientation processing. Science. 295(5554):512–515.
ArticleTolhurst D.J.., Movshon J.A.1975. Spatial and temporal contrast sensitivity of striate cortical neurones. Nature. 257(5528):674–675.
ArticleTusa R.J.., Palmer L.A.., Rosenquist A.C.1978. The retinotopic organization of area 17 (striate cortex) in the cat. J. Comp. Neurol. 177(2):213–235.
ArticleVolgushev M.., Vidyasagar T.R.., Pei X.1995. Dynamics of the orientation tuning of postsynaptic potentials in the cat visual cortex. Vis. Neurosci. 12(4):621–628.
Article
- Full Text Links
- Actions
-
Cited
- CITED
-
- Close
- Share
- Similar articles
-
- The Influence of Contrasts on Directional and Spatial Frequency Tuning in Visual Cortex Areas 17/18 of the Cat
- Comparison of Activation in the Primary Visual Cortex between Anisometropic and Strabismic Amblyopias using Functional MRI
- Spatial and Temporal Characteristics of Visual Field Progression in Glaucoma Assessed by Parallel Factor Analysis
- Neuroanatomy of Unilateral Neglect Syndrome
- Understanding of Structure and Function of Vestibular Cortex


