Contrast Media in Abdominal Computed Tomography: Optimization of Delivery Methods
- Affiliations
-
- 1Seoul Natl Univ Hosp,Dept Radiol Chongno Gu,28 Yongon Dong, Seoul 110744, South Korea.
- KMID: 754120
- DOI: http://doi.org/10.3348/kjr.2001.2.1.28
Abstract
OBJECTIVE
To provide a systematic overview of the effects of various parameters on contrast enhancement within the same population, an animal experiment as well as a computer-aided simulation study was performed. MATERIALS AND METHODS: In an animal experiment, single-level dynamic CT through the liver was performed at 5-second intervals just after the injection of contrast medium for 3 minutes. Combinations of three different amounts (1, 2, 3 mL/kg), concentrations (150, 200, 300 mgI/mL), and injection rates (0.5, 1, 2 mL/sec) were used. The CT number of the aorta (A), portal vein (P) and liver (L) was measured in each image, and time-attenuation curves for A, P and L were thus obtained. The degree of maximum enhancement (Imax) and time to reach peak enhancement (Tmax) of A, P and L were determined, and times to equilibrium (Teq) were analyzed. In the computed-aided simulation model, a program based on the amount, flow, and diffusion coefficient of body fluid in various compartments of the human body was designed. The input variables were the concen-trations, volumes and injection rates of the contrast media used. The program generated the time-attenuation curves of A, P and L, as well as liver-to-hepatocel-lular carcinoma (HCC) contrast curves. On each curve, we calculated and plotted the optimal temporal window (time period above the lower threshold, which in this experiment was 10 Hounsfield units), the total area under the curve above the lower threshold, and the area within the optimal range. RESULTS: A. Animal Experiment: At a given concentration and injection rate, an increased volume of contrast medium led to increases in Imax A, P and L. In addition, Tmax A, P, L and Teq were prolonged in parallel with increases in injection time The time-attenuation curve shifted upward and to the right. For a given volume and injection rate, an increased concentration of contrast medium increased the degree of aortic, portal and hepatic enhancement, though Tmax A, P and L remained the same. The time-attenuation curve shifted upward. For a given volume and concentration of contrast medium, changes in the injection rate had a prominent effect on aortic enhancement, and that of the portal vein and hepatic parenchyma also showed some increase, though the effect was less prominent. A increased in the rate of contrast injection led to shifting of the time enhancement curve to the left and upward. B. Computer Simulation: At a faster injection rate, there was minimal change in the degree of hepatic attenuation, though the duration of the optimal temporal window decreased. The area between 10 and 30 HU was greatest when contrast media was delivered at a rate of 2 -3 mL/sec. Although the total area under the curve increased in proportion to the injection rate, most of this increase was above the upper threshould and thus the temporal window was narrow and the optimal area decreased. CONCLUSION: Increases in volume, concentration and injection rate all resulted in improved arterial enhancement. If cost was disregarded, increasing the injection volume was the most reliable way of obtaining good quality enhancement. The optimal way of delivering a given amount of contrast medium can be calculated using a computer-based mathematical model.
Keyword
MeSH Terms
Figure
-
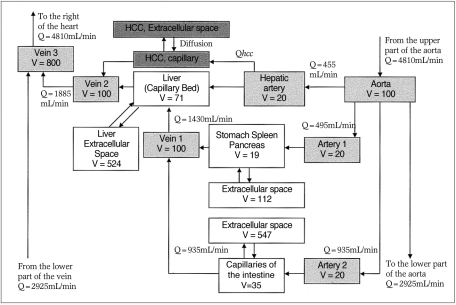
Fig. 1 Compartment model to illustrate the transport process of contrast medium to the liver.Blood is supplied to the liver by both the hepatic artery (HA) and portal vein (vein 1), but the HCC compartment is supplied exclusively by the hepatic artery. (Partial adoptation and modification of the model proposed by Bae (9); V: volume of the compartment, Q: flow rate).
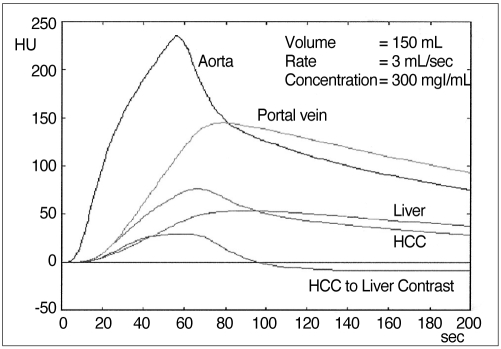
Fig. 2 Time-attenuation curves generated from our program. From the time-attenuation curves for hepatic parenchyma and simulated hepatocellular carcinoma, the HCC-to-liver contrast curve, representing tumor visibility, could be generated.

Fig. 3 HCC-to-liver contrast plotted against time.The graph represents the CT attenuation difference between normal hepatic parenchyma and HCC. The shaded area between the lower (red line) and upper threshold (blue line) represents optimal enhancement. The area below 10 HU (*) is suboptimal and above 20 HU (arrow) is superfluous. The shaded area plus superfluous enhancement is represented by the total area under the curve above the lower threshold.

Fig. 4 Time-attenuation curves obtained at an identical injection rate (1 mL/sec) and concentration (300mgl/mL) of contrast medium, but with different volumes [1 (n=8), 2 (n=6), 3 (n=6) mL/kg, respectively].A. Time-attenuation curves for the aorta and portal vein show that an increased injection volume leads to increased enhancement, and an increased duration of injection leads to a shifting of Tmax to the right (arrow).B. Time-attenuation curves for hepatic parenchyma show the same changes as in (A).

Fig. 5 Time-attenuation curves obtained at an identical injection rate (1 mL/sec) and volume (2 mL/kg)of contrast medium, but at different concentrations [150, 200, 300 mgI/mL, respectively (n=7 in all three groups)].A. Time-attenuation curves for the aorta vein show that an increased concentration of contrast medium leads to increases in the degree of enhancement, but since the duration of injection has not changed, Tmax is the same (arrow).B. Time-attenuation curves for hepatic parenchyma shows the same changes as in (A).

Fig. 6 Time-attenuation curves obtained at an identical concentration (300 mgI/mL) and volume (3mL/kg) of contrast medium, but at different injection rates [0.5 (n=8), 1 (n=6), 2 (n=7) mL/sec, respectively].A. Time-attenuation curves for the aorta show that with an increased injection rate the degree of enhancement increases, but since the duration of injection is shortened, Tmax decreases (arrow).B. Time-attenuation curves for the liver show the same changes as in (A). However, the degree of maximal liver enhancement at injection rates of 1 and 2 mL/sec is almost the same, while Tmax has shifted to the left.

Fig. 7 Comparison of two time-attenuation curves obtained while injecting identical amounts of iodine (600 mgI/kg) at different rates [1 mL/sec (A), and 2 mL/sec (B)].A. At 1mL/sec, the degree of aortic enhancement is almost the same. Contrast medium in a low concentration-large volume combination (n=8) produced better portal and hepatic enhancement than a high concentration-small volume combination (n=6).B. At 2mL/sec, a low concentration-large volume combination (n=7) produced better aortic, portal and hepatic enhancement than a high concentration-small volume combination (n=7).

Fig. 8 Simulated time-attenuation curves generated by computer program. When volume, concentration and injection rates were changed, close correlation with actual experimental data was observed.A. Volume of contrast medium was increased from 130 to 250 mL, while the injection rate and concentration remained at 3 mL/sec and 300 mgI/mL, respectively.B. Concentration was increased from 200 to 400 mgI/mL, while the volume and injection rate remained at 150 mL and 3 mL/sec, respectively.C. Injection rate was increased from 2 to 5.5 mL/sec, while the volume and concentration remained at 150 mL and 300 mgl/mL, respectively.
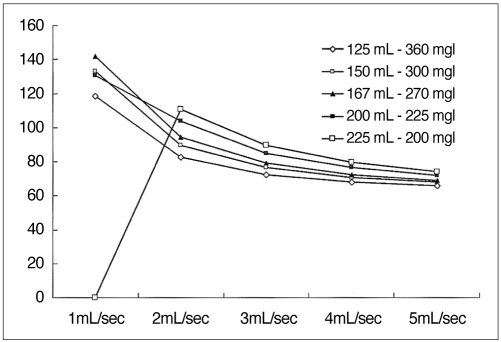
Fig. 9 Using high-concentration medium, the width of the temporal window decreases as the injection rate is increased or the volume is decreased.However, when low-concentration medium (200 mgl/mL) is delivered very slowly (1 mL/sec), enhancement will not be satisfactory.
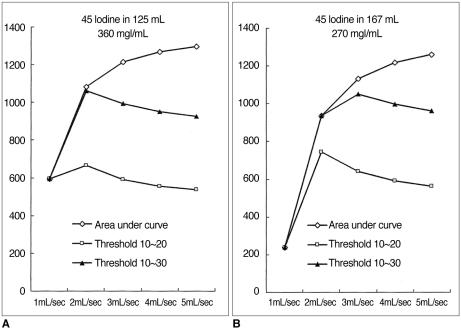
Fig. 10 Area under the curve and area between the lower and upper threshold calculated at various injection rates.A. 45g Iodine in 125 mL of contrast medium (360 mgI/mL). At a faster injection rate, the total area under the curve increases. The area between the two threshold values peaks at an injection rate of 2 mL/sec, however.B. 45 g Iodine in 167 mL of contrast medium (270 mgI/mL). The graph shows the same tendency as (A), while the peak is observed at an injection rate of 2 to 3 mL/sec, depending on the threshold value.
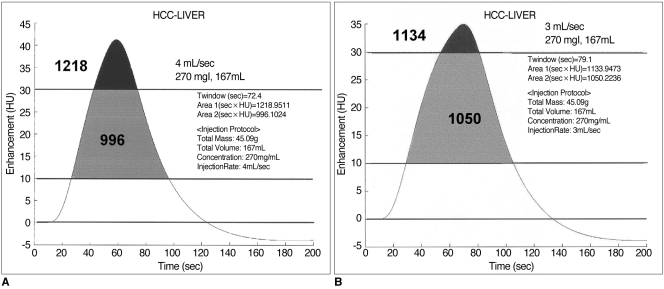
Fig. 11 Comparison of area under the curve and area between the thresholds in two injection protocols (270mgI/mL and 167mL, delivered at 4 and 3 mL/sec).A. At a rate of 4 mL/sec, the duration of the temporal window is 72.4 sec. Thet total area under the curve is 1218, while the area between the upper and lower thresholds (30 and 10 HU, respectively, in this graph) is 996.B. At a rate of 3 mL/sec, the duration of the temporal window is 79.1 sec. The total area under the curve is 1134 and the area between the thresholds is 1050. Compared with (A), there is a wider temporal window and a larger area between the thresholds. At a faster injection rate, a larger area is seen under the curve, but the area of greatest increase is above the threshold (black area).
Cited by 2 articles
-
Optimal scan delay depending on contrast material injection duration in abdominal multi-phase computed tomography of pancreas and liver in normal Beagle dogs
Soo-Young Choi, In Lee, Ji-Won Seo, Hyun-Young Park, Ho-Jung Choi, Young-Won Lee
J Vet Sci. 2016;17(4):555-561. doi: 10.4142/jvs.2016.17.4.555.Three-dimensional CT angiography of the canine hepatic vasculature
Yucheol Jeong, Changyun Lim, Sunkyoung Oh, Joohyun Jung, Jinhwa Chang, Junghee Yoon, Mincheol Choi
J Vet Sci. 2008;9(4):407-413. doi: 10.4142/jvs.2008.9.4.407.
Reference
-
1. Cox IH, Foley WD, Hoffman RG. Right window for dynamic hepatic CT. Radiology. 1991; 181:18–21. PMID: 1887031.
Article2. Heiken JP, Brink JA, McClennan BL, et al. Dynamic contrast-enhanced CT of the liver: comparison of contrast medium injection rates and uniphasic and biphasic injection protocols. Radiology. 1993; 187:327–331. PMID: 8475268.
Article3. Foley WD, Hoffmann RG, Quiroz FA, Kahn CE, Perret RS. Hepatic helical CT: contrast material injection protocol. Radiology. 1994; 192:367–371. PMID: 8029399.
Article4. Birnbaum BA, Jacobs JE, Yin D. Hepatic enhancement during helical CT: a comparison of moderate rate uniphasic and biphasic contrast injection protocols. AJR. 1995; 165:853–858. PMID: 7676980.
Article5. Kim T, Murakami T, Takahashi S, et al. Effects of injection rates of contrast material on arterial hepatic CT. AJR. 1998; 171:429–432. PMID: 9694469.6. Garcia PA, Bonaldi VM, Bret PM, et al. Effect of rate of contrast medium injection on hepatic enhancement at CT. Radiology. 1996; 199:185–189. PMID: 8633144.
Article7. Han JK, Kim AY, Lee KY, et al. Factors influencing vascular and hepatic enhancement at CT: experimental study of injection protocol using a canine model. J Comput Assist Tomogr. 2000; 24:400–406. PMID: 10864075.9. Bae KT, Heiken JP, Brink JA. Aortic and hepatic contrast medium enhancement at CT. Part I: Prediction with a computer model. Radiology. 1998; 207:647–655. PMID: 9609886.
Article10. Kim S, Kim JH, Han JK, Lee KH, Min B. Prediction of optimal injection protocol for tumor detection in contrast-enhanced dynamic hepatic CT using simulation of lesion-to-liver contrast enhancement. Comput Med Imaging Graph. 2000; 24:317–327. PMID: 10940609.11. Chambers TP, Baron RL, Lush RM. Hepatic CT enhancement. Part I: Alteration in the volume of contrast material within the same patients. Radiology. 1994; 193:513–517. PMID: 7972770.12. Chambers TP, Baron RL, Lush RM. Hepatic CT enhancement. Part II: Alteration in the volume and rate of injection within the same patients. Radiology. 1994; 193:518–522. PMID: 7972771.
- Full Text Links
-
- Actions
-
Cited
- CITED
-
- Close
- Share
-
- Similar articles
-
- Innovation and Optimization of Contrast Media Administration in Computed Tomography
- Preparative fasting before contrast-enhanced computed tomography
- Transient Orbitofacial Angioedema due to Intravenous Iodinated Contrast Media During Computed Tomography: CT Findings
- Compartment Syndrome of the Upper Extremity Induced by Extravasation of Contrast Media after Computed Tomography: A Case Report
- Computed Tomographic Dacfyocystography using Rayvist(R)
