Ann Clin Microbiol.
2025 Mar;28(1):3. 10.5145/ACM.2025.28.1.3.
Mock communities to assess biases in nextgeneration sequencing of bacterial species representation
- Affiliations
-
- 1Department of Laboratory Medicine and Research Institute of Bacterial Resistance, Yonsei University College of Medicine, Seoul, Korea
- 2Brain Korea 21 PLUS Project for Medical Science, Yonsei University College of Medicine, Seoul, Korea
- 3Department of Tropical Medicine, Institute of Tropical Medicine and Arthropods of Medical Importance Resource Bank, Yonsei University College of Medicine, Seoul, Korea
- 4Division of Chemical and Medical Metrology, Center for Bioanalysis, Korea Research Institute of Standards and Science, Daejeon, Korea
- 5Convergent Research Center for Emerging Virus Infection, Korea Research Institute of Chemical Technology, Daejeon, Korea
- 6Roche Diagnostics Korea, Seoul, Korea
- KMID: 2566599
- DOI: http://doi.org/10.5145/ACM.2025.28.1.3
Abstract
- Background
The 16S rRNA-targeted next-generation sequencing (NGS) has been widely used as the primary tool for microbiome analysis. However, whether the sequenced microbial diversity absolutely represents the original sample composition remains unclear. This study aimed to evaluate whether 16S rRNA gene-targeted NGS accurately captures bacterial community composition.
Methods
Mock communities were constructed using equal amounts of DNA from 18 bacterial strains in three formats: genomic DNA, recombinant plasmids, and polymerase chain reaction (PCR) templates. The V3V4 region of the 16S rRNA gene was amplified and sequenced using the Illumina MiSeq.
Results
Data regression analysis revealed that the recombinant plasmid produced more accurate and precise correlation curve than that by the gDNA and PCR products, with a slope closest to 1 (1.0082) and the highest R² value (0.9975). Despite the same input amount of bacterial DNA, the NGS read distribution varied across all three mock communities. Using multiple regression analysis, we found that the guanine-cytosine (GC) content of the V3V4 region, 16S rRNA gene, size of gDNA, and copy number of 16S rRNA were significantly associated with the NGS output of each bacterial species.
Conclusion
This study demonstrated that recombinant plasmids are the preferred option for quality control and that NGS output is biased owing to certain bacterial characteristics, such as %GC content, gDNA size, and 16S rRNA gene copy number. Further research is required to develop a system that compensates for NGS process biases using mock communities.
Keyword
Figure
-
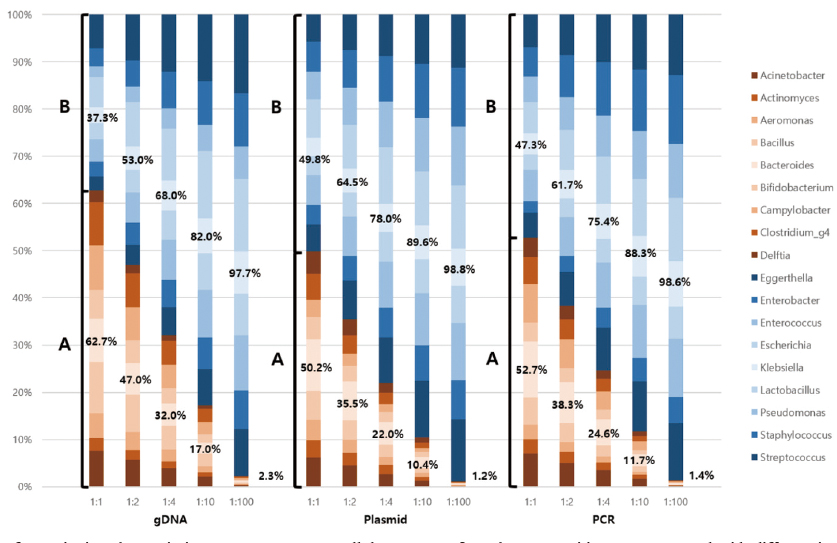
Fig. 1. Effect of quantitative change in input to NGS output. All three types of mock communities were prepared with different input ratios of A and B (1:1, 1:2, 1:4, 1:10, and 1:100) to systematically assess the quantitative reflection of bacterial input in NGS output. Group A is presented in orange and group B is presented in blue. The regression equation for gDNA is represented as y = 1.2259x - 26.705 with a coefficient of determination (R²) of 0.9854. The regression equations for plasmid DNA and PCR product are ‘y = 1.0082x - 1.6091 with an R² value of 0.9975’ and ‘y = 1.054x - 7.0206 with an R² value of 0.9939’, respectively.
Reference
-
1. D’Amore R, Ijaz UZ, Schirmer M, Kenny JG, Gregory R, Darby AC, et al. A comprehensive benchmarking study of protocols and sequencing platforms for 16S rRNA community profiling. BMC Genomics 2016;17:1-20.2. Tringe SG and Hugenholtz P. A renaissance for the pioneering 16S rRNA gene. Curr Opinion Microbiol 2008;11:442-6.3. Hamady M and Knight R. Microbial community profiling for human microbiome projects: tools, techniques, and challenges. Genome Res 2009;19:1141-52.4. Rinke C, Schwientek P, Sczyrba A, Ivanova NN, Anderson IJ, Cheng JF, et al. Insights into the phylogeny and coding potential of microbial dark matter. Nature 2013;499:431-7.5. Barb JJ, Oler AJ, Kim HS, Chalmers N, Wallen GR, Cashion A, et al. Development of an analysis pipeline characterizing multiple hypervariable regions of 16S rRNA using mock samples. PloS One 2016;11:e0148047.6. Liu Z, DeSantis TZ, Andersen GL, Knight R. Accurate taxonomy assignments from 16S rRNA sequences produced by highly parallel pyrosequencers. Nucleic Acids Res 2008;36:e120.7. Willner D, Daly J, Whiley D, Grimwood K, Wainwright CE, Hugenholtz P. Comparison of DNA extraction methods for microbial community profiling with an application to pediatric bronchoalveolar lavage samples. PloS One 2012;7:e34605.8. Bowers RM, Clum A, Tice H, Lim J, Singh K, Ciobanu D, et al. Impact of library preparation protocols and template quantity on the metagenomic reconstruction of a mock microbial community. BMC Genomics 2015;16:1-12.9. Clinical and Laboratory Standards Institute. Interpretive criteria for identification of bacteria and fungi by DNA target sequencing. MM18-A. Wayne, PA; CLSI: 2008.10. Poretsky R, Rodriguez-R LM, Luo C, Tsementzi D, Konstantinidis KT. Strengths and limitations of 16S rRNA gene amplicon sequencing in revealing temporal microbial community dynamics. PloS One 2014;9:e93827.11. Illumina. Illumina 16S metagenomic sequencing library preparation. https://support.illumina. com/documents/documentation/chemistry_documentation/16s/16s-metagenomic-library-prepguide-15044223-b.pdf [Online] (last visited on 15,06,2018).12. Quast C, Pruesse E, Yilmaz P, Gerken J, Schweer T, Yarza P, et al. The SILVA ribosomal RNA gene database project: improved data processing and web-based tools. Nucleic Acids Res 2012;41:D590-6.13. Cole JR, Wang Q, Fish JA, Chai B, McGarrell DM, Sun Y, et al. Ribosomal Database Project: data and tools for high throughput rRNA analysis. Nucleic Acids Res 2014;42:D633-42.14. Haas BJ, Gevers D, Earl AM, Feldgarden M, Ward DV, Giannoukos G, et al. Chimeric 16S rRNA sequence formation and detection in Sanger and 454-pyrosequenced PCR amplicons. Genome Res 2011;21:494-504.15. Paliy O, Kenche H, Abernathy F, Michail S. High-throughput quantitative analysis of the human intestinal microbiota with a phylogenetic microarray. Appl Environ Microbiol 2009;75:3572-9.16. Lauder AP, Roche AM, Sherrill-Mix S, Bailey A, Laughlin AL, Bittinger K, et al. Comparison of placenta samples with contamination controls does not provide evidence for a distinct placenta microbiota. Microbiome 2016;4:1-11.17. Andersson AF, Lindberg M, Jakobsson H, Bäckhed F, Nyrén P, Engstrand L. Comparative analysis of human gut microbiota by barcoded pyrosequencing. PloS One 2008;3:e2836.18. Kozich JJ, Westcott SL, Baxter NT, Highlander SK, Schloss PD. Development of a dual-index sequencing strategy and curation pipeline for analyzing amplicon sequence data on the MiSeq Illumina sequencing platform. Appl Environ Microbiol 2013;79:5112-20.19. Polz MF and Cavanaugh CM. Bias in template-to-product ratios in multitemplate PCR. Appl Environ Microbiol 1998;64:3724-30.20. Fouhy F, Clooney AG, Stanton C, Claesson MJ, Cotter PD. 16S rRNA gene sequencing of mock microbial populations-impact of DNA extraction method, primer choice and sequencing platform. BMC Microbiol 2016;16:1-13.
- Full Text Links
-
- Actions
-
Cited
- CITED
-
- Close
- Share
-
- Similar articles
-
- Diversity and community structure of ectomycorrhizal mycorrhizal fungi in roots and rhizosphere soil of Abies koreana and Taxus cuspidata in Mt. Halla
- Diversity of midgut microbiota in ticks collected from white-tailed deer (Odocoileus virginianus) from northern Mexico
- Intestinal Microbial Community Profiles of a Newborn Preterm Infant Using Pyrosequencing Analysis: Pilot Study
- Three Cases of Moraxella osloensis Meningitis: A Difficult Experience in Species Identification and Determination of Clinical Significance
- Multi-omics techniques for the genetic and epigenetic analysis of rare diseases
