Partial Deletion of Perk Improved High-Fat Diet-Induced Glucose Intolerance in Mice
- Affiliations
-
- 1Division of Endocrinology and Metabolism, Department of Internal Medicine, Seoul National University Hospital, Seoul, Korea
- 2Department of Internal Medicine, Seoul National University Bundang Hospital, Seongnam, Korea
- KMID: 2549271
- DOI: http://doi.org/10.3803/EnM.2023.1738
Abstract
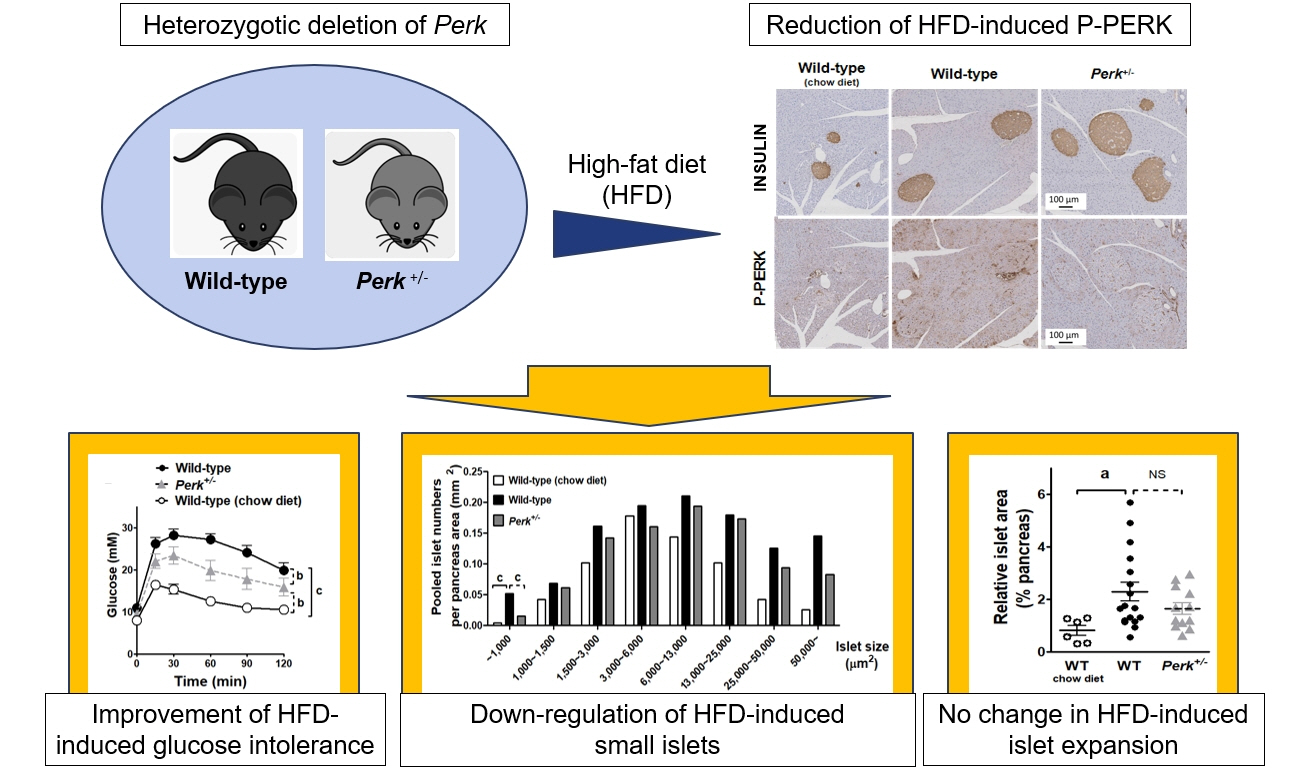
- Although pancreatic endoplasmic reticulum kinase (PERK) is indispensable to beta cells, low-dose PERK inhibitor improved glucose- stimulated insulin secretion (GSIS) and hyperglycemia in diabetic mice. Current study examined if partial deletion of Perk (Perk+/-) recapitulated the effects of PERK inhibitor, on the contrary to the complete deletion. Perk+/- mice and wild-type controls were fed with a high-fat diet (HFD) for 23 weeks. Glucose tolerance was evaluated along with serum insulin levels and islet morphology. Perk+/- mice on normal chow were comparable to wild-type mice in various metabolic features. HFD-induced obesity was not influenced by Perk reduction; however, HFD-induced glucose intolerance was significantly improved since 15-week HFD. HFD-induced compromises in GSIS were relieved by Perk reduction, accompanied by reductions in phosphorylated PERK and activating transcription factor 4 (ATF4) in the islets. Meanwhile, HFD-induced islet expansion was not significantly affected. In summary, partial deletion of Perk improved glucose tolerance and GSIS impaired by diet-induced obesity, without changes in body weights or islet mass.
Keyword
Figure
-
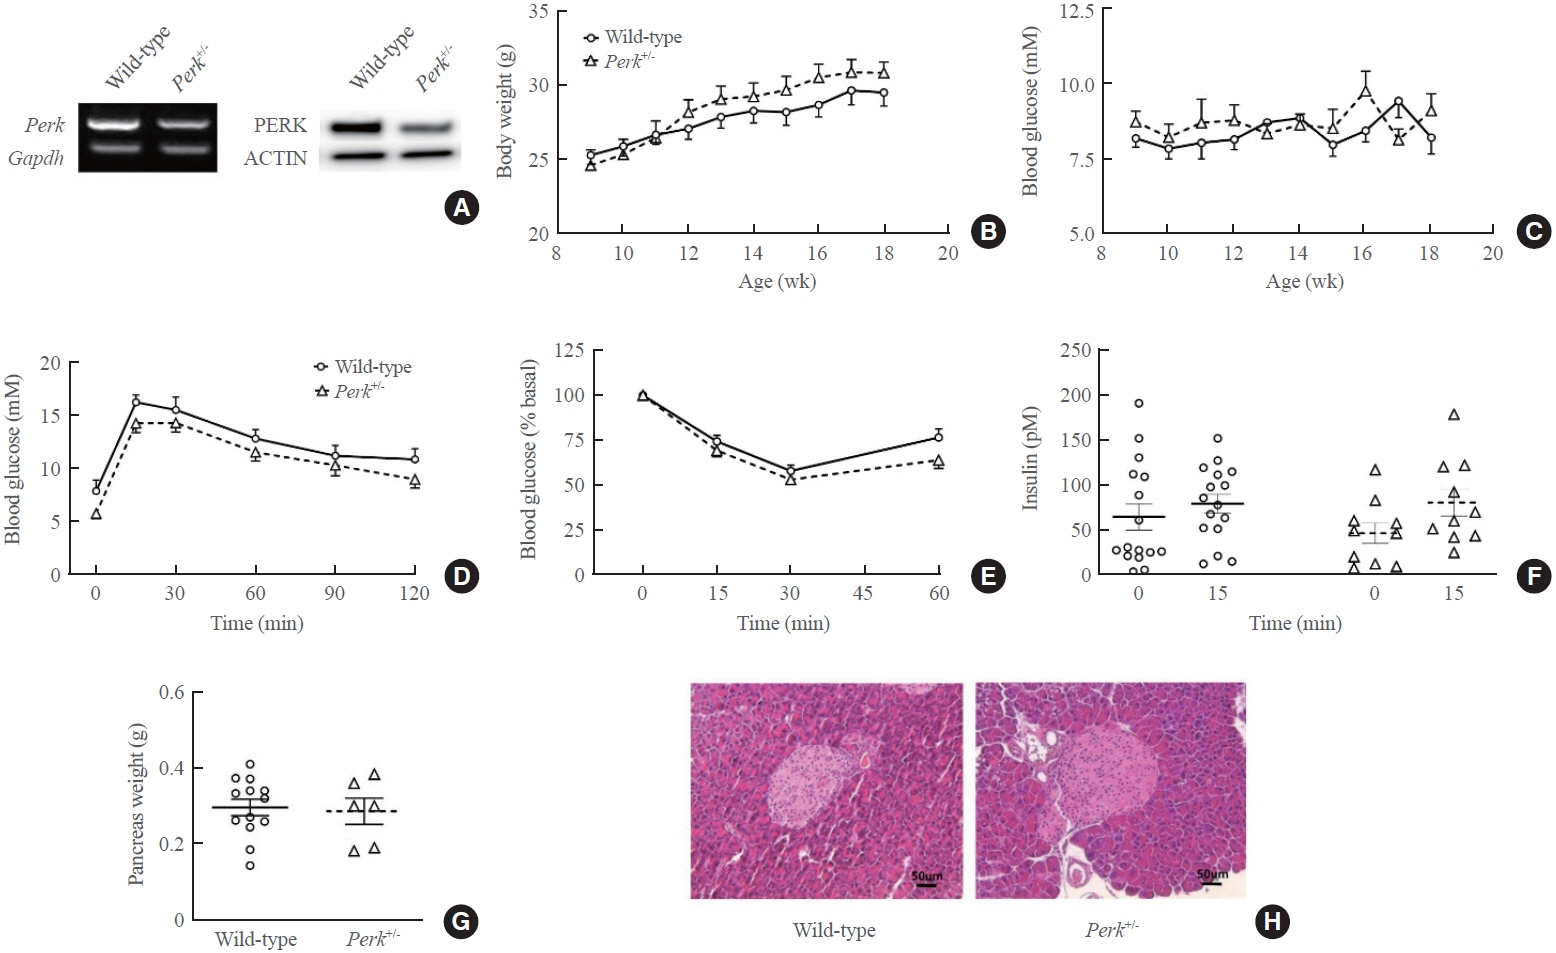
Fig. 1. Metabolic phenotypes and islet morphology of pancreatic endoplasmic reticulum kinase (Perk)+/- mice. Adult male Perk+/- mice and male wild-type littermates were compared after confirmation of the genotypes and Perk expression. Intraperitoneal glucose tolerance test (1 g/kg weight) and insulin tolerance test (regular insulin 0.5 U/kg weight) were performed after overnight fasting at 20 weeks old. (A) Pictures of reverse transcription-polymerase chain reaction (left) and Western blotting (right) using isolated islets. (B) Body weights. (C) Fed blood glucose levels. (D) Glucose tolerance test. (E) Insulin tolerance test. (F) Serum insulin levels before and after glucose loading. (G) Pancreas weights. (H) Representative pancreatic sections of hematoxylin and eosin staining. For (B-E), two-way repeated-measures analysis of variance was used. Paired t test for (F) and Student’s t test for (G) were applied. No statistical differences were found. Animal numbers=10 to 16 for each genotype. Gapdh, glyceraldehyde-3-phosphate dehydrogenase.
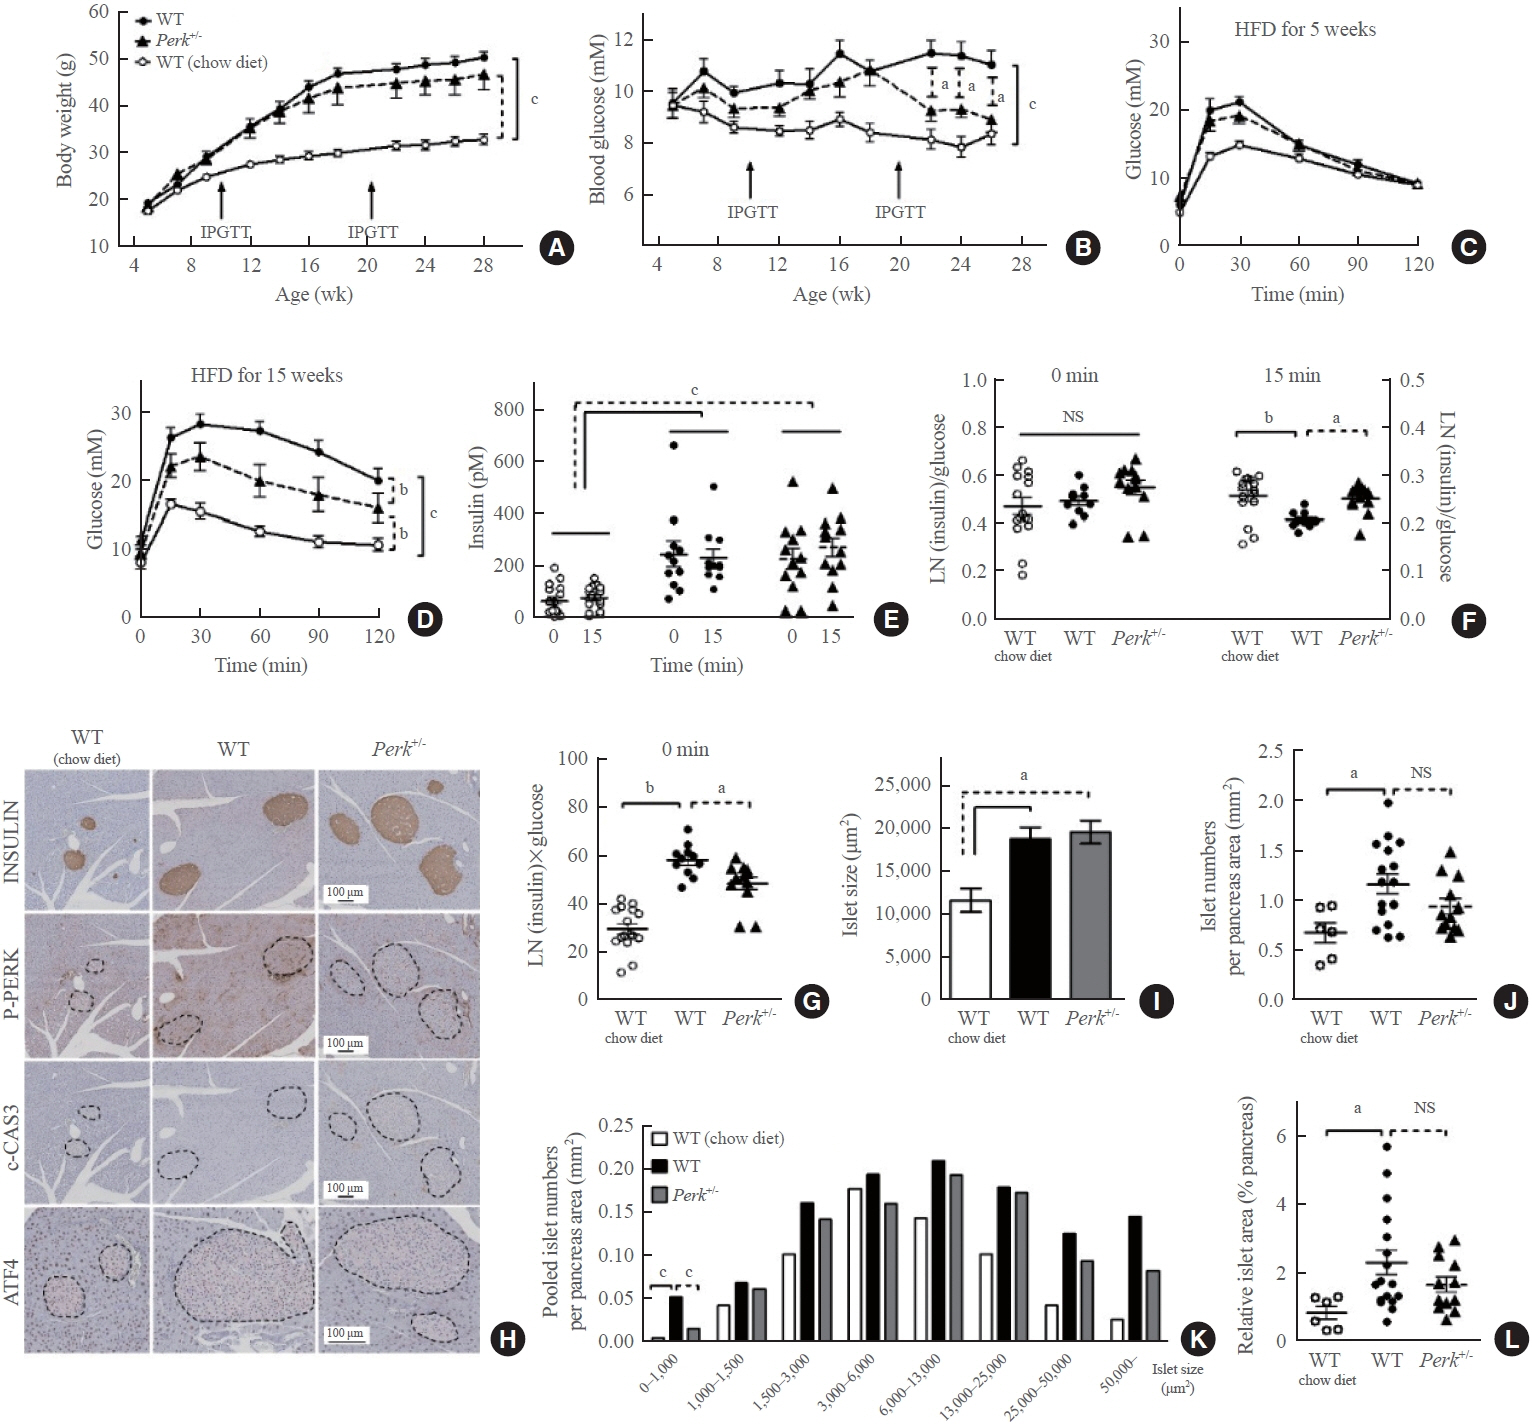
Fig. 2. Changes in the metabolic phenotypes and islet morphology by high-fat diet (HFD) in pancreatic endoplasmic reticulum kinase (Perk)+/- mice. Mice of either genotype were given a HFD at age 5 weeks for 23 weeks, and compared to wild-type (WT) mice on chow-diet. Body weights (A) and random blood glucose levels (B) were monitored. After 5 and 15 weeks of HFD, intraperitoneal glucose tolerance tests were performed (1 g/kg weight) (C, D). Serum insulin levels were measured before and 15 minutes after the glucose loading after 15-week HFD (E), and were subject to assess insulin secretion by adjustment with glucose levels (F). Insulin resistance was estimated by multiplying fasting insulin and glucose levels (G). Representative pictures of immunohistochemical stains in the pancreas (islets marked by broken lines) extracted after 23-week HFD or normal chow (H), pooled analysis for average islet sizes (I), islet numbers on each section adjusted by the pancreas area (J), islet size distribution after pooling the islets in each group (K), and relative islet area adjusted by the pancreas area (L). For (A-D), two-way repeated-measures analysis of variance (ANOVA) and Bonferroni posttests were performed. For the others, one-way ANOVA and Bonferroni posttests were applied, except for (K) where qui-square test was applied. Animal numbers, 7 to 17 for each group; pancreas area, 37.7±2.5 mm2/section; islet numbers, median 35/section from a mouse. IPGTT, intraperitoneal glucose tolerance test; NS, no significant difference; LN, logarithmus naturalis; P-PERK, phosphorylated PERK; c-CAS3, cleaved caspase-3; ATF4, activating transcription factor 4. aP<0.05; bP<0.01; cP<0.001 between the indications.
Reference
-
1. Delepine M, Nicolino M, Barrett T, Golamaully M, Lathrop GM, Julier C. EIF2AK3, encoding translation initiation factor 2-alpha kinase 3, is mutated in patients with Wolcott-Rallison syndrome. Nat Genet. 2000; 25:406–9.2. Kefalas G, Larose L. PERK leads a hub dictating pancreatic β cell homoeostasis. Biol Cell. 2018; 110:27–32.3. Kim MJ, Min SH, Shin SY, Kim MN, Lee H, Jang JY, et al. Attenuation of PERK enhances glucose-stimulated insulin secretion in islets. J Endocrinol. 2018; 236:125–36.
Article4. Kim MJ, Kim MN, Min SH, Ham DS, Kim JW, Yoon KH, et al. Specific PERK inhibitors enhanced glucose-stimulated insulin secretion in a mouse model of type 2 diabetes. Metabolism. 2019; 97:87–91.
Article5. Rojas-Rivera D, Delvaeye T, Roelandt R, Nerinckx W, Augustyns K, Vandenabeele P, et al. When PERK inhibitors turn out to be new potent RIPK1 inhibitors: critical issues on the specificity and use of GSK2606414 and GSK2656157. Cell Death Differ. 2017; 24:1100–10.
Article6. Harding HP, Zeng H, Zhang Y, Jungries R, Chung P, Plesken H, et al. Diabetes mellitus and exocrine pancreatic dysfunction in perk-/- mice reveals a role for translational control in secretory cell survival. Mol Cell. 2001; 7:1153–63.
Article7. Hull RL, Kodama K, Utzschneider KM, Carr DB, Prigeon RL, Kahn SE. Dietary-fat-induced obesity in mice results in beta cell hyperplasia but not increased insulin release: evidence for specificity of impaired beta cell adaptation. Diabetologia. 2005; 48:1350–8.
Article8. Wang R, Munoz EE, Zhu S, McGrath BC, Cavener DR. Perk gene dosage regulates glucose homeostasis by modulating pancreatic β-cell functions. PLoS One. 2014; 9:e99684.
Article9. Gupta S, McGrath B, Cavener DR. PERK (EIF2AK3) regulates proinsulin trafficking and quality control in the secretory pathway. Diabetes. 2010; 59:1937–47.10. Sachdeva MM, Stoffers DA. Minireview: meeting the demand for insulin: molecular mechanisms of adaptive postnatal beta-cell mass expansion. Mol Endocrinol. 2009; 23:747–58.11. Ahren J, Ahren B, Wierup N. Increased β-cell volume in mice fed a high-fat diet: a dynamic study over 12 months. Islets. 2010; 2:353–6.
Article12. Ozcan U, Cao Q, Yilmaz E, Lee AH, Iwakoshi NN, Ozdelen E, et al. Endoplasmic reticulum stress links obesity, insulin action, and type 2 diabetes. Science. 2004; 306:457–61.
Article13. Zhang W, Hietakangas V, Wee S, Lim SC, Gunaratne J, Cohen SM. ER stress potentiates insulin resistance through PERK-mediated FOXO phosphorylation. Genes Dev. 2013; 27:441–9.
Article14. Fang Z, Gao W, Jiang Q, Loor JJ, Zhao C, Du X, et al. Targeting IRE1α and PERK in the endoplasmic reticulum stress pathway attenuates fatty acid-induced insulin resistance in bovine hepatocytes. J Dairy Sci. 2022; 105:6895–908.
Article15. Nagy C, Einwallner E. Study of in vivo glucose metabolism in high-fat diet-fed mice using oral glucose tolerance test (OGTT) and insulin tolerance test (ITT). J Vis Exp. 2018; 131:56672.16. Lau H, Li S, Corrales N, Rodriguez S, Mohammadi M, Alexander M, et al. Necrostatin-1 supplementation to islet tissue culture enhances the in-vitro development and graft function of young porcine islets. Int J Mol Sci. 2021; 22:8367.
Article
- Full Text Links
-
- Actions
-
Cited
- CITED
-
- Close
- Share
-
- Similar articles
-
- Early high-fat feeding improves histone modifications of skeletal muscle at middle-age in mice
- Effects of the Combination of Evogliptin and Leucine on Insulin Resistance and Hepatic Steatosis in High-Fat Diet-Fed Mice
- A Pilot Study on the Effect of Cannabis Extract on Weight Loss in Diet-induced Obese Mice
- Role of insulin-like growth factor binding protein-3 in glucose and lipid metabolism
- Myeloid-specific SIRT1 Deletion Aggravates Hepatic Inflammation and Steatosis in High-fat Diet-fed Mice
