Nutr Res Pract.
2023 Oct;17(5):984-996. 10.4162/nrp.2023.17.5.984.
Gender differences in the association between food costs and obesity in Korean adults: an analysis of a population-based cohort
- Affiliations
-
- 1Department of International Health, Johns Hopkins Bloomberg School of Public Health, Baltimore, MD 21205, USA
- 2Department of Genetics and Biotechnology, College of Life Sciences, Kyung Hee University, Yongin 17104, Korea
- KMID: 2546953
- DOI: http://doi.org/10.4162/nrp.2023.17.5.984
Abstract
- BACKGROUND/OBJECTIVES
Prior studies, mostly conducted in Western countries, have suggested that the low cost of energy-dense foods is associated with an increased risk of obesity. This study aimed to investigate the association between food costs and obesity risk among Koreans who may have different food cost and dietary patterns than those of Western populations.
SUBJECTS/METHODS
We used baseline data from a cohort of 45,193 men and 83,172 women aged 40–79 years (in 2006–2013). Dietary intake information was collected using a validated food frequency questionnaire. Prudent and Western dietary patterns extracted via principal component analysis. Food cost was calculated based on Korean government data and market prices. Logistic regression analyses were performed to investigate the association of daily total, prudent, and Western food cost per calorie with obesity.
RESULTS
Men in the highest total food cost quintile had 15% higher odds of obesity, after adjusting for demographic characteristics and lifestyle factors (adjusted odds ratio, 1.15; 95% confidence interval, 1.08–1.22; P-trend < 0.001); however, this association was not clear in women (P-trend = 0.765). While both men and women showed positive associations between prudent food cost and obesity (P-trends < 0.001), the association between Western food cost and obesity was only significant in men (P-trend < 0.001).
CONCLUSIONS
In countries in which consumption of Western foods is associated with higher food costs, higher food costs are associated with an increased risk of obesity; however, this association differs between men and women.
Figure
-
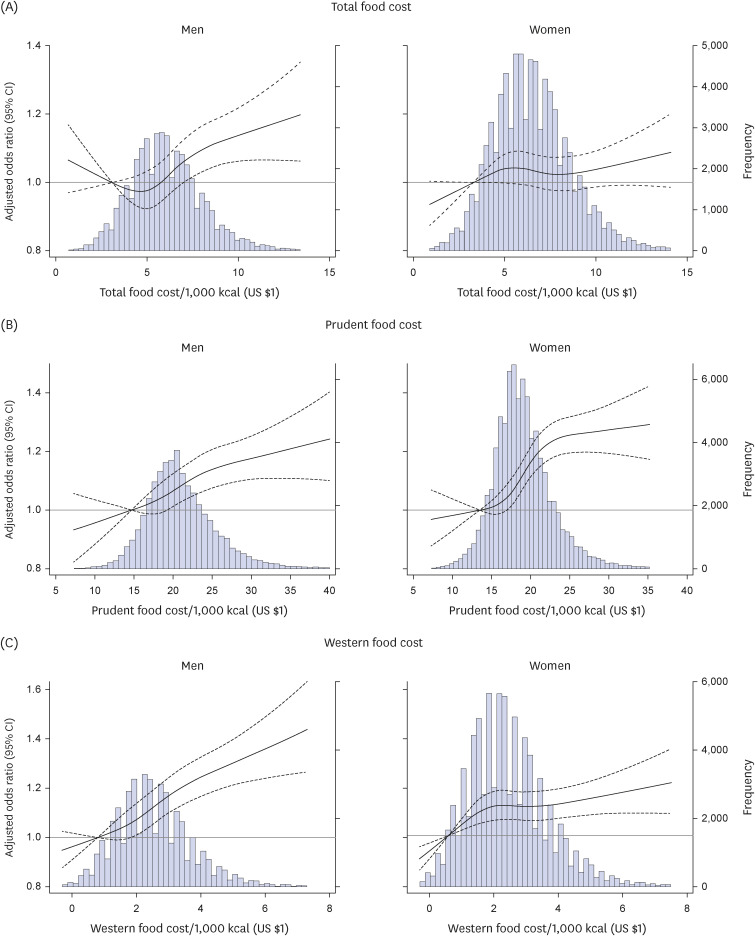
Fig. 1 Adjusted association for obesity according to the food cost per calorie, stratified by gender. The histogram in gray shows the distribution of total daily food cost (/1,000 kcal, US$). The ORs were adjusted for age, sex, education level, employment status, marital status, physical activity, smoking status, alcohol use, total energy intake, and monthly household income. (A) Total food cost. (B) Prudent food cost. (C) Western food cost.
Reference
-
1. NHLBI Obesity Education Initiative Expert Panel on the Identification Evaluation and Treatment of Obesity in Adults. Clinical Guidelines on the Identification, Evaluation, and Treatment of Overweight and Obesity in Adults: The Evidence Report. Bethesda (MD): National Institutes of Health, National Heart, Lung, and Blood Institute;1998.2. World Health Organization (WHO). Obesity and overweight [Internet]. Geneva: WHO;2021. cited 2021 November 10. Available from: https://www.who.int/news-room/fact-sheets/detail/obesity-and-overweight.3. Organisation for Economic Co-operation and Development (OECD). Overweight or Obese Population. Paris: OECD;2021.4. Kim KB, Shin YA. Males with obesity and overweight. J Obes Metab Syndr. 2020; 29:18–25. PMID: 32146733.5. Steenhuis IH, Waterlander WE, de Mul A. Consumer food choices: the role of price and pricing strategies. Public Health Nutr. 2011; 14:2220–2226. PMID: 21752312.6. French SA. Pricing effects on food choices. J Nutr. 2003; 133:841S–843S. PMID: 12612165.7. Darmon N, Ferguson EL, Briend A. A cost constraint alone has adverse effects on food selection and nutrient density: an analysis of human diets by linear programming. J Nutr. 2002; 132:3764–3771. PMID: 12468621.8. Powell LM, Chaloupka FJ. Food prices and obesity: evidence and policy implications for taxes and subsidies. Milbank Q. 2009; 87:229–257. PMID: 19298422.9. Headey DD, Alderman HH. The relative caloric prices of healthy and unhealthy foods differ systematically across income levels and continents. J Nutr. 2019; 149:2020–2033. PMID: 31332436.10. Wardle J, Haase AM, Steptoe A, Nillapun M, Jonwutiwes K, Bellisle F. Gender differences in food choice: the contribution of health beliefs and dieting. Ann Behav Med. 2004; 27:107–116. PMID: 15053018.11. Bärebring L, Palmqvist M, Winkvist A, Augustin H. Gender differences in perceived food healthiness and food avoidance in a Swedish population-based survey: a cross sectional study. Nutr J. 2020; 19:140. PMID: 33375947.12. Kim Y, Han BG. KoGES group. Cohort profile: the Korean Genome and Epidemiology Study (KoGES) consortium. Int J Epidemiol. 2017; 46:e20. PMID: 27085081.13. National Institute of Health (KR). Cohort description: KoGES_health examinees (HEXA) study [Internet]. Cheongju: NIH;2023. cited 2023 August 20. Available from: https://www.nih.go.kr/ko/main/contents.do?menuNo=300563.14. World Health Organization (WHO), Regional Office for the Western Pacific. The Asia-Pacific perspective: redefining obesity and its treatment [Internet]. Sydney: Health Communications Australia;2000. cited 2023 August 20. Available from: https://apps.who.int/iris/handle/10665/206936.15. Jolliffe IT, Cadima J. Principal component analysis: a review and recent developments. Philos Trans A Math Phys Eng Sci. 2016; 374:20150202. PMID: 26953178.16. The Korean Nutrition Society. Food composition table. Recommended Dietary Allowances for Koreans. Seoul: The Joongang Copy;2000.17. Rea LM, Parker RA. Designing and Conducting Survey Research. San Francisco (CA): Jossey-Bass;1992.18. Cramér H. The two-dimensional case. Mathematical Methods of Statistics. Princeton (NJ): Princeton University Press;1946. p. 260–290.19. Field A. Discovering Statistics Using IBM SPSS Statistics. 4th ed. London: SAGE Publications Ltd.;2013.20. Cohen J. Statistical Power Analysis for the Behavioral Sciences. 2nd ed. New York (NY): Lawrence Erlbaum Associates;1988.21. Lakens D. Calculating and reporting effect sizes to facilitate cumulative science: a practical primer for t-tests and ANOVAs. Front Psychol. 2013; 4:863. PMID: 24324449.22. Schuster NA, Rijnhart JJ, Twisk JW, Heymans MW. Modeling non-linear relationships in epidemiological data: the application and interpretation of spline models. Front Epidemiol. 2022; 2:975380.23. van Buuren S. Flexible multivariate imputation by MICE. Leiden: Netherlands Organization for Applied Scientific Research (TNO);1999. cited 2023 August 20. Available from: http://publications.tno.nl/publication/34618574/FW469e/buuren-1999-flexible.pdf.24. Schafer JL. Multiple imputation: a primer. Stat Methods Med Res. 1999; 8:3–15. PMID: 10347857.25. Goldman D, Lakdawalla D, Zheng Y. Food prices and the dynamics of body weight. Grossman M, Mocan NH, editors. Economic Aspects of Obesity. Chicago (IL): University of Chicago Press;2008. p. 65–90.26. Lopez CN, Martinez-Gonzalez MA, Sanchez-Villegas A, Alonso A, Pimenta AM, Bes-Rastrollo M. Costs of Mediterranean and western dietary patterns in a Spanish cohort and their relationship with prospective weight change. J Epidemiol Community Health. 2009; 63:920–927. PMID: 19762456.27. Muñoz FL, Pou SA, Diaz MD. An empirically derived “prudent” dietary pattern is associated with lower obesity occurrence: modeling and mapping from a national nutrition survey. Nutr Res. 2023; 109:26–34. PMID: 36563432.28. Schulze MB, Manson JE, Ludwig DS, Colditz GA, Stampfer MJ, Willett WC, Hu FB. Sugar-sweetened beverages, weight gain, and incidence of type 2 diabetes in young and middle-aged women. JAMA. 2004; 292:927–934. PMID: 15328324.29. Volpe R, Cai X, Schroeter C, Mancino L. The effect of produce purchasing behavior on adult obesity and body weight: evidence from household-level scanner data. Agric Resour Econ Rev. 2019; 48:253–273.30. Clonan A, Roberts KE, Holdsworth M. Socioeconomic and demographic drivers of red and processed meat consumption: implications for health and environmental sustainability. Proc Nutr Soc. 2016; 75:367–373. PMID: 27021468.31. Ritzel C, Mann S. The old man and the meat: on gender differences in meat consumption across stages of human life. Foods. 2021; 10:2809. PMID: 34829090.32. Park EJ, Park MR. Influence of the healthy image of meat and animal products on preference and intake frequency. Korean J Food Cult. 2012; 27:1–11.33. Baek SH, Ham S, Yang IS. A cross-cultural comparison of fast food restaurant selection criteria between Korean and Filipino college students. Int J Hospit Manag. 2006; 25:683–698.34. Smith GD, Brunner E. Socio-economic differentials in health: the role of nutrition. Proc Nutr Soc. 1997; 56:75–90. PMID: 9168522.35. James WP, Nelson M, Ralph A, Leather S. Socioeconomic determinants of health. The contribution of nutrition to inequalities in health. BMJ. 1997; 314:1545–1549. PMID: 9183207.36. Pechey R, Monsivais P. Socioeconomic inequalities in the healthiness of food choices: exploring the contributions of food expenditures. Prev Med. 2016; 88:203–209. PMID: 27095324.37. Shim JS, Shim SY, Cha HJ, Kim J, Kim HC. Socioeconomic characteristics and trends in the consumption of ultra-processed foods in Korea from 2010 to 2018. Nutrients. 2021; 13:1120. PMID: 33805412.38. Lim H, Lee HJ, Choue R, Wang Y. Trends in fast-food and sugar-sweetened beverage consumption and their association with social environmental status in South Korea. J Acad Nutr Diet. 2018; 118:1228–1236.e1. PMID: 28988839.
- Full Text Links
-
- Actions
-
Cited
- CITED
-
- Close
- Share
-
- Similar articles
-
- The Association of Food Label Use with Objective and Subjective Obesity among a Korean Population
- Body Mass Index and Risk of Gastric Cancer in Asian Adults:A Meta-Epidemiological Meta-Analysis of Population-BasedCohort Studies
- Socioeconomic Costs of Overweight and Obesity in Korean Adults
- Food and Nutrient Consumption Patterns of Korean Adults Based on their Levels of Self Reported Stress
- Medical Expenditure Attributable to Overweight and Obesity in Adults with Hypertension, Diabetes and Dyslipidemia : Evidence from Korea National Health and Nutrition Examination Survey Data and Korea National Health Corporation Data
