A Prediction Model for Osteoporosis Risk Using a Machine-Learning Approach and Its Validation in a Large Cohort
- Affiliations
-
- 1Department of Bioconvergence, Hoseo University, Asan, Korea
- 2Department of Food and Nutrition, Obesity/Diabetes Research Center, Hoseo University, Asan, Korea
- KMID: 2542599
- DOI: http://doi.org/10.3346/jkms.2023.38.e162
Abstract
- Background
Osteoporosis develops in the elderly due to decreased bone mineral density (BMD), potentially increasing bone fracture risk. However, the BMD is not regularly measured in a clinical setting. This study aimed to develop a good prediction model for the osteoporosis risk using a machine learning (ML) approach in adults over 40 years in the Ansan/Anseong cohort and the association of predicted osteoporosis risk with a fracture in the Health Examinees (HEXA) cohort.
Methods
The 109 demographic, anthropometric, biochemical, genetic, nutrient, and lifestyle variables of 8,842 participants were manually selected in an Ansan/Anseong cohort and included in the ML algorithm. The polygenic risk score (PRS) of osteoporosis was generated with a genome-wide association study and added for the genetic impact of osteoporosis. Osteoporosis was defined with < −2.5 T scores of the tibia or radius compared to people in their 20s–30s. They were divided randomly into the training (n = 7,074) and test (n = 1,768) sets—Pearson’s correlation between the predicted osteoporosis risk and fracture in the HEXA cohort.
Results
XGBoost, deep neural network, and random forest generated the prediction model with a high area under the curve (AUC, 0.86) of the receiver operating characteristic (ROC) with 10, 15, and 20 features; the prediction model by XGBoost had the highest AUC of ROC, high accuracy and k-fold values (> 0.85) in 15 features among seven ML approaches. The model included the genetic factor, genders, number of children and breastfed children, age, residence area, education, seasons to measure, height, smoking status, hormone replacement therapy, serum albumin, hip circumferences, vitamin B6 intake, and body weight. The prediction models for women alone were similar to those for both genders, with lower accuracy. When the prediction model was applied to the HEXA study, the correlation between the fracture incidence and predicted osteoporosis risk was significant but weak (r = 0.173, P < 0.001).
Conclusion
The prediction model for osteoporosis risk generated by XGBoost can be applied to estimate osteoporosis risk. The biomarkers can be considered for enhancing the prevention, detection, and early therapy of osteoporosis risk in Asians.
Keyword
Figure
-
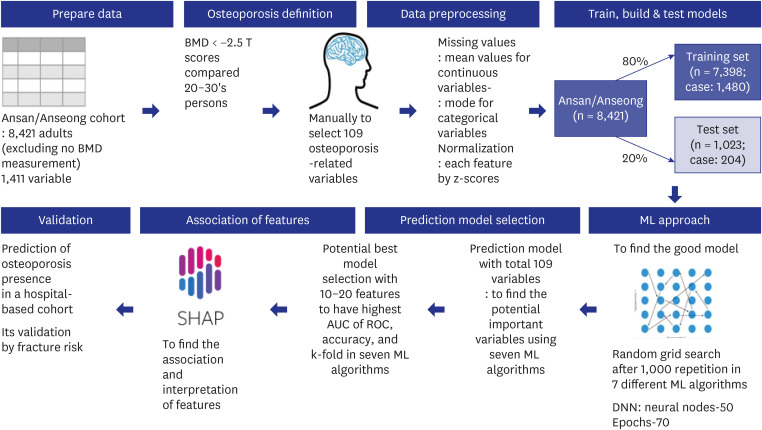
Fig. 1 Processing scheme for generating a prediction model of osteoporosis risk in the Ansan/Anseong cohort. The 8,421 adults measured with bone mineral density participated, and 109 variables were selected manually from 1,411 in the Ansan/Anseong cohort to predict the osteoporosis risk using the seven ML approach. Osteoporosis was defined as < −2.5 T scores of BMD in the tibia and wrist compared to the '20s–'30s. Missing data were filled with the mean and mode values for continuous and categorical variables, respectively. Data were normalized using the z-score. The prediction models for osteoporosis risk were generated using seven ML algorithms. The Ansan/Anseong cohort participants were divided randomly into a training set of 80% and a test set of 20% participants. The optimal model was selected with a random grid search after 1,000 repetitions in seven different ML algorithms, such as linear regression, support vector machines, XGBoost, decision tree, random forest, K-nearest neighbor, and DNN. The optimal prediction model was selected using the AUC of the ROC. The accuracy and k-fold cross-validation of the predicted models were assessed in the test set.BMD = bone mineral density, AUC = area under the curve, ROC = receiver operating characteristic, ML = machine learning, DNN = deep neural network.
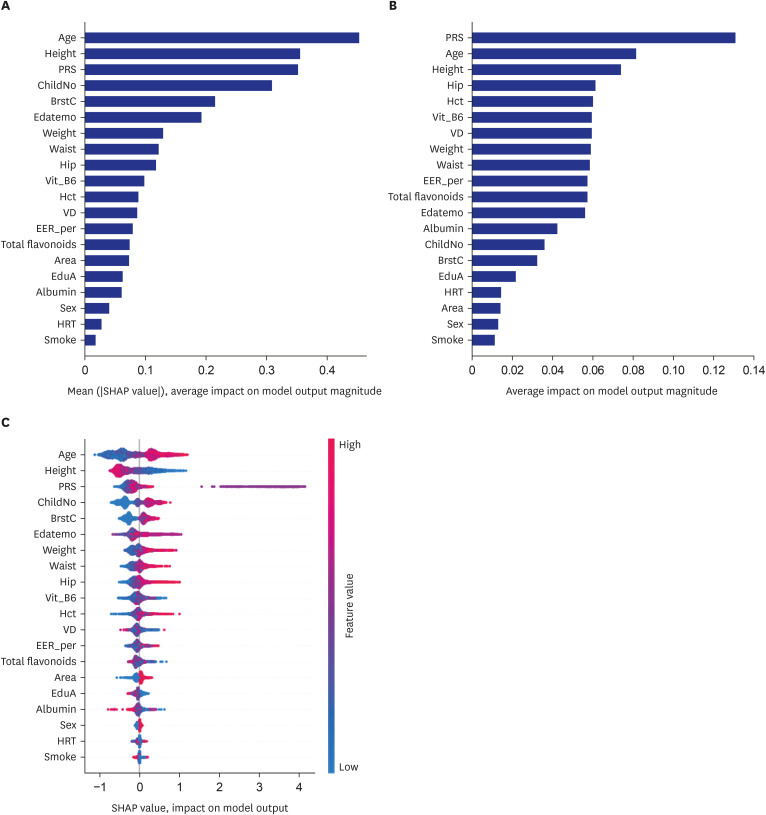
Fig. 2 The relative importance of the top 20 variables for predicting the osteoporosis risk, as determined by the XGBoost and random forest algorithms. (A) Osteoporosis prediction model by the XGBoost algorithm. (B) Osteoporosis prediction model by the random forest algorithm. (C) Explanation of the variables in the osteoporosis prediction model by the XGBoost algorithm.PRS = a polygenic risk score of 5 genetic variants explored for osteoporosis risk, ChildNo = the number of children, BrstC = the number of children who breastfed, Edatemo = the month of participating in the study, Waist = waist circumferences, Hip = hip circumferences, Vit_B6 = vitamin B6 intake, hematocrit, VD = vitamin D intake, EER_Per = the percentage of energy intake by estimated energy requirement, EduA = education level, HRT = the experience of hormone-replacement therapy.
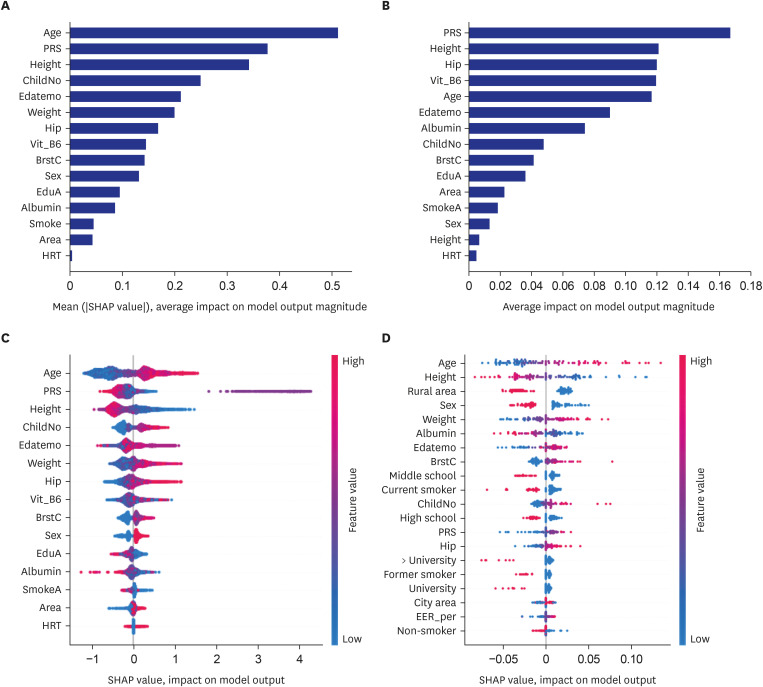
Fig. 3 The relative importance of the top 15 variables for predicting osteoporosis risk as determined by the XGBoost and random forest algorithms. (A) Osteoporosis prediction model using the XGBoost algorithm. (B) Osteoporosis prediction model using the random forest algorithm. (C) Explanation of the variables in the osteoporosis prediction model using the XGBoost algorithm. (D) Explanation of the variables in the osteoporosis prediction model using the deep neural network algorithm.PRS = a polygenic risk score of 5 genetic variants explored for osteoporosis risk, ChildNo = the number of children, BrstC = the number of children who breastfed, Edatemo = the month of participating in the study, Waist = waist circumferences, Hip = hip circumferences, Vit_B6 = vitamin B6 intake, hematocrit, VD = vitamin D intake, EER_Per = the percentage of energy intake by estimated energy requirement, EduA = education level, HRT = the experience of hormone-replacement therapy.
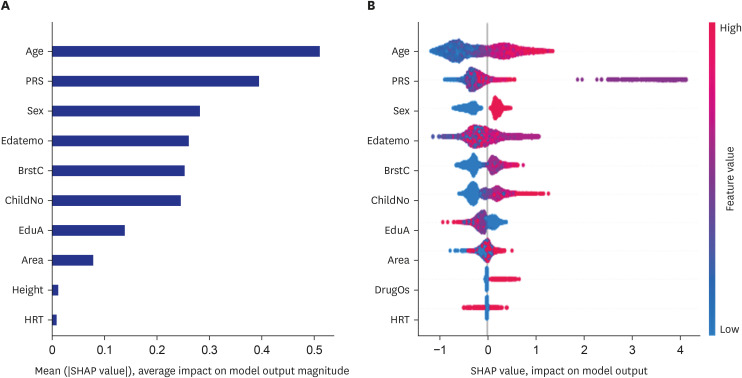
Fig. 4 The relative importance of the top 10 variables for predicting osteoporosis risk as determined by the XGBoost and random forest algorithms. (A) Osteoporosis prediction model using the XGBoost algorithm. (B) Explanation of the variables in the osteoporosis prediction model using the XGBoost algorithm.PRS = a polygenic risk score of 5 genetic variants explored for osteoporosis risk, ChildNo = the number of children, BrstC = the number of children who breastfed, Edatemo = the month of participating in the study, EduA = education level, DrugOS = Medication for osteoporosis, HRT = the experience of hormone-replacement therapy.
Reference
-
1. Park S, Daily JW, Song MY, Kwon HK. Gene-gene and gene-lifestyle interactions of AKAP11, KCNMA1, PUM1, SPTBN1, and EPDR1 on osteoporosis risk in middle-aged adults. Nutrition. 2020; 79-80:110859. PMID: 32619791.2. Sarafrazi N, Wambogo EA, Shepherd JA. Osteoporosis or low bone mass in older adults: United States, 2017–2018. NCHS Data Brief. 2021; 405(405):1–8.3. Wang Y, Tao Y, Hyman ME, Li J, Chen Y. Osteoporosis in China. Osteoporos Int. 2009; 20(10):1651–1662. PMID: 19415374.4. Ha Y. Epidemiology of osteoporosis in Korea. J Korean Med Assoc. 2016; 59(11):836–841.5. Yoo JE, Park HS. Prevalence and associated risk factors for osteoporosis in Korean men. Arch Osteoporos. 2018; 13(1):88. PMID: 30128890.6. Lee JH, Kim JH, Hong AR, Kim SW, Shin CS. Optimal body mass index for minimizing the risk for osteoporosis and type 2 diabetes. Korean J Intern Med. 2020; 35(6):1432–1442. PMID: 31564086.7. Park SJ, Jung JH, Kim MS, Lee HJ. High dairy products intake reduces osteoporosis risk in Korean postmenopausal women: a 4 year follow-up study. Nutr Res Pract. 2018; 12(5):436–442. PMID: 30323911.8. Park S, Kang S, Kim DS. Severe calcium deficiency increased visceral fat accumulation, down-regulating genes associated with fat oxidation, and increased insulin resistance while elevating serum parathyroid hormone in estrogen-deficient rats. Nutr Res. 2020; 73:48–57. PMID: 31841747.9. Kim SW, Lee HA, Cho EH. Low handgrip strength is associated with low bone mineral density and fragility fractures in postmenopausal healthy Korean women. J Korean Med Sci. 2012; 27(7):744–747. PMID: 22787368.10. Hou J, He C, He W, Yang M, Luo X, Li C. Obesity and bone health: a complex link. Front Cell Dev Biol. 2020; 8:600181. PMID: 33409277.11. Pouresmaeili F, Kamalidehghan B, Kamarehei M, Goh YM. A comprehensive overview on osteoporosis and its risk factors. Ther Clin Risk Manag. 2018; 14:2029–2049. PMID: 30464484.12. Greenbaum J, Lin X, Su KJ, Gong R, Shen H, Shen J, et al. Integration of the human gut microbiome and serum metabolome reveals novel biological factors involved in the regulation of bone mineral density. Front Cell Infect Microbiol. 2022; 12:853499. PMID: 35372129.13. Reel PS, Reel S, Pearson E, Trucco E, Jefferson E. Using machine learning approaches for multi-omics data analysis: a review. Biotechnol Adv. 2021; 49:107739. PMID: 33794304.14. Battineni G, Sagaro GG, Chinatalapudi N, Amenta F. Applications of machine learning predictive models in the chronic disease diagnosis. J Pers Med. 2020; 10(2):21. PMID: 32244292.15. Lee SK, Son YJ, Kim J, Kim HG, Lee JI, Kang BY, et al. Prediction model for health-related quality of life of elderly with chronic diseases using machine learning techniques. Healthc Inform Res. 2014; 20(2):125–134. PMID: 24872911.16. Rabbee N, Speed TP. A genotype calling algorithm for affymetrix SNP arrays. Bioinformatics. 2006; 22(1):7–12. PMID: 16267090.17. Zhu X, Bai W, Zheng H. Twelve years of GWAS discoveries for osteoporosis and related traits: advances, challenges and applications. Bone Res. 2021; 9(1):23. PMID: 33927194.18. Kim Y, Han BG. KoGES group. Cohort profile: the Korean Genome and Epidemiology Study (KoGES) consortium. Int J Epidemiol. 2017; 46(2):e20. PMID: 27085081.19. Ryan H, Trosclair A, Gfroerer J. Adult current smoking: differences in definitions and prevalence estimates--NHIS and NSDUH, 2008. J Environ Public Health. 2012; 2012:918368. PMID: 22649464.20. Olszynski WP, Adachi JD, Hanley DA, Davison KS, Brown JP. Comparison of speed of sound measures assessed by multisite quantitative ultrasound to bone mineral density measures assessed by dual-energy X-ray absorptiometry in a large canadian cohort: the Canadian Multicentre Osteoporosis Study (CaMos). J Clin Densitom. 2016; 19(2):234–241. PMID: 26050876.21. Rhee Y, Lee J, Jung JY, Lee JE, Park SY, Kim YM, et al. Modifications of T-scores by quantitative ultrasonography for the diagnosis of osteoporosis in Koreans. J Korean Med Sci. 2009; 24(2):232–236. PMID: 19399263.22. Park S, Daily JW, Zhang X, Jin HS, Lee HJ, Lee YH. Interactions with the MC4R rs17782313 variant, mental stress and energy intake and the risk of obesity in Genome Epidemiology Study. Nutr Metab (Lond). 2016; 13(1):38. PMID: 27213003.23. Park S, Ham JO, Lee BK. Effects of total vitamin A, vitamin C, and fruit intake on risk for metabolic syndrome in Korean women and men. Nutrition. 2015; 31(1):111–118. PMID: 25466654.24. Wu X, Park S. An inverse relation between hyperglycemia and skeletal muscle mass predicted by using a machine learning approach in middle-aged and older adults in large cohorts. J Clin Med. 2021; 10(10):2133. PMID: 34069247.25. Park S, Kim C, Wu X. Development and validation of an insulin resistance predicting model using a machine-learning approach in a population-based cohort in Korea. Diagnostics (Basel). 2022; 12(1):212. PMID: 35054379.26. Porter J, Varacallo M. Osteoporosis. Treasure Island, FL, USA: StatPearls Publishing;2022.27. Prior JC, Seifert-Klauss VR, Giustini D, Adachi JD, Kalyan S, Goshtasebi A. Estrogen-progestin therapy causes a greater increase in spinal bone mineral density than estrogen therapy - a systematic review and meta-analysis of controlled trials with direct randomization. J Musculoskelet Neuronal Interact. 2017; 17(3):146–154. PMID: 28860416.28. Cherukuri L, Kinninger A, Birudaraju D, Lakshmanan S, Li D, Flores F, et al. Effect of body mass index on bone mineral density is age-specific. Nutr Metab Cardiovasc Dis. 2021; 31(6):1767–1773. PMID: 33934946.29. Lee JH, Kim JH, Hong AR, Kim SW, Shin CS. Optimal body mass index for minimizing the risk for osteoporosis and type 2 diabetes. Korean J Intern Med. 2020; 35(6):1432–1442. PMID: 31564086.30. Kim DH, Lim H, Chang S, Kim JN, Roh YK, Choi MK. Association between body fat and bone mineral density in normal-weight middle-aged Koreans. Korean J Fam Med. 2019; 40(2):100–105. PMID: 30441887.31. Chen YY, Fang WH, Wang CC, Kao TW, Chang YW, Wu CJ, et al. Body fat has stronger associations with bone mass density than body mass index in metabolically healthy obesity. PLoS One. 2018; 13(11):e0206812. PMID: 30408060.32. Mikula AL, Hetzel SJ, Binkley N, Anderson PA. Validity of height loss as a predictor for prevalent vertebral fractures, low bone mineral density, and vitamin D deficiency. Osteoporos Int. 2017; 28(5):1659–1665. PMID: 28154943.33. Hwang IR, Choi YK, Lee WK, Kim JG, Lee IK, Kim SW, et al. Association between prolonged breastfeeding and bone mineral density and osteoporosis in postmenopausal women: KNHANES 2010-2011. Osteoporos Int. 2016; 27(1):257–265. PMID: 26373982.34. Oheim R, Tsourdi E, Seefried L, Beller G, Schubach M, Vettorazzi E, et al. Genetic diagnostics in routine osteological assessment of adult low bone mass disorders. J Clin Endocrinol Metab. 2022; 107(7):e3048–e3057. PMID: 35276006.35. Li X, Cheng J, Dong B, Yu X, Zhao X, Zhou Z. Common variants of the OPG gene are associated with osteoporosis risk: a meta-analysis. Genet Test Mol Biomarkers. 2021; 25(9):600–610. PMID: 34515523.36. Varenna M, Crotti C, Bonati MT, Zucchi F, Gallazzi M, Caporali R. A novel mutation in collagen gene COL1A2 associated with transient regional osteoporosis. Osteoporos Int. 2022; 33(1):299–303. PMID: 34463844.37. Tsai DJ, Fang WH, Wu LW, Tai MC, Kao CC, Huang SM, et al. The polymorphism at PLCB4 promoter (rs6086746) changes the binding affinity of RUNX2 and affects osteoporosis susceptibility: an analysis of bioinformatics-based case-control study and functional validation. Front Endocrinol (Lausanne). 2021; 12:730686. PMID: 34899595.38. Bogacz A, Gorska A, Kaminski A, Wolek M, Wolski H, Seremak-Mrozikiewicz A, et al. The importance of NFκB1 rs4648068 and RUNX2 rs7771980 polymorphisms in bone metabolism of postmenopausal Polish women. Ginekol Pol. Forthcoming. 2021; DOI: 10.5603/GP.a2021.0044.39. Wang J, Chen L, Zhang Y, Li CG, Zhang H, Wang Q, et al. Association between serum vitamin B6 concentration and risk of osteoporosis in the middle-aged and older people in China: a cross-sectional study. BMJ Open. 2019; 9(7):e028129.40. Li Z, Zhang S, Wan L, Song X, Yuan D, Zhang S, et al. Vitamin B6 as a novel risk biomarker of fractured ankles. Medicine (Baltimore). 2021; 100(40):e27442. PMID: 34622861.41. Nagayama Y, Ebina K, Tsuboi H, Hirao M, Hashimoto J, Yoshikawa H, et al. Low serum albumin concentration is associated with increased risk of osteoporosis in postmenopausal patients with rheumatoid arthritis. J Orthop Sci. 2022; 27(6):1283–1290. PMID: 34696921.42. Li L, Ge JR, Chen J, Ye YJ, Xu PC, Li JY. Association of bone mineral density with peripheral blood cell counts and hemoglobin in Chinese postmenopausal women: a retrospective study. Medicine (Baltimore). 2020; 99(28):e20906. PMID: 32664083.43. Valderrábano RJ, Lui LY, Lee J, Cummings SR, Orwoll ES, Hoffman AR, et al. Bone density loss is associated with blood cell counts. J Bone Miner Res. 2017; 32(2):212–220. PMID: 27653240.44. Mai HT, Tran TS, Ho-Le TP, Center JR, Eisman JA, Nguyen TV. Two-thirds of all fractures are not attributable to osteoporosis and advancing age: implications for fracture prevention. J Clin Endocrinol Metab. 2019; 104(8):3514–3520. PMID: 30951170.45. Leslie WD, Majumdar SR, Morin SN, Lix LM. Why does rate of bone density loss not predict fracture risk? J Clin Endocrinol Metab. 2015; 100(2):679–683. PMID: 25611114.
- Full Text Links
-
- Actions
-
Cited
- CITED
-
- Close
- Share
-
- Similar articles
-
- Machine Learning vs. Statistical Model for Prediction Modelling: Application in Medical Imaging Research
- Development and Validation of a Prediction Model: Application to Digestive Cancer Research
- Applications of Machine Learning in Bone and Mineral Research
- A Novel Point-of-Care Prediction Model for Steatotic Liver Disease: Expected Role of Mass Screening in the Global Obesity Crisis
- Diagnostic Accuracy of Machine Learning Algorithms for Hepatitis A Antibody
