J Korean Med Sci.
2022 Jul;37(27):e214. 10.3346/jkms.2022.37.e214.
Designing Infographics: Visual Representations for Enhancing Education, Communication, and Scientific Research
- Affiliations
-
- 1Department of Medicine, Section of Rheumatology, St. Luke’s Medical Center-Global City, Taguig, Philippines
- 2Department of Rheumatology, Royal Wolverhampton Hospitals NHS Trust, Wolverhampton, UK
- 3Department of Rheumatology, King’s College Hospital & Centre for Rheumatic Diseases, Division of Inflammation Biology, King’s College London, London, UK
- 4Division of Musculoskeletal and Dermatological Sciences, Centre for Musculoskeletal Research, School of Biological Sciences, The University of Manchester, Manchester, UK
- KMID: 2531252
- DOI: http://doi.org/10.3346/jkms.2022.37.e214
Abstract
- Infographics are graphic visual representations of educational content, used to deliver complex information, disseminate scientific research, and drive behavioral change. Herein, we review some of the factors pertinent to designing infographics and the potential for automation in the future. To guide high-impact design, it is vital to clearly define the objectives of the infographic and its target audience. Designing an effective infographic necessitates careful consideration of the layout, colors, font, and context. More recently, technical support to develop infographics are increasingly available through online software (Canva, Adobe, and Venngage) and emerging artificial intelligence programs. References can also become a visual representation of trends in scientific discovery. It is crucial for clinicians, researchers and scientists to have the knowledge and skills to design compelling infographics. In the era of social media, the uptake and effects of infographics for disseminating scientific research and public health education need to be further studied to understand their full potential.
Keyword
Figure
-
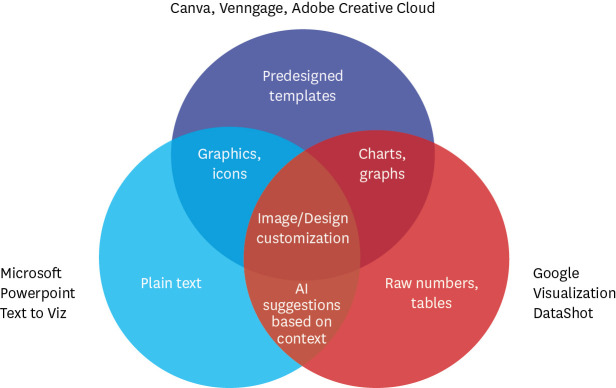
Fig. 1 Summary of design platforms and tools for infographics.AI = artificial Intelligence.
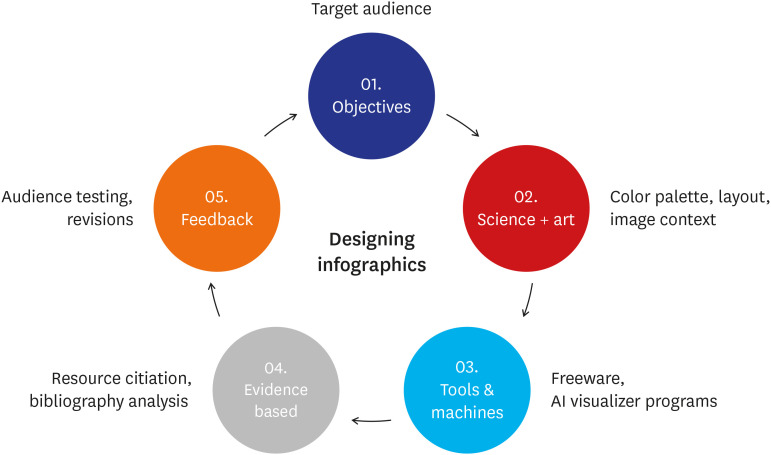
Fig. 2 Example of an infographic using Canva template emphasizing the key points of the manuscript.
Reference
-
1. Huang S, Martin LJ, Yeh CH, Chin A, Murray H, Sanderson WB, et al. The effect of an infographic promotion on research dissemination and readership: a randomized controlled trial. CJEM. 2018; 20(6):826–833. PMID: 30289098.
Article2. Oska S, Lerma E, Topf J. A picture is worth a thousand views: a triple crossover trial of visual abstracts to examine their impact on research dissemination. J Med Internet Res. 2020; 22(12):e22327. PMID: 33275112.
Article3. Joshi M, Gupta L. Preparing infographics for post-publication promotion of research on social media. J Korean Med Sci. 2021; 36(5):e41. PMID: 33527783.
Article4. Zimba O, Radchenko O, Strilchuk L. Social media for research, education and practice in rheumatology. Rheumatol Int. 2020; 40(2):183–190. PMID: 31863133.
Article5. Applequist J, Burroughs C, Ramirez A Jr, Merkel PA, Rothenberg ME, Trapnell B, et al. A novel approach to conducting clinical trials in the community setting: utilizing patient-driven platforms and social media to drive web-based patient recruitment. BMC Med Res Methodol. 2020; 20(1):58. PMID: 32169041.
Article6. Salvy SJ, Carandang K, Vigen CL, Concha-Chavez A, Sequeira PA, Blanchard J, et al. Effectiveness of social media (Facebook), targeted mailing, and in-person solicitation for the recruitment of young adult in a diabetes self-management clinical trial. Clin Trials. 2020; 17(6):664–674. PMID: 32627589.
Article7. Shadyab AH, LaCroix AZ, Feldman HH, van Dyck CH, Okonkwo OC, Tam SP, et al. Recruitment of a multi-site randomized controlled trial of aerobic exercise for older adults with amnestic mild cognitive impairment: the EXERT trial. Alzheimers Dement. 2021; 17(11):1808–1817. PMID: 34297895.
Article8. Hughes AJ, McQuail P, Keogh P, Synnott K. Infographics improve comprehension and recall at the orthopedic journal club. J Surg Educ. 2021; 78(4):1345–1349. PMID: 33214098.
Article9. Shanks JD, Izumi B, Sun C, Martin A, Byker Shanks C. Teaching undergraduate students to visualize and communicate public health data with infographics. Front Public Health. 2017; 5:315. PMID: 29226120.
Article10. Carmody S, Ahmad I, Gouttebarge V, Malhotra A, Glover D, Massey A. Infographic. Football-specific strategies to reduce COVID-19 transmission. Br J Sports Med. 2020; 54(22):1362–1364. PMID: 32788295.
Article11. Bakhtiar R, Hilda H, Duma K, Yudia RC. Relationship between understanding of COVID-19’s infographics and the efforts to prevent COVID-19 transmission. J Community Empowerment Health. 2020; 3(2):67–76.
Article12. Egan M, Acharya A, Sounderajah V, Xu Y, Mottershaw A, Phillips R, et al. Evaluating the effect of infographics on public recall, sentiment and willingness to use face masks during the COVID-19 pandemic: a randomised internet-based questionnaire study. BMC Public Health. 2021; 21(1):367. PMID: 33596857.
Article13. Jerome C, Ting SH, Podin Y. Getting the message across: examining Malaysia’s COVID-19 public service announcement (PSA) infographics. Int J Bus Soc. 2021; 22(1):194–212.
Article14. Domgaard S, Park M. Combating misinformation: the effects of infographics in verifying false vaccine news. Health Educ J. 2021; 80(8):974–986.
Article15. Li N, Molder AL. Can scientists use simple infographics to convince? Effects of the “flatten the curve” charts on perceptions of and behavioral intentions toward social distancing measures during the COVID-19 pandemic. Public Underst Sci. 2021; 30(7):898–912. PMID: 34448434.
Article16. Arcia A, Suero-Tejeda N, Bales ME, Merrill JA, Yoon S, Woollen J, et al. Sometimes more is more: iterative participatory design of infographics for engagement of community members with varying levels of health literacy. J Am Med Inform Assoc. 2016; 23(1):174–183. PMID: 26174865.
Article17. McCrorie AD, Donnelly C, McGlade KJ. Infographics: healthcare communication for the digital age. Ulster Med J. 2016; 85(2):71–75. PMID: 27601757.18. Creative Commons. What we do. Updated 2021. Accessed October 1, 2021. https://creativecommons.org/about .19. Dorneles LL, Martins VD, Morelato CS, Goes FD, Fonseca LM, Camargo RA. Development of an animated infographic on permanent health education. Rev Lat Am Enfermagem. 2020; 28:e3311. PMID: 32696922.
Article20. Gupta R, Joshi M, Gupta L. An integrated guide for designing video abstracts using freeware and their emerging role in academic research advancement. J Korean Med Sci. 2021; 36(9):e66. PMID: 33686811.
Article21. Stones C, Gent M. Principles of Public Health Infographic Design. Leeds: University of Leeds, Public Health England;2015.22. Khoury CK, Kisel Y, Kantar M, Barber E, Ricciardi V, Klirs C, et al. Science-graphic art partnerships to increase research impact. Commun Biol. 2019; 2(1):295. PMID: 31396575.
Article23. Canva. About Canva. Updated 2021. Accessed October 1, 2021. https://canva.com/about .24. Adobe Creative Cloud. Adobe express. Updated 2022. Accessed April 4, 2022. https://www.adobe.com/express/ .25. Venngage. Venngage masterclass. Updated 2021. Accessed October 1, 2021. https://venngage.com/blog/masterclass .26. Microsoft. Powerpoint AI gets an upgrade and surpasses major milestone of 1 billion slides. Updated 2019. Accessed October 14, 2021. https://www.microsoft.com/en-us/microsoft-365/blog/2019/06/18/powerpoint-ai-upgrade-designer-major-milestone-1-billion-slides/ .27. Cui W, Zhang X, Wang Y, Huang H, Chen B, Fang L, et al. Text-to-Viz: automatic generation of infographics from proportion-related natural language statements. IEEE Trans Vis Comput Graph. 2020; 26(1):906–916. PMID: 31478860.
Article28. Google. Google visualization API reference. Updated 2021. Accessed September 27, 2021. https://developers.google.com/chart/interactive/docs/reference .29. Wang Y, Sun Z, Zhang H, Cui W, Xu K, Ma X, et al. DataShot: automatic generation of fact sheets from tabular data. IEEE Trans Vis Comput Graph. 2020; 26(1):895–905. PMID: 31425110.
Article30. Jahan S, Al-Saigul AM, Alharbi AM. Assessment of health education infographics in Saudi Arabia. Health Educ J. 2021; 80(1):3–15.
Article31. Kunze KN, Vadhera A, Purbey R, Singh H, Kazarian GS, Chahla J. Infographics are more effective at increasing social media attention in comparison with original research articles: an altmetrics-based analysis. Arthroscopy. 2021; 37(8):2591–2597. PMID: 33838252.
Article32. Assadi R, Gasparyan AY. Editing, publishing, and aggregating video articles: Do we need a scholarly approach? J Korean Med Sci. 2015; 30(9):1211–1212. PMID: 26339158.
Article33. Wang AT, Sandhu NP, Wittich CM, Mandrekar JN, Beckman TJ. Using social media to improve continuing medical education: a survey of course participants. Mayo Clin Proc. 2012; 87(12):1162–1170. PMID: 23141117.
Article34. Saud S, Traboco L, Gupta L. Harnessing the true power of altmetrics to track engagement. J Korean Med Sci. 2021; 36(48):e330. PMID: 34904408.
Article35. VOSviewer. Welcome to VOSviewer. Updated 2021. Accessed September 25, 2021. https://vosviewer.com .36. Connected Papers. About. Updated 2021. Accessed October 2, 2021. https://www.connectedpapers.com/about .37. Open Knowledge Maps. About. Updated 2021. Accessed September 24, 2021. https://openknowledgemaps.org/about .
- Full Text Links
-
- Actions
-
Cited
- CITED
-
- Close
- Share
-
- Similar articles
-
- Preparing Infographics for Postpublication Promotion of Research on Social Media
- Teaching and Learning Communication Skills in Medical Education
- Development of a Jigsaw-based Maker Educational Model for Enhancing Sharing, Communication Competence and Digital Literacy
- The development and effects of a medical communication skills program for medical school students
- Qualitative Research on Communication Education of Dental Hygienist by Focus Group Interview
