J Korean Med Sci.
2021 Feb;36(5):e41. 10.3346/jkms.2021.36.e41.
Preparing Infographics for Postpublication Promotion of Research on Social Media
- Affiliations
-
- 1Byramjee Jeejeebhoy Government Medical College and Sassoon General Hospitals, Pune, India
- 2Department Clinical Immunology and Rheumatology, Sanjay Gandhi Postgraduate Institute of Medical Sciences, Lucknow, India
- KMID: 2512463
- DOI: http://doi.org/10.3346/jkms.2021.36.e41
Abstract
- Infographics are pictorial representations of information intended to disseminate information quickly and clearly. Their use has increased in the past decade due to wider and easy access to technology. Infographics are being increasingly used for public advisories, disseminating protocols for healthcare professionals, and post-publication promotion of research. Due to their potential to rapidly reach a vast audience, these have gained larger importance during the coronavirus disease 2019 pandemic. Two key aspects determine the quality of infographics, content and visual appeal. In this brief, the authors attempt to delineate the key aspects of designing an infographic, and the freeware that they may have at their disposal for creating informative, appealing, and useful infographics.
Keyword
Figure
-
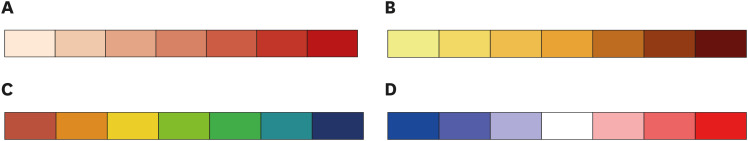
Fig. 1 Types of colour schemes (A) Monochrome Sequential Colour Scheme. (B) Part-spectral Sequential Colour. (C) Divergent Colour Scheme. (D) Spectral Colour Scheme.
Cited by 2 articles
-
Modern Health Journalism and the Impact of Social Media
Keya Ganatra, Armen Yuri Gasparyan, Latika Gupta
J Korean Med Sci. 2021;36(22):e162. doi: 10.3346/jkms.2021.36.e162.Designing Infographics: Visual Representations for Enhancing Education, Communication, and Scientific Research
Lisa Traboco, Haridha Pandian, Elena Nikiphorou, Latika Gupta
J Korean Med Sci. 2022;37(27):e214. doi: 10.3346/jkms.2022.37.e214.
Reference
-
1. Huang S, Martin LJ, Yeh CH, Chin A, Murray H, Sanderson WB, et al. The effect of an infographic promotion on research dissemination and readership: a randomized controlled trial. CJEM. 2018; 20(6):826–833. PMID: 30289098.
Article2. Chan AK, Nickson CP, Rudolph JW, Lee A, Joynt GM. Social media for rapid knowledge dissemination: early experience from the COVID-19 pandemic. Anaesthesia. 2020; 75(12):1579–1582. PMID: 32227594.3. Haldule S, Davalbhakta S, Agarwal V, Gupta L, Agarwal V. Post-publication promotion in rheumatology: a survey focusing on social media. Rheumatol Int. 2020; 40(11):1865–1872. PMID: 32920728.
Article4. Pferschy-Wenzig EM, Pferschy U, Wang D, Mocan A, Atanasov AG. Does a graphical abstract bring more visibility to your paper? Molecules. 2016; 21(9):1247.
Article5. Tafur A, Bikdeli B, Weinberg I, Jimenez D, Monreal A, Barba R, et al. Real-time dissemination of aggregate data on presentation and outcomes of patients with venous thromboembolism: the RIETE infographics project. Clin Appl Thromb Hemost. 2020; 26:1076029620931200. PMID: 32936691.
Article6. Steele RJ, Digby J, Chambers JA, O'Carroll RE. The impact of personalised risk information compared to a positive/negative result on informed choice and intention to undergo colonoscopy following colorectal Cancer screening in Scotland (PERICCS) - a randomised controlled trial: study protocol. BMC Public Health. 2019; 19(1):411. PMID: 30991987.
Article7. Hamaguchi R, Nematollahi S, Minter DJ. Picture of a pandemic: visual aids in the COVID-19 crisis. J Public Health (Oxf). 2020; 42(3):483–485. PMID: 32880394.
Article8. Löllgen H, Bachl N, Papadopoulou T, Shafik A, Holloway G, Vonbank K, et al. Infographic. Clinical recommendations for return to play during the COVID-19 pandemic. Br J Sports Med. Forthcoming. 2020; DOI: 10.1136/bjsports-2020-102985.
Article9. Carmody S, Ahmad I, Gouttebarge V, Malhotra A, Glover D, Massey A. Infographic. Football-specific strategies to reduce COVID-19 transmission. Br J Sports Med. 2020; 54(22):1362–1364. PMID: 32788295.
Article10. Fitzpatrick J, Castricum A, Seward H, Tulloh L, Dawson E. Infographic. COFIT-19: let's get moving through the COVID-19 pandemic! Br J Sports Med. 2020; 54(22):1360–1361. PMID: 32561519.
Article11. Bongers CC, de Korte JQ, Catoire M, Greefhorst J, Hopman MTE, Kingma B, et al. Infographic. Cooling strategies to attenuate PPE-induced heat strain during the COVID-19 pandemic. Br J Sports Med. 2020; 55(1):69–70. PMID: 32522736.
Article12. Go BC, Brewster R, Patel R, Rajasekaran K. Using telemedicine and infographics for physician-guided home drain removal. OTO Open. 2020; 4(2):2473974X2093356.
Article13. Buljan I, Malički M, Wager E, Puljak L, Hren D, Kellie F, et al. No difference in knowledge obtained from infographic or plain language summary of a Cochrane systematic review: three randomized controlled trials. J Clin Epidemiol. 2018; 97(6):86–94. PMID: 29269021.
Article14. McCandless D. “The beauty of data visualization” - TEDGlobal 2010. Updated 2010. Accessed September 27, 2020. https://www.ted.com/talks/david_mccandless_the_beauty_of_data_visualization.15. Krum R. Cool Infographics: Effective Communication with Data Visualization and Design. 1st ed. Hoboken, NJ: John Wiley & Sons;2013.16. Smiciklas M. The Power of Infographics: Using Pictures to Communicate and Connect with Your Audiences. 1st ed. Indianapolis, IN: Que Publishing;2012.17. Graphic Organizers. A review of scientifically based research, The Institute for the Advancement of Research in Education at AEL. Updated 2016. Accessed September 27, 2020. http://www.inspiration.com/sites/default/files/documents/Detailed-Summary.pdf.18. Lyra KT, Isotani S, Reis RC, Marques LB, Pedro LZ, Jaques PA, et al. Infographics or Graphics+Text: Which material is best for robust learning? Updated 2016. Accessed December 18, 2020. https://arxiv.org/ftp/arxiv/papers/1605/1605.09170.pdf.19. Dunlap JC, Lowenthal PR. Getting graphic about infographics: design lessons learned from popular infographics. J Vis Lit. 2016; 35(1):42–59.
Article20. Krauss J. Infographics: more than words can say. Learn Lead Technol. 2012; 39(5):10–14.21. Martin LJ, Turnquist A, Groot B, Huang SY, Kok E, Thoma B, et al. Exploring the role of infographics for summarizing medical literature. Health Prof Educ. 2019; 5(1):48–57.
Article22. Ebrahimabadi M, Rezaei K, Moini A, Fournier A, Abedi A. Infographics or video; which one is more effective in asthmatic patients' health? A randomized clinical trial. J Asthma. 2019; 56(12):1306–1313. PMID: 30395745.
Article23. Royal KD, Erdmann KM. Evaluating the readability levels of medical infographic materials for public consumption. J Vis Commun Med. 2018; 41(3):99–102. PMID: 29987964.
Article24. Olfert MD, Hagedorn RL, Barr ML, Famodu OA, Rubino JM, White JA. eB4CAST: an evidence-based tool to promote dissemination and implementation in community-based, public health research. Int J Environ Res Public Health. 2018; 15(10):2142.
Article25. Wolpin S, Halpenny B, Sorrentino E, Stewart M, McReynolds J, Cvitkovic I, et al. Usability testing the personal patient profile-prostate in a sample of African American and Hispanic men. Comput Inform Nurs. 2016; 34(7):288–296. PMID: 27081755.
Article26. Oliffe M, Thompson E, Johnston J, Freeman D, Bagga H, Wong PK. Assessing the readability and patient comprehension of rheumatology medicine information sheets: a cross-sectional Health Literacy Study. BMJ Open. 2019; 9(2):e024582.
Article27. Kiernan M, Oppezzo MA, Resnicow K, Alexander GL. Effects of a methodological infographic on research participants' knowledge, transparency, and trust. Health Psychol. 2018; 37(8):782–786. PMID: 30024233.
Article28. Balkac M, Ergun E. Role of infographics in healthcare. Chin Med J (Engl). 2018; 131(20):2514–2517. PMID: 30334544.
Article29. Adams D. What are infographics and why are they important? Updated March 25, 2011. Accessed December 18, 2020. http://www.instantshift.com/2011/03/25/what-are-infographics-and-why-are-they-important/.30. Ferreira J. Introduction to Infographics. Updated August 2, 2014. Accessed December 18, 2020. https://www.academia.edu/8124962/Infographics_An_Introduction.31. Murray IR, Murray AD, Wordie SJ, Oliver CW, Simpson AH, Haddad FS. What surgeons need to know about infographics. Bone Joint J. 2017; 99B(12):1559–1560.
Article32. Lankow J, Ritchie J, Crooks R. Infographics: the Power of Visual Storytelling. Hoboken, NJ: John Wiley & Sons;2012.33. Davidson R. Using infographics in the science classroom. Sci Teach. 2014; 81(3):34–39.
Article34. McCrorie AD, Donnelly C, McGlade KJ. Infographics: healthcare communication for the digital age. Ulster Med J. 2016; 85(2):71–75. PMID: 27601757.35. Color Hunt. Color palettes for designers and artists. Updated 2020. Accessed September 27, 2020. https://colorhunt.co/.36. Enquist M, Arak A. Symmetry, beauty and evolution. Nature. 1994; 372(6502):169–172. PMID: 7969448.
Article37. Chen Z, Wang Y, Wang Q, Wang Y, Qu H. Towards automated infographic design: Deep learning-based auto-extraction of extensible timeline. IEEE Trans Vis Comput Graph. 2020; 26(1):917–926. PMID: 31443028.
Article38. Newsom D, Haynes J. Public Relations Writing: Form and Style. 10th ed. Boston, MA: Cengage Learning;2004.39. Brigham TJ. Feast for the eyes: an introduction to data visualization. Med Ref Serv Q. 2016; 35(2):215–223. PMID: 27054537.
Article40. Dowling S, Hair H, Boudreau D, Grigat D, Rice C, Born KB, et al. A patient-focused information design intervention to support the minor traumatic brain injuries (mTBI) choosing wisely canada recommendation. Cureus. 2019; 11(10):e5877. PMID: 31763100.
Article41. Vitzthum von Eckstaedt H 5th, Kitts AB, Swanson C, Hanley M, Krishnaraj A. Patient-centered radiology reporting for lung cancer screening. J Thorac Imaging. 2020; 35(2):85–90. PMID: 31913258.42. Brotto LA, Nelson M, Barry L, Maher C. #ItsNotInYourHead: a social media campaign to disseminate information on provoked vestibulodynia. Arch Sex Behav. Forthcoming. 2020.
Article43. Nobles AL, Leas EC, Latkin CA, Dredze M, Strathdee SA, Ayers JW. #HIV: alignment of HIV-related visual content on instagram with public health priorities in the US. AIDS Behav. 2020; 24(7):2045–2053. PMID: 31916098.
Article44. Scott H, Fawkner S, Oliver C, Murray A. Why healthcare professionals should know a little about infographics. Br J Sports Med. 2016; 50(18):1104–1105. PMID: 27317791.
Article45. Waye KM, Yedinak JL, Koziol J, Marshall BD. Action-focused, plain language communication for overdose prevention: a qualitative analysis of Rhode Island's overdose surveillance and information dashboard. Int J Drug Policy. 2018; 62(12):86–93. PMID: 30384027.
Article46. Kern-Goldberger AS, Hill-Ricciuti AC, Zhou JJ, Savant AP, Rugg L, Dozor AJ, et al. Perceptions of safety monitoring in CF clinical studies and potential impact on future study participation. J Cyst Fibros. 2019; 18(4):530–535. PMID: 31151855.
Article47. Applequist J, Burroughs C, Ramirez A Jr, Merkel PA, Rothenberg ME, Trapnell B, et al. A novel approach to conducting clinical trials in the community setting: utilizing patient-driven platforms and social media to drive web-based patient recruitment. BMC Med Res Methodol. 2020; 20(1):58. PMID: 32169041.
Article48. Lake F. Introducing graphical and video abstracts. Biotechniques. 2018; 65(4):179. PMID: 30284933.
Article49. Silverstein T, Cutler-Stamm J, Tucker D, Stein LP, Sklar D, Blackheart J, et al. Automated presentation of information using infographics. Updated 2015. Accessed September 27, 2020. https://patentscope.wipo.int/search/en/detail.jsf?docId=US222925161&docAn=15917058.
- Full Text Links
-
- Actions
-
Cited
- CITED
-
- Close
- Share
-
- Similar articles
-
- Designing Infographics: Visual Representations for Enhancing Education, Communication, and Scientific Research
- Social Media Mining Toolkit (SMMT)
- Social Media in Clinical Practice
- Influence on Health Promotion Behavior among Government-funded Research Institute's Employee according to Perceptive Health Status and Social Support
- Subconscious Learning via Games and Social Media
