Strain-Specific Differences in House Dust Mite (Dermatophagoides farinae)-Induced Mouse Models of Allergic Rhinitis
- Affiliations
-
- 1Department of Otorhinolaryngology-Head and Neck Surgery, Dankook University College of Medicine, Cheonan, Korea
- 2Department of Otorhinolaryngology-Head and Neck Surgery, Konyang University College of Medicine, Daejeon, Korea
- 3Beckman Laser Institute Korea, Dankook University College of Medicine, Cheonan, Korea
- KMID: 2508516
- DOI: http://doi.org/10.21053/ceo.2019.01837
Abstract
Objectives
. Limited information is available regarding strain-related differences in mouse models of allergic rhinitis induced by Dermatophagoides farinae (Der f1). In this study, we compared differences between two mouse strains and determined the optimal dose of Der f1 for allergic rhinitis mouse models.
Methods
. Forty-eight mice were assigned to the following six groups (n=8 per group): group A (control, BALB/c), group B (Der f1-sensitized BALB/c, 25 µg), group C (Der f1-sensitized BALB/c, 100 µg), group D (control, C57BL/6), group E (Der f1-sensitized C57BL/6, 25 µg), and group F (Der f1-sensitized C57BL/6, 100 µg). Allergic inflammation was induced with Der f1 and alum sensitization, followed by an intranasal challenge with Der f1. Rubbing and sneezing scores, eosinophil and neutrophil infiltration, and immunoglobulin, cytokine, and chemokine levels in the nasal mucosa and from splenocyte cultures were assessed.
Results
. Rubbing and sneezing scores were higher in groups B, C, E, and F than in groups A and D, with a similar pattern in both strains (i.e., group B vs. E and group C vs. F). Serum immunoglobulin levels were significantly elevated compared to the control in groups B and C, but not in groups E and F. Eosinophil and neutrophil infiltration increased (all P<0.05) after the Der f1 challenge (groups B, C, E, and F) compared to the control (groups A and D) in both the BALB/c and C57BL/6 strains, without any significant difference between the two strains (group A vs. D, group B vs. E, and group C vs. F) (P>0.05). BALB/c mice (group B) showed a greater elevation of splenic interleukin (IL)-4 (P<0.01), IL-5 (P<0.01), and IL-6 levels (P<0.05) and nasal IL-4 mRNA levels (P<0.001) than the C57BL/6 mice (group E). Interestingly, mice treated with 100 µg Der f1 showed a weaker allergic response than those treated with 25 µg.
Conclusion
. We found 25 µg to be a more appropriate dose for Der f1 sensitization. BALB/c mice are more biased toward a Th2 response and are a more suitable model for allergic rhinitis than C57BL/6 mice. This study provides information on the appropriate choice of a mouse model for allergic rhinitis.
Figure
-
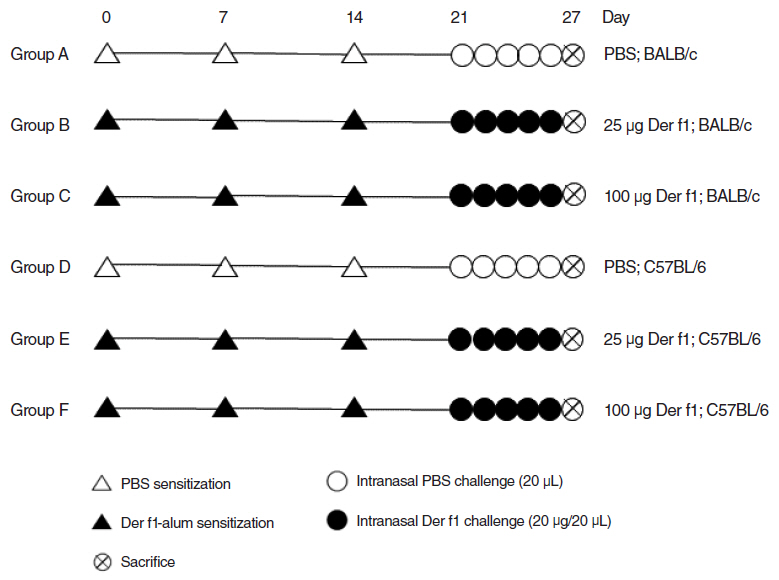
Fig. 1. Experimental protocol. Group A, control group of BALB/c mice; Group B, BALB/c mice exposed to 25 µg of Dermatophagoides farinae (Der f1); Group C, BALB/c mice exposed to 100 µg of Der f1; Group D, control group of C57BL/6 mice; Group E, C57BL/6 mice exposed to 25 µg of Der f1; Group F, C57BL/6 mice exposed to 100 µg of Der f1; PBS, phosphate buffered saline.

Fig. 2. Rubbing and sneezing counts. Control group of BALB/c mice (group A), BALB/c mice exposed to 25 µg of Dermatophagoides farinae (Der f1; group B), BALB/c mice exposed to 100 µg of Der f1 (group C), control group of C57BL/6 mice (group D), C57BL/6 mice exposed to 25 µg of Der f1 (group E), and C57BL/6 mice exposed to 100 µg of Der f1 (group F). Bars represent standard error. Significantly different from control mice, *P<0.05.

Fig. 3. Serum immunoglobulin (Ig) levels. (A) Total IgE levels from serum. (B) Der f1-specific IgE levels from serum. (C) Der f1-specific IgG1 levels from serum. (D) Der f1-specific IgG2a levels from serum. Control group of BALB/c mice (group A), BALB/c mice exposed to 25 µg of Dermatophagoides farinae (Der f1; group B), BALB/c mice group exposed to 100 µg of Der f1 (group C), control group of C57BL/6 mice (group D), C57BL/6 mice exposed to 25 µg of Der f1 (group E), and C57BL/6 mice exposed to 100 µg of Der f1 (group F). Bars represent standard error. Significantly different from control mice or significantly different between strains, *P<0.05, **P<0.01, ***P<0.001.
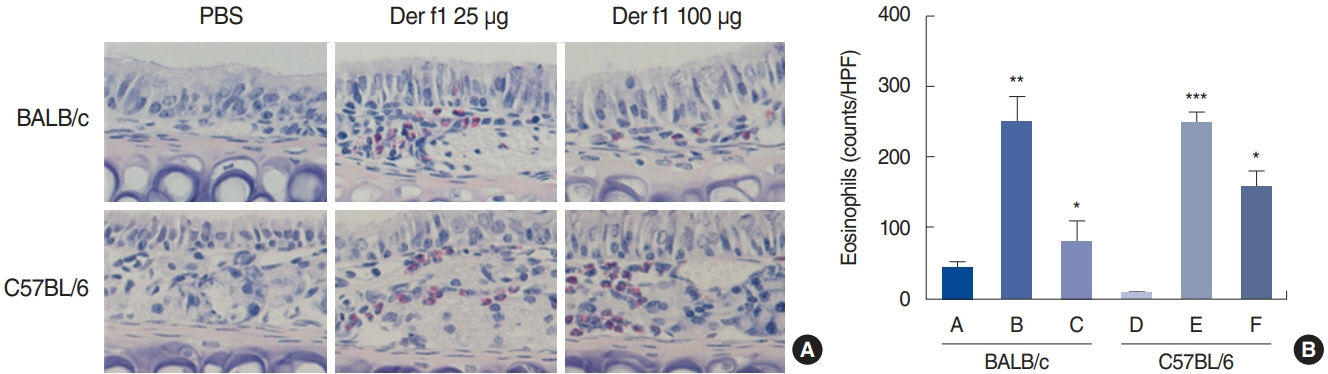
Fig. 4. Eosinophil infiltration in the nasal mucosa. (A) Representative microphotographs (×400), and (B) quantitative analyses of eosinophil infiltration in the nasal mucosa. The panels show Sirius Red staining (×400). Control group of BALB/c mice (group A), BALB/c mice exposed to 25 µg of Dermatophagoides farinae (Der f1; group B), BALB/c mice group exposed to 100 µg of Der f1 (group C), control group of C57BL/6 mice (group D), C57BL/6 mice exposed to 25 µg of Der f1 (group E), and C57BL/6 mice exposed to 100 µg of Der f1 (group F). PBS, phosphate buffered saline; HPF, high-power field. Bars represent standard error. Significantly different from control mice, *P<0.05, **P<0.01, ***P<0.001.
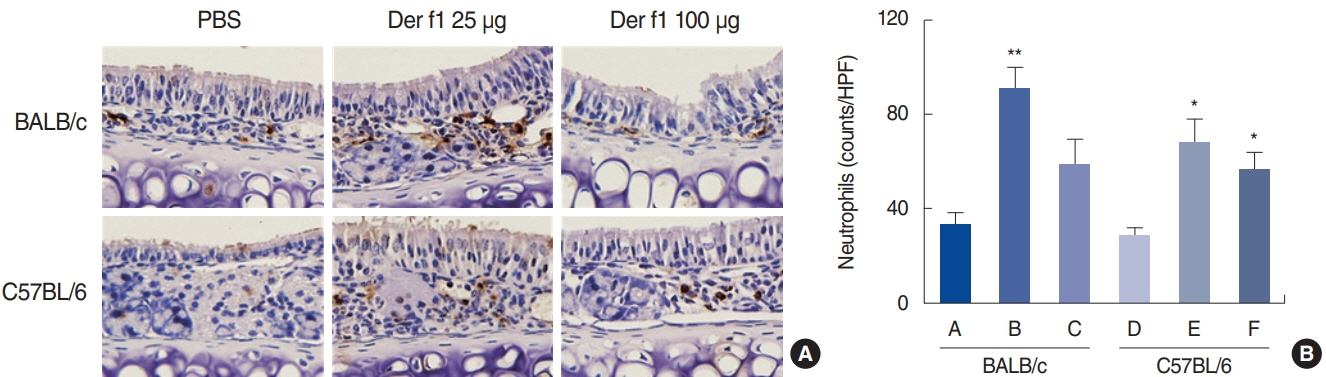
Fig. 5. Infiltration of neutrophils in the nasal mucosa. The panels show immunohistochemical findings for neutrophils (×400). Control group of BALB/c mice (group A), BALB/c mice exposed to 25 µg of Dermatophagoides farinae (Der f1; group B), BALB/c mice group exposed to 100 µg of Der f1 (group C), control group of C57BL/6 mice (group D), C57BL/6 mice exposed to 25 µg of Der f1 (group E), and C57BL/6 mice exposed to 100 µg of Der f1 (group F). PBS, phosphate buffered saline; HPF, high-power field. Bars represent standard error. Significantly different from control mice, *P<0.05, **P<0.01.
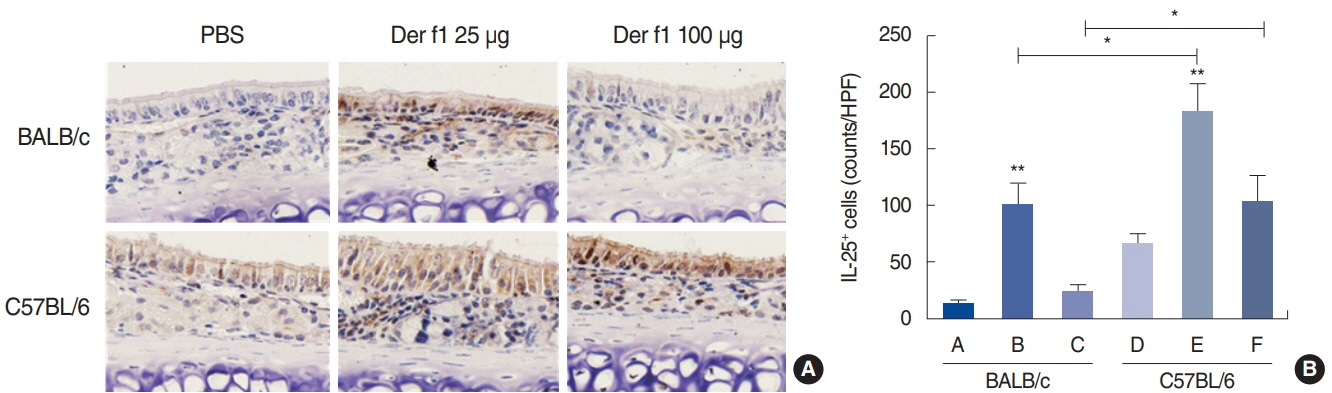
Fig. 6. Expression of interleukin (IL)-25 in the nasal mucosa. The panels show immunohistochemical findings for IL-25 (×400). Control group of BALB/c mice (group A), BALB/c mice exposed to 25 µg of Dermatophagoides farinae (Der f1; group B), BALB/c mice group exposed to 100 µg of Der f1 (group C), control group of C57BL/6 mice (group D), C57BL/6 mice exposed to 25 µg of Der f1 (group E), and C57BL/6 mice exposed to 100 µg of Der f1 (group F). PBS, phosphate buffered saline; HPF, high-power field. Bars represent standard error. Significantly different from control mice or significantly different between strains, *P< 0.05, **P< 0.01.
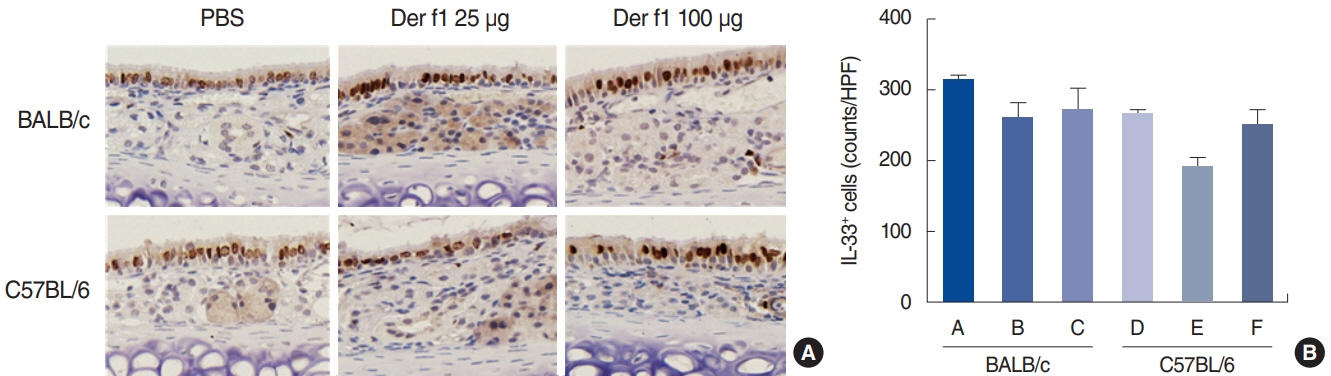
Fig. 7. Expression of interleukin (IL)-33 in the nasal mucosa. The panels show immunohistochemical findings for IL-33 (×400). Control group of BALB/c mice (group A), BALB/c mice exposed to 25 µg of Dermatophagoides farinae (Der f1; group B), BALB/c mice group exposed to 100 µg of Der f1 (group C), control group of C57BL/6 mice (group D), C57BL/6 mice exposed to 25 µg of Der f1 (group E), and C57BL/6 mice exposed to 100 µg of Der f1 (group F). PBS, phosphate buffered saline; HPF, high-power field.
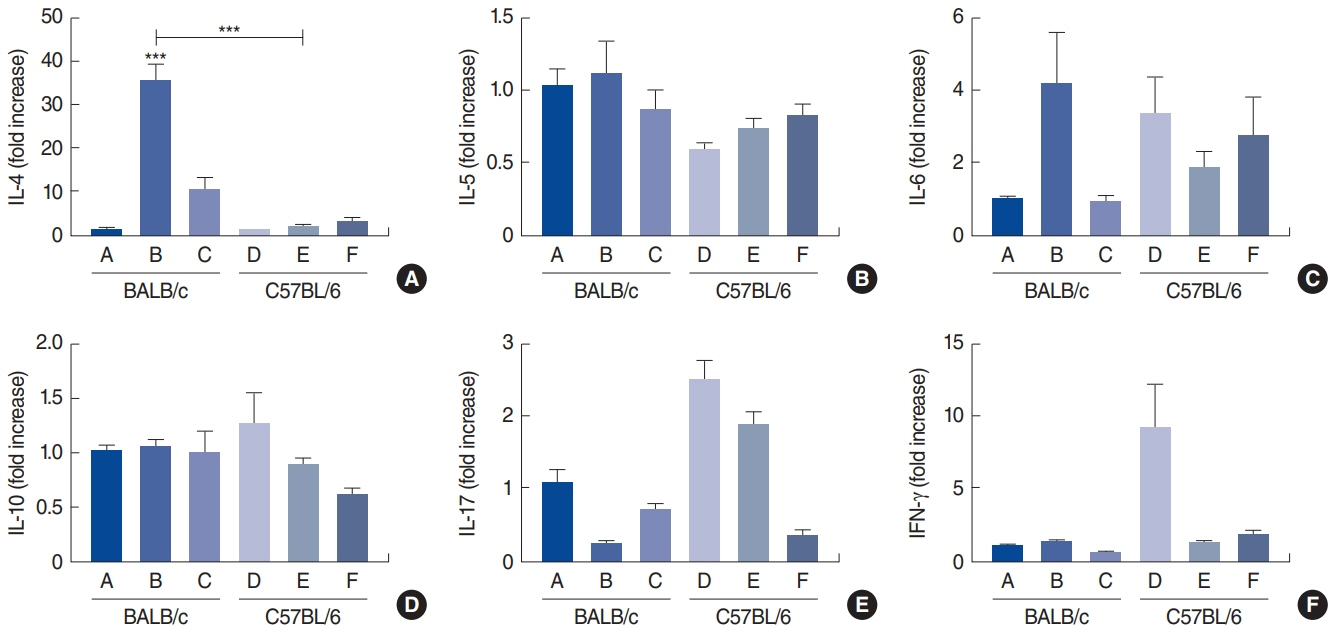
Fig. 8. Nasal mRNA expression of cytokines. Shown are interleukin (IL)-4 (A), IL-5 (B), IL-6 (C), IL-10 (D), IL-17 (E), and interferon (IFN)-γ (F) levels in the control group of BALB/c mice (group A), BALB/c mice exposed to 25 µg of Dermatophagoides farinae (Der f1; group B), BALB/c mice group exposed to 100 µg of Der f1 (group C), control group of C57BL/6 mice (group D), C57BL/6 mice exposed to 25 µg of Der f1 (group E), and C57BL/6 mice exposed to 100 µg of Der f1 (group F). Bars represent standard error. Significantly different from control mice or significantly different between strains, ***P<0.001.
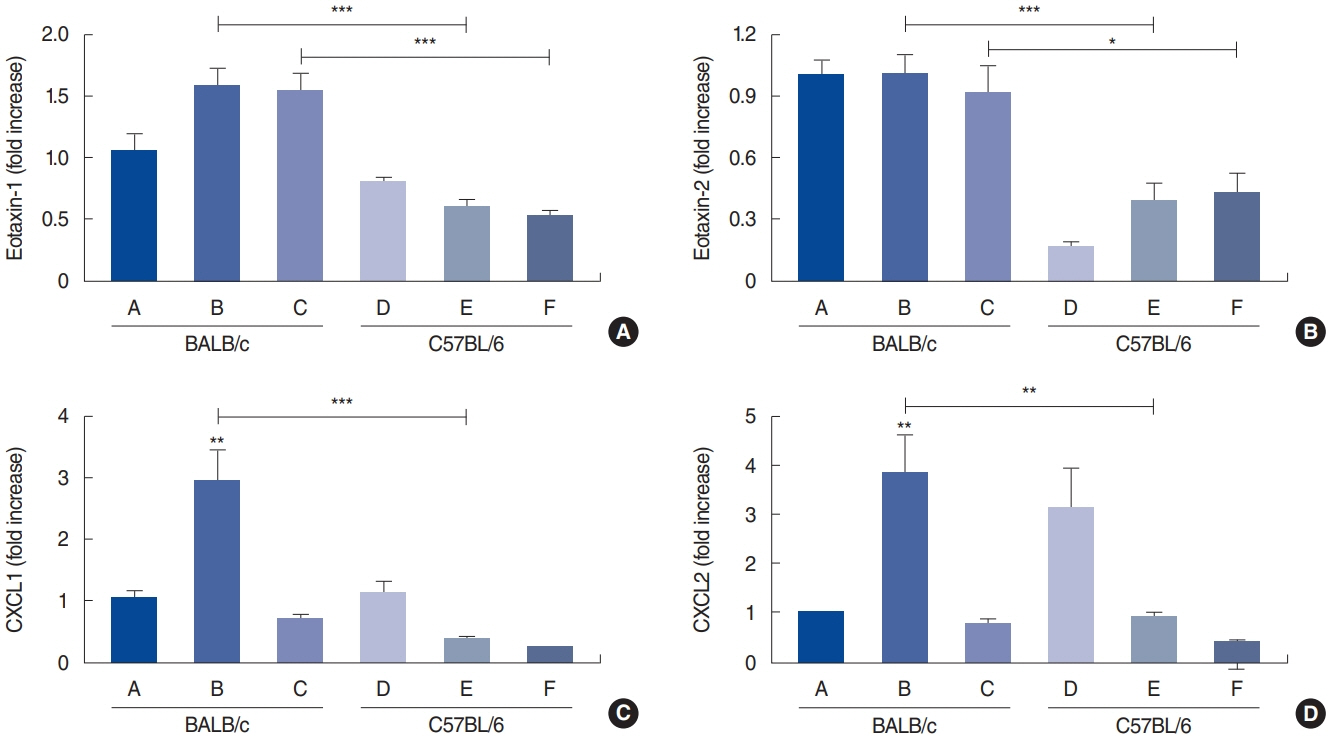
Fig. 9. Nasal mRNA expression of chemokines. Shown are eotaxin-1 (A), eotaxin-2 (B), CXCL1 (C), and CXCL2 (D) in the control group of BALB/c mice (group A), BALB/c mice exposed to 25 µg of Dermatophagoides farinae (Der f1; group B), BALB/c mice group exposed to 100 µg of Der f1 (group C), control group of C57BL/6 mice (group D), C57BL/6 mice exposed to 25 µg of Der f1 (group E), and C57BL/6 mice exposed to 100 µg of Der f1 (group F). Bars represent standard error. Significantly different from control mice or significantly different between strains, *P<0.05, **P<0.01, ***P<0.001.
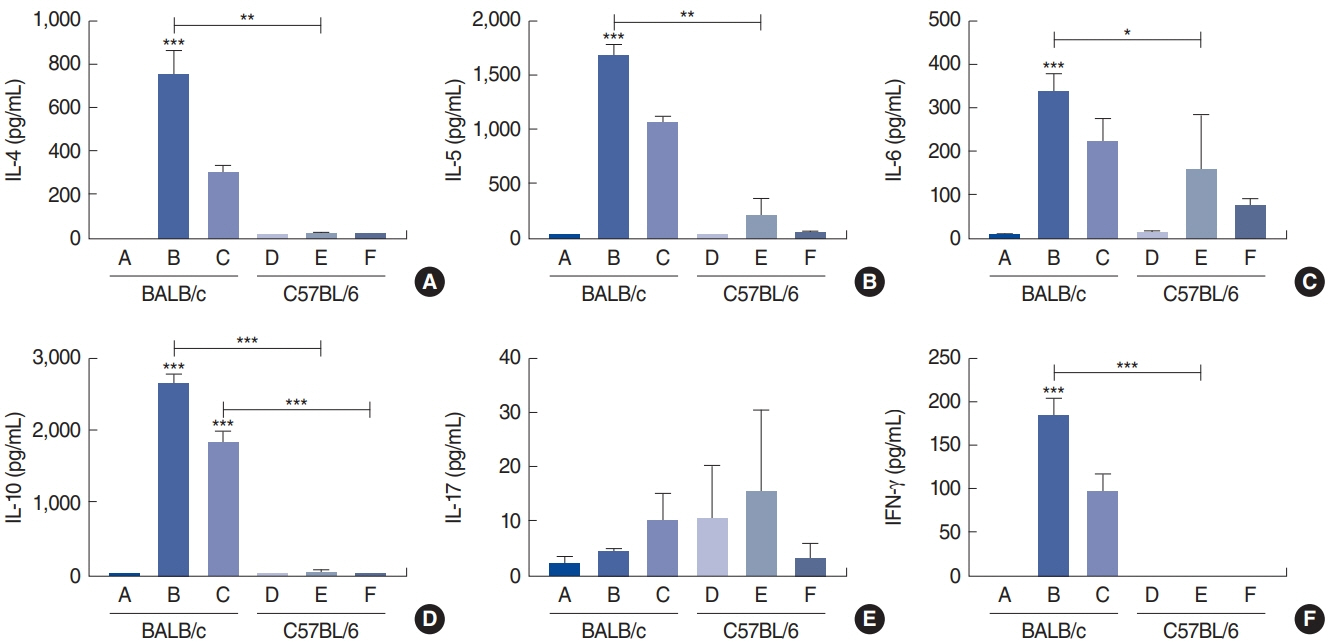
Fig. 10. Cytokine levels from splenocyte culture; interleukin (IL)-4 (A), IL-5 (B), IL-6 (C), IL-10 (D), IL-17 (E) and interferon (IFN)-γ (F) in the control group of BALB/c mice (group A), BALB/c mice exposed to 25 µg of Dermatophagoides farinae (Der f1; group B), BALB/c mice group exposed to 100 µg of Der f1 (group C), control group of C57BL/6 mice (group D), C57BL/6 mice exposed to 25 µg of Der f1 (group E), and C57BL/6 mice exposed to 100 µg of Der f1 (group F). Bars represent standard error. Significantly different from control mice or significantly different between strains, *P<0.05, **P<0.01, ***P<0.001.
Cited by 2 articles
-
Influence of the Genetic Background on Allergic Rhinitis Models in Mice
Roza Khalmuratova, Hyun-Woo Shin
Clin Exp Otorhinolaryngol. 2020;13(4):322-323. doi: 10.21053/ceo.2020.00892.Understanding the Mouse Model of Respiratory Allergic Diseases
Sang Chul Park
Korean J Otorhinolaryngol-Head Neck Surg. 2022;65(6):309-318. doi: 10.3342/kjorl-hns.2022.00381.
Reference
-
1. Passali D, Cingi C, Staffa P, Passali F, Muluk NB, Bellussi ML. The international study of the allergic rhinitis survey: outcomes from 4 geographical regions. Asia Pac Allergy. 2018; Jan. 8(1):e7.
Article2. Wise SK, Lin SY, Toskala E, Orlandi RR, Akdis CA, Alt JA, et al. International Consensus Statement on Allergy and Rhinology: allergic rhinitis. Int Forum Allergy Rhinol. 2018; Feb. 8(2):108–352.3. Kim BY, Park HR, Shin JH, Kim SW, Kim SW. Human placental extract reduces allergic inflammation in a murine allergic rhinitis model. Laryngoscope. 2014; Oct. 124(10):E399–404.
Article4. Han DH, Shin JM, An S, Kim JS, Kim DY, Moon S, et al. Long-term breastfeeding in the prevention of allergic rhinitis: Allergic Rhinitis Cohort Study for Kids (ARCO-Kids Study). Clin Exp Otorhinolaryngol. 2019; Aug. 12(3):301–7.
Article5. Lee DJ, Chung YJ, Yang YJ, Mo JH. The impact of allergic rhinitis on symptom improvement in pediatric patients after adenotonsillectomy. Clin Exp Otorhinolaryngol. 2018; Mar. 11(1):52–7.
Article6. Scadding G. Cytokine profiles in allergic rhinitis. Curr Allergy Asthma Rep. 2014; May. 14(5):435.
Article7. De Vooght V, Vanoirbeek JA, Luyts K, Haenen S, Nemery B, Hoet PH. Choice of mouse strain influences the outcome in a mouse model of chemical-induced asthma. PLoS One. 2010; Sep. 5(9):e12581.
Article8. Okano M, Nishizaki K, Abe M, Wang MM, Yoshino T, Satoskar AR, et al. Strain-dependent induction of allergic rhinitis without adjuvant in mice. Allergy. 1999; Jun. 54(6):593–601.
Article9. Kelada SN, Wilson MS, Tavarez U, Kubalanza K, Borate B, Whitehead GS, et al. Strain-dependent genomic factors affect allergen-induced airway hyperresponsiveness in mice. Am J Respir Cell Mol Biol. 2011; Oct. 45(4):817–24.
Article10. Mo JH, Lee SE, Wee JH, Lee JE, Rhee CS, Lee CH, et al. Anti-allergic effects of So-Cheong-Ryong-Tang, a traditional Korean herbal medicine, in an allergic rhinitis mouse model. Eur Arch Otorhinolaryngol. 2013; Mar. 270(3):923–30.
Article11. Zhang YL, Shin HJ, Lee JH, Lee J. Antiallergic effect of Hizikia fusiformis in an ovalbumin-induced allergic rhinitis mouse model. Clin Exp Otorhinolaryngol. 2019; May. 12(2):196–205.
Article12. Cho JS, Kang JH, Han IH, Um JY, Park IH, Lee SH, et al. Antiallergic effects of Trichostatin A in a murine model of allergic rhinitis. Clin Exp Otorhinolaryngol. 2015; Sep. 8(3):243–9.
Article13. Lee JE, Zhang YL, Han DH, Kim DY, Rhee CS. Antiallergic function of KR62980, a peroxisome proliferator-activated receptor-γ agonist, in a mouse allergic rhinitis model. Allergy Asthma Immunol Res. 2015; May. 7(3):256–64.
Article14. Kim DH, Park YS, Jang HJ, Kim JH, Lim DH. Prevalence and allergen of allergic rhinitis in Korean children. Am J Rhinol Allergy. 2016; May. 30(3):72–8.
Article15. Shin YS, Jung CG, Park HS. Prevalence and clinical characteristics of local allergic rhinitis to house dust mites. Curr Opin Allergy Clin Immunol. 2018; Feb. 18(1):10–5.
Article16. Yasue M, Yokota T, Suko M, Okudaira H, Okumura Y. Comparison of sensitization to crude and purified house dust mite allergens in inbred mice. Lab Anim Sci. 1998; Aug. 48(4):346–52.17. Raberg L, Sim D, Read AF. Disentangling genetic variation for resistance and tolerance to infectious diseases in animals. Science. 2007; Nov. 318(5851):812–4.
Article18. Sahu N, Morales JL, Fowell D, August A. Modeling susceptibility versus resistance in allergic airway disease reveals regulation by Tec kinase Itk. PLoS One. 2010; Jun. 5(6):e11348.
Article19. Lee KI, Kim DW, Kim EH, Kim JH, Samivel R, Kwon JE, et al. Cigarette smoke promotes eosinophilic inflammation, airway remodeling, and nasal polyps in a murine polyp model. Am J Rhinol Allergy. 2014; May-Jun. 28(3):208–14.
Article20. Sakai K, Yokoyama A, Kohno N, Hiwada K. Effect of different sensitizing doses of antigen in a murine model of atopic asthma. Clin Exp Immunol. 1999; Oct. 118(1):9–15.
Article21. Shibamori M, Ogino K, Kambayashi Y, Ishiyama H. Intranasal mite allergen induces allergic asthma-like responses in NC/Nga mice. Life Sci. 2006; Jan. 78(9):987–94.
Article22. Suzuki G, Kawase Y, Koyasu S, Yahara I, Kobayashi Y, Schwartz RH. Antigen-induced suppression of the proliferative response of T cell clones. J Immunol. 1988; Mar. 140(5):1359–65.23. Byers VS, Sercarz EE. Induction and reversal of immune paralysis in vitro. J Exp Med. 1970; Nov. 132(5):845–57.
Article24. Vanoirbeek JA, Tarkowski M, Vanhooren HM, De Vooght V, Nemery B, Hoet PH. Validation of a mouse model of chemical-induced asthma using trimellitic anhydride, a respiratory sensitizer, and dinitrochlorobenzene, a dermal sensitizer. J Allergy Clin Immunol. 2006; May. 117(5):1090–7.
Article25. Vanoirbeek JA, Tarkowski M, Ceuppens JL, Verbeken EK, Nemery B, Hoet PH. Respiratory response to toluene diisocyanate depends on prior frequency and concentration of dermal sensitization in mice. Toxicol Sci. 2004; Aug. 80(2):310–21.
Article26. Vanoirbeek JA, De Vooght V, Nemery B, Hoet PH. Multiple challenges in a mouse model of chemical-induced asthma lead to tolerance: ventilatory and inflammatory responses are blunted, immunologic humoral responses are not. Toxicology. 2009; Mar. 257(3):144–52.
Article27. Zhang Y, Lamm WJ, Albert RK, Chi EY, Henderson WR Jr, Lewis DB. Influence of the route of allergen administration and genetic background on the murine allergic pulmonary response. Am J Respir Crit Care Med. 1997; Feb. 155(2):661–9.
Article
- Full Text Links
-
- Actions
-
Cited
- CITED
-
- Close
- Share
-
- Similar articles
-
- Repellent effect of Mate tea and Jasmine tea against house dust mites (Dermatophagoides farinae and D. pteronyssinus)
- House Dust Mite Allergic Rhinitis Model in C57BL/6 Mice
- House Dust Mites Sensitivity in Korean Atopic children; Correlation Between Skin Reaction and Relative Concentration of Specific IgE by ELISA
- One Year result of Dermatophagoides farinae antigen - speciffic autologous antibody complex immunotherapy in respiratory allergic patients sensitized to house dust mite
- Induction of Mucosal Tolerance Using House Dust Mite-Cholera Toxin B Conjugate in Mouse Model of Allergic Rhinitis: Prophylactic and Long-Term Therapeutic Effects
