Factors Associated with 5-Year Costs of Care among a Cohort of Alcohol Use Disorder Patients: A Bayesian Network Model
- Affiliations
-
- 1Department of Public Health and Clinical Nutrition, University of Eastern Finland, Kuopio,
- 2Finnish Institute for Health and Welfare, Helsinki,
- 3General Practice Unit, Kuopio University Hospital, Primary Health Care, Kuopio,
- 4Joint Municipal Authority for North Karelia Social and Health Services (Siun sote), Joensuu,
- 5Department of Communications and Networking, School of Electrical Engineering, Aalto University, Espoo,
- KMID: 2501338
- DOI: http://doi.org/10.4258/hir.2020.26.2.129
Abstract
Objectives To examine the direct effects of risk factors associated with the 5-year costs of care in persons with alcohol use disorder (AUD) and to examine whether remission decreases the costs of care.
Methods Based on Electronic Health Record data collected in the North Karelia region in Finland from 2012 to 2016, we built a non-causal augmented naïve Bayesian (ANB) network model to examine the directional relationship between 16 risk factors and the costs of care for a random cohort of 363 AUD patients. Jouffe’s proprietary likelihood matching algorithm and van der Weele’s disjunctive confounder criteria (DCC) were used to calculate the direct effects of the variables, and sensitivity analysis with tornado diagrams and analysis maximizing/minimizing the total cost of care were conducted.
Results The highest direct effect on the total cost of care was observed for a number of chronic conditions, indicating on average more than a €26,000 increase in the 5-year mean cost for individuals with multiple ICD-10 diagnoses compared to individuals with less than two chronic conditions. Remission had a decreasing effect on the total cost accumulation during the 5-year follow-up period; the percentage of the lowest cost quartile (42.9% vs. 23.9%) increased among remitters, and that of the highest cost quartile (10.71% vs. 26.27%) decreased compared with current drinkers.
Conclusions The ANB model with application of DCC identified that remission has a favorable causal effect on the total cost accumulation. A high number of chronic conditions was the main contributor to excess cost of care, indicating that comorbidity is an essential mediator of cost accumulation in AUD patients.
Keyword
Figure
-
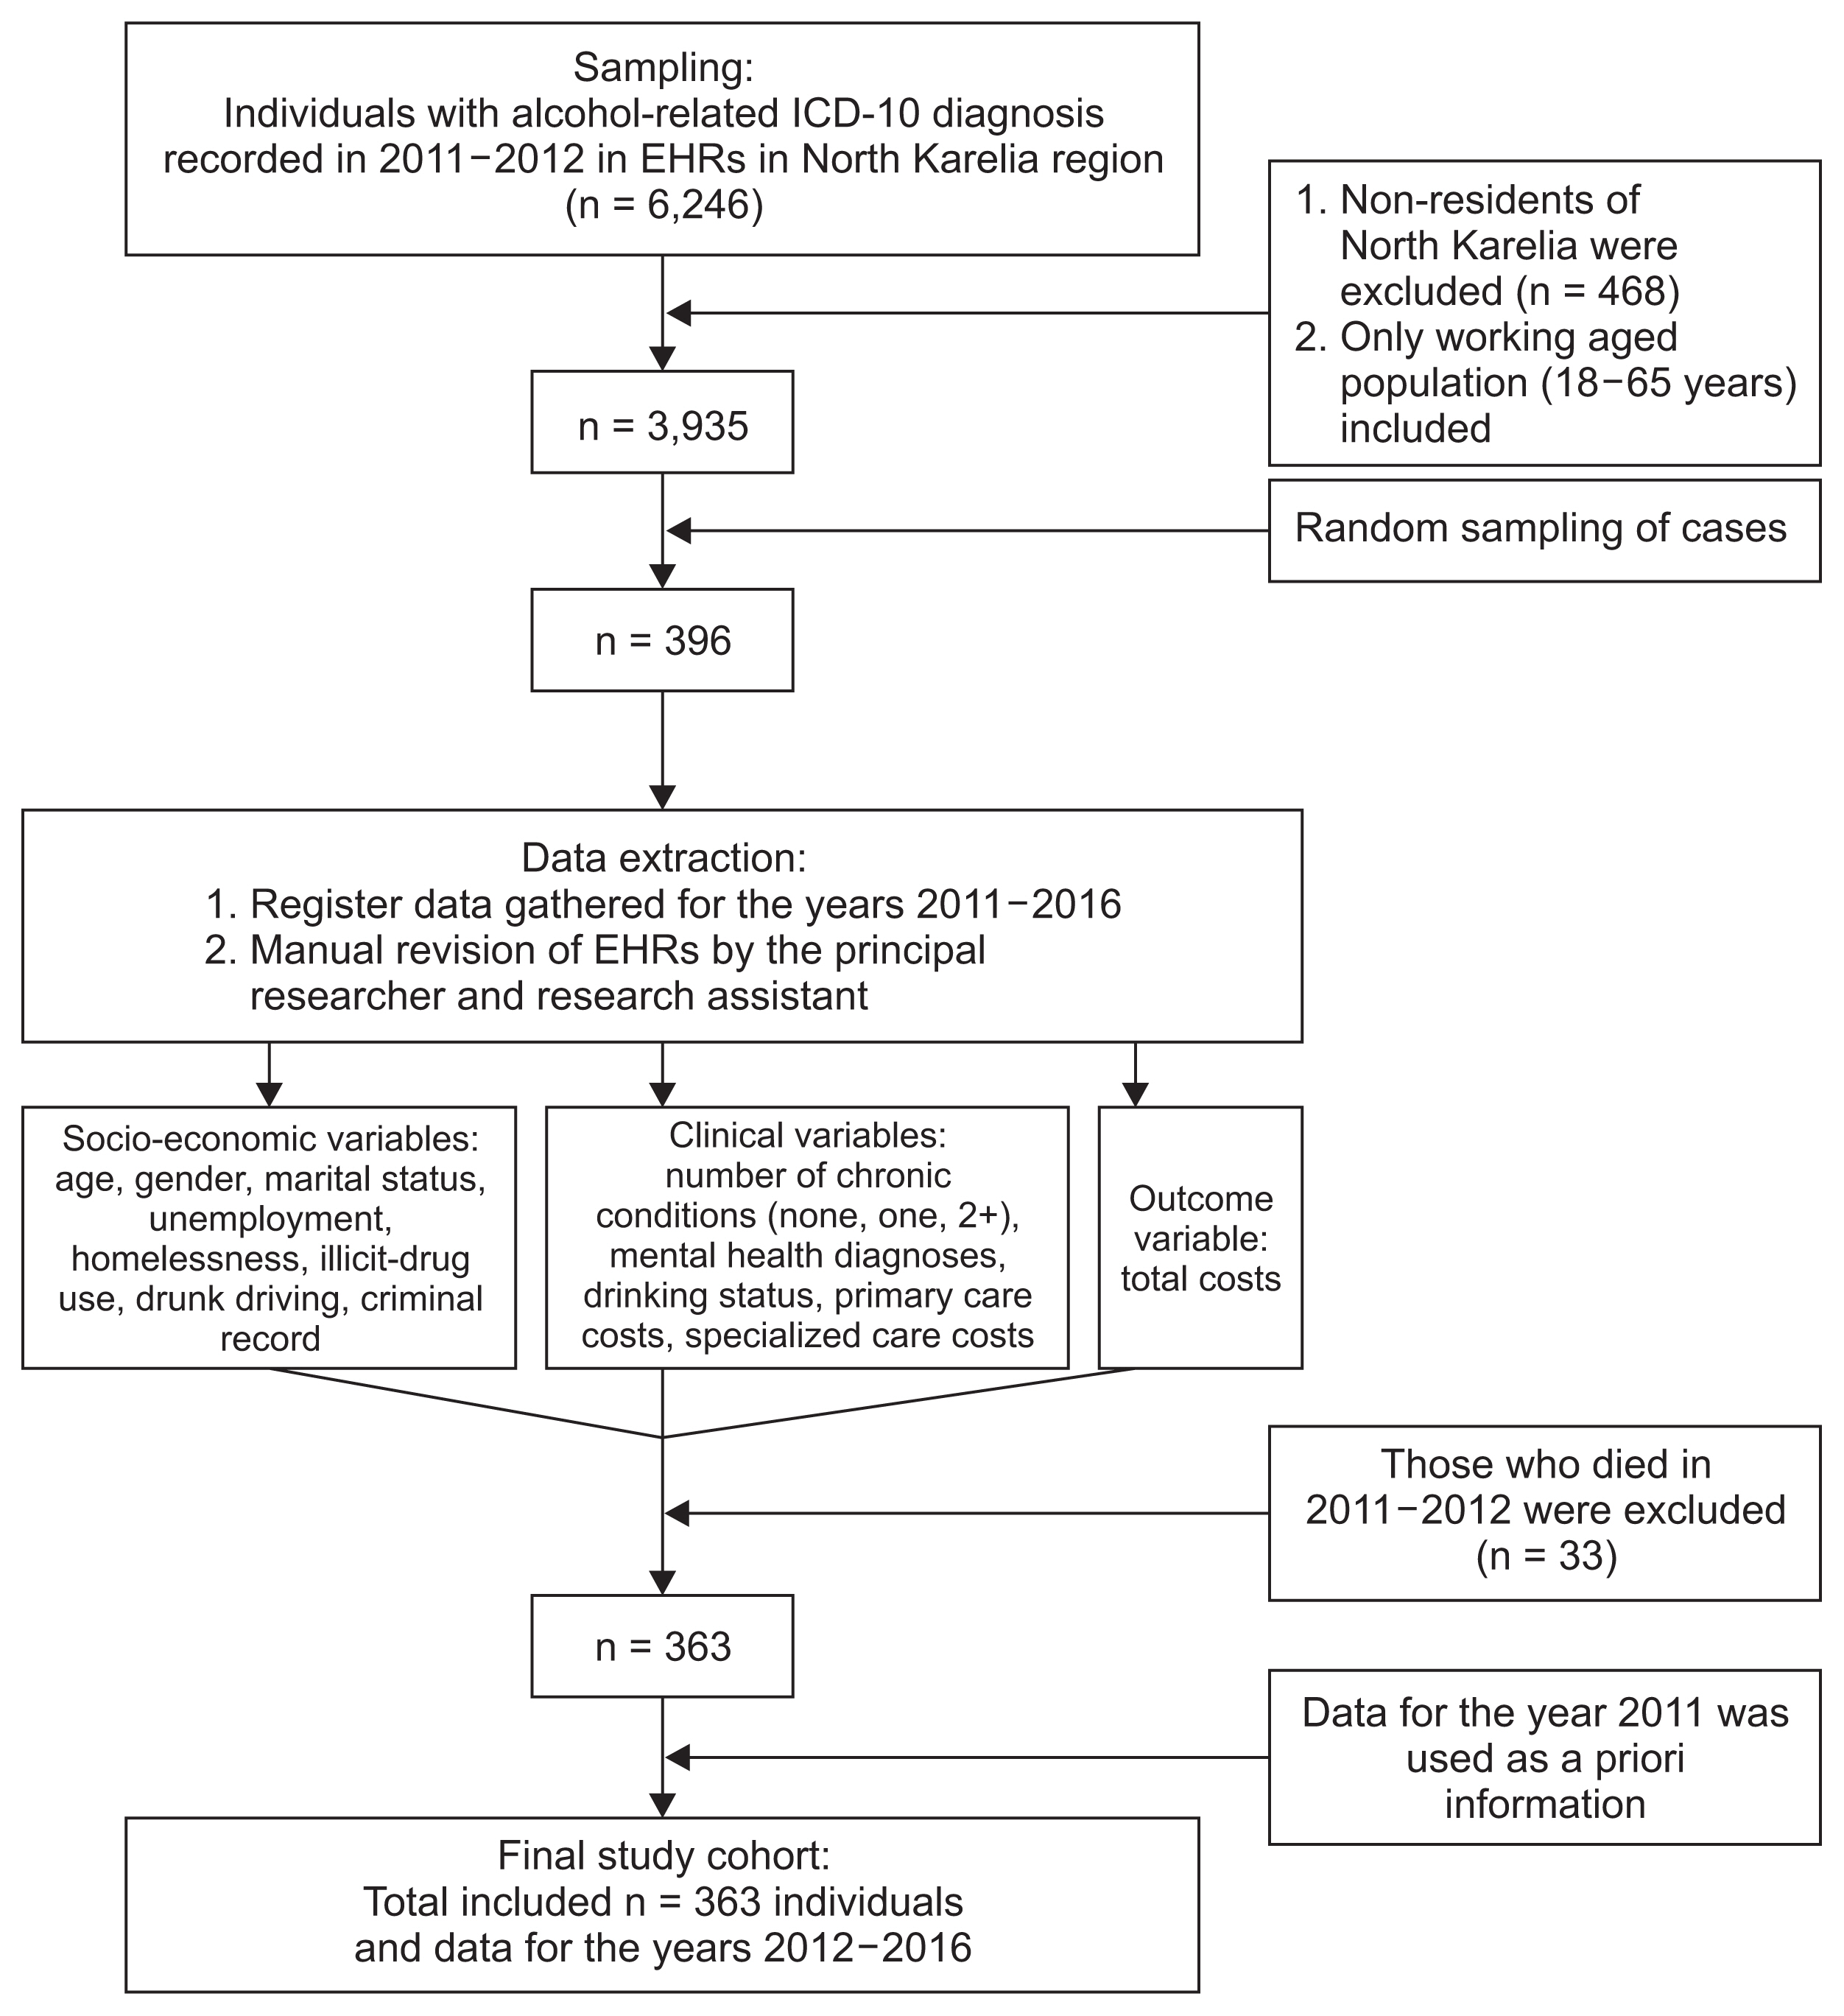
Figure 1 Diagram of sampling and data extraction process. ICD-10: the 10th revision of the International Statistical Classification of Diseases and Related Health Problems, EHR: Electronic Health Record.

Figure 2 The augmented naive Bayes model of factors associated with the outcome variable total costs (totalcost_2012–2016). Node sizes express each variable’s direct effect on the target node. Node colors indicate node force, with green being the highest and red lowest, and yellow in between. Lines between nodes indicate the relationship between them (Kullback-Leibler divergence).
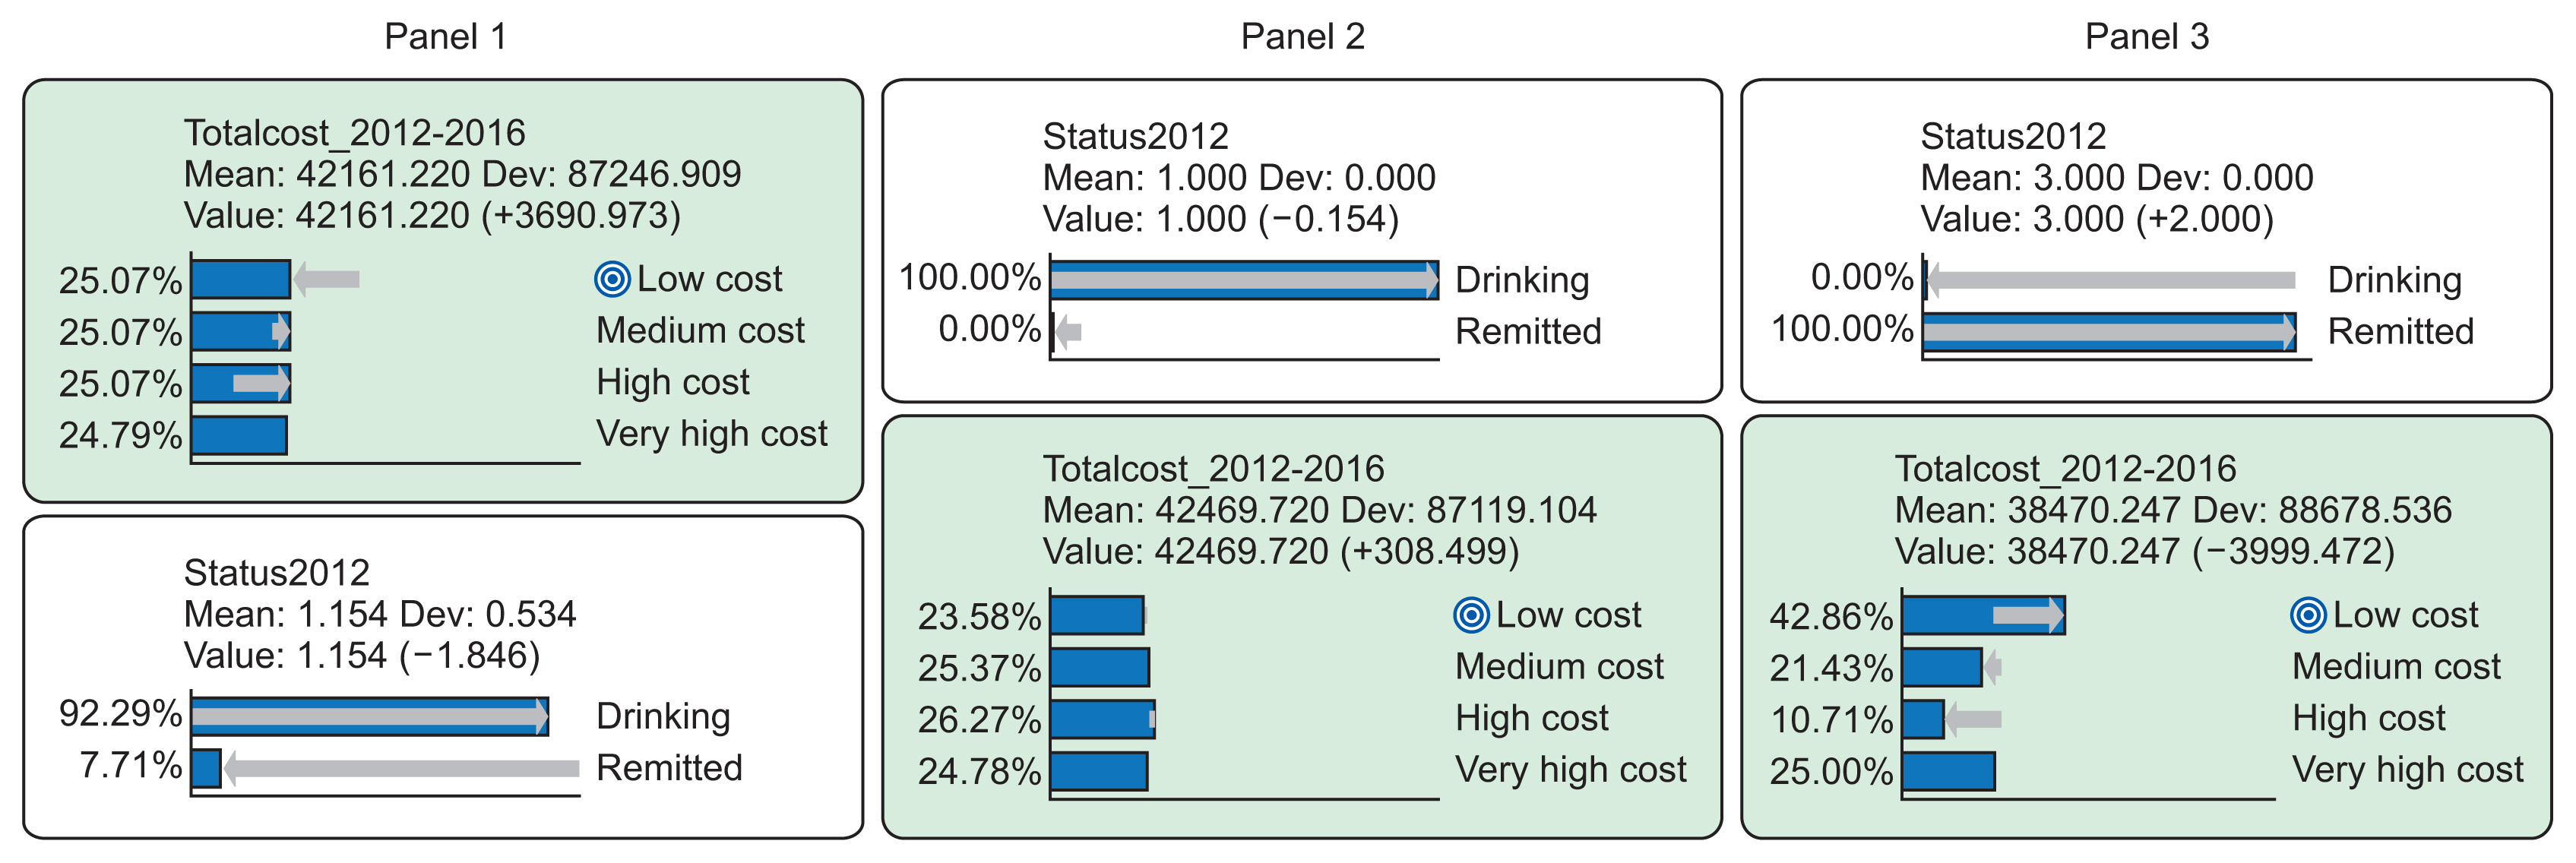
Figure 3 Panels showing the outcome variable “total cost_2012–2016” in relation to drinking “status2012”. Cost quartiles include: low costs, ≤€4,486.54; medium cost, €4,486.55–€15,746.10; high cost, €15,746.11–€46,864.36; and very high cost, €46,864.37–€1,180,863.75 and drinking status in 2012 was defined as continuous drinking versus remitted. In Panel 1, both variables are unfixed. Panel 2 shows the distribution of costs in the outcome variable “totalcost_2012–2016” when the variable “status2012” is fixed for the value drinking=100% and all other variables (not shown) are fixed to their original distribution. In Panel 3, the variable “status2012” is fixed for the value remitted=100%, demonstrating the causal change in costs (totalcost_2012–2016) after achieving remission.

Figure 4 Tornado diagrams showing variables with the strongest impact on the outcome variable. Bars pointing to the right represent a positive impact, and bars to the left a negative impact. (A) Panel 1 shows the effect on “low cost” value of the outcome variable, (B) Panel 2 on “medium cost”, (C) Panel 3 on “high cost”, and (D) Panel 4 on “very high cost”.
Reference
-
References
1. Dennis M, Scott CK. Managing addiction as a chronic condition. Addict Sci Clin Pract. 2007; 4(1):45–55.
Article2. Witkiewitz K, Marlatt GA. Modeling the complexity of post-treatment drinking: it’s a rocky road to relapse. Clin Psychol Rev. 2007; 27(6):724–38.
Article3. National Institute on Alcohol Abuse and Alcoholism. Alcohol facts and statistics [Internet]. Bethesda (MD): National Institute on Alcohol Abuse and Alcoholism;c2019. [cited at 2020 Apr 1]. Available from: https://www.niaaa.nih.gov/publications/brochures-and-factsheets/alcohol-facts-and-statistics.4. Effertz T, Mann K. The burden and cost of disorders of the brain in Europe with the inclusion of harmful alcohol use and nicotine addiction. Eur Neuropsychopharmacol. 2013; 23(7):742–8.
Article5. Gustavsson A, Svensson M, Jacobi F, Allgulander C, Alonso J, Beghi E, et al. Cost of disorders of the brain in Europe 2010. Eur Neuropsychopharmacol. 2011; 21(10):718–79.6. Boschloo L, Vogelzangs N, van den Brink W, Smit JH, Beekman AT, Penninx BW. Predictors of the 2-year recurrence and persistence of alcohol dependence. Addiction. 2012; 107(9):1639–40.
Article7. Vaillant GE, Hiller-Sturmhofel S. The natural history of alcoholism. Alcohol Health Res World. 1996; 20(3):152–61.8. Collins SE. Associations between socioeconomic factors and alcohol outcomes. Alcohol Res. 2016; 38(1):83–94.9. Compton WM, Gfroerer J, Conway KP, Finger MS. Unemployment and substance outcomes in the United States 2002–2010. Drug Alcohol Depend. 2014; 142:350–3.
Article10. Cross GM, Morgan CW, Mooney AJ 3rd, Martin CA, Rafter JA. Alcoholism treatment: a ten-year follow-up study. Alcohol Clin Exp Res. 1990; 14(2):169–73.
Article11. Dennis ML, Foss MA, Scott CK. An eight-year perspective on the relationship between the duration of abstinence and other aspects of recovery. Eval Rev. 2007; 31(6):585–612.
Article12. Holder HD, Blose JO. The reduction of health care costs associated with alcoholism treatment: a 14-year longitudinal study. J Stud Alcohol. 1992; 53(4):293–302.
Article13. Zywiak WH, Hoffmann NG, Stout RL, Hagberg S, Floyd AS, DeHart SS. Substance abuse treatment cost offsets vary with gender, age, and abstinence likelihood. J Health Care Finance. 1999; 26(1):33–9.14. Parthasarathy S, Weisner CM. Five-year trajectories of health care utilization and cost in a drug and alcohol treatment sample. Drug Alcohol Depend. 2005; 80(2):231–40.
Article15. Hoff RA, Rosenheck RA. The cost of treating substance abuse patients with and without comorbid psychiatric disorders. Psychiatr Serv. 1999; 50(10):1309–15.
Article16. Davenport T, Kalakota R. The potential for artificial intelligence in healthcare. Future Healthc J. 2019; 6(2):94–8.
Article17. Escobar GJ, Turk BJ, Ragins A, Ha J, Hoberman B, LeVine SM, et al. Piloting electronic medical record-based early detection of inpatient deterioration in community hospitals. J Hosp Med. 2016; 11(Suppl 1):S18–S24.
Article18. Liang H, Tsui BY, Ni H, Valentim CC, Baxter SL, Liu G, et al. Evaluation and accurate diagnoses of pediatric diseases using artificial intelligence. Nat Med. 2019; 25(3):433–8.
Article19. Abhari S, Niakan Kalhori SR, Ebrahimi M, Hasannejadasl H, Garavand A. Artificial intelligence applications in type 2 diabetes mellitus care: focus on machine learning methods. Healthc Inform Res. 2019; 25(4):248–61.
Article20. Morid MA, Kawamoto K, Ault T, Dorius J, Abdelrahman S. Supervised learning methods for predicting healthcare costs: systematic literature review and empirical evaluation. AMIA Annu Symp Proc. 2018; 2017:1312–21.21. Yang C, Delcher C, Shenkman E, Ranka S. Machine learning approaches for predicting high cost high need patient expenditures in health care. Biomed Eng Online. 2018; 17(Suppl 1):131.
Article22. Wammes JJ, van der Wees PJ, Tanke MA, Westert GP, Jeurissen PP. Systematic review of high-cost patients’ characteristics and healthcare utilisation. BMJ Open. 2018; 8(9):e023113.
Article23. BayesiaLab [Internet]. Franklin (TN): Bayesia USA;2019. [cited at 2020 Apr 1]. Available from: http://www.bayesialab.com/.24. Rissanen J. Modeling by shortest data description. Automatica. 1978; 14:465–71.
Article25. VanderWeele TJ, Shpitser I. A new criterion for confounder selection. Biometrics. 2011; 67(4):1406–13.
Article26. VanderWeele TJ. Principles of confounder selection. Eur J Epidemiol. 2019; 34(3):211–9.
Article27. Conrady L, Jouffe L. Bayesian networks and BayesiaLab: a practical introduction for researchers. Franklin (TN): Bayesia USA;2015.28. Hensel JM, Taylor VH, Fung K, Vigod SN. Rates of mental illness and addiction among high-cost users of medical services in Ontario. Can J Psychiatry. 2016; 61(6):358–66.
Article29. Shei A, Rice JB, Kirson NY, Bodnar K, Enloe CJ, Birnbaum HG, et al. Characteristics of high-cost patients diagnosed with opioid abuse. J Manag Care Spec Pharm. 2015; 21(10):902–12.
Article30. Lahiri B, Agarwal N. Predicting healthcare expenditure increase for an individual from medicare data. In : Proceedings of the ACM SIGKDD Workshop on Health Informatics; 2014 Aug 24; New York City, NY.
- Full Text Links
-
- Actions
-
Cited
- CITED
-
- Close
- Share
-
- Similar articles
-
- A Hybrid Bayesian Network Model for Predicting Breast Cancer Prognosis
- Application of a Bayesian Network to Predict Hospitalization among HIV Adults
- Bayesian Network Approaches to Health Services Research
- Events related to medication errors and related factors involving nurses’ behavior to reduce medication errors in Japan: a Bayesian network modeling-based factor analysis and scenario analysis
- The Association of Alcohol Use Disorder with Perioperative Complications following Primary Total Hip Arthroplasty
