Assessment of the Cerebrospinal Fluid Effect on the Chemical Exchange Saturation Transfer Map Obtained from the Full Z-Spectrum in the Elderly Human Brain
- Affiliations
-
- 1Department of Radiology, Kyung Hee University Hospital at Gangdong, College of Medicine, Kyung Hee University, Seoul, Korea. ghjahng@gmail.com
- 2Department of Biomedical Engineering, Kyung Hee University, Yongin, Korea.
- KMID: 2468175
- DOI: http://doi.org/10.14316/pmp.2019.30.4.139
Abstract
- PURPOSE
With neurodegeneration, the signal intensity of the cerebrospinal fluid (CSF) in the brain increases. The objective of this study was to evaluate chemical exchange saturation transfer (CEST) signals with and without the contribution of CSF signals in elderly human brains using two different 3T magnetic resonance imaging (MRI) sequences.
METHODS
Full CEST signals were acquired in ten subjects (Group I) with a three-dimensional (3D)-segmented gradient-echo echo-planar imaging (EPI) sequence and in ten other subjects (Group II) with a 3D gradient and spin-echo (GRASE) sequence using two different 3T MRI systems. The segmented tissue compartments of gray and white matter were used to mask the CSF signals in the full CEST images. Two sets of magnetization transfer ratio asymmetry (MTR(asym)) maps were obtained for each offset frequency in each subject with and without masking the CSF signals (masked and unmasked conditions, respectively) and later compared using paired t-tests.
RESULTS
The region-of-interest (ROI)-based analyses showed that the MTR(asym) values for both the 3D-segmented gradient-echo EPI and 3D GRASE sequences were altered under the masked condition compared with the unmasked condition at several ROIs and offset frequencies.
CONCLUSIONS
Depending on the imaging sequence, the MTR(asym) values can be overestimated for some areas of the elderly human brain when CSF signals are unmasked. Therefore, it is necessary to develop a method to minimize this overestimation in the case of elderly patients.
MeSH Terms
Figure
-
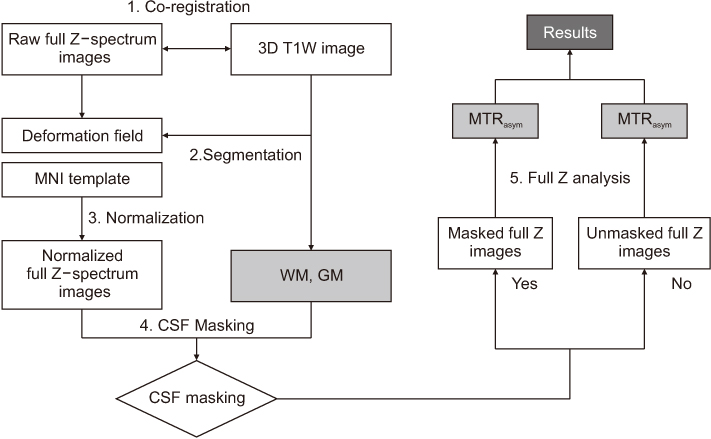
Fig. 1 Processing steps of the full Z-spectrum data to map magnetization transfer ratio asymmetry (MTRasym). For pre-processing, we included co-registration between the three-dimensional (3D) T1-weighted (T1W) and full Z-spectrum images, brain-tissue segmentation of the 3D T1W image, and spatial normalization of the co-registered full Z-spectrum images. In the normalized full Z-spectrum images, the cerebrospinal fluid (CSF) signals were masked. The MTRasym maps were calculated after B0 correction. Finally, statistical analyses were performed to compare the MTRasym maps obtained with and without masking the CSF signals. MNI, Montreal Neurological Institute; WM, white matter; GM, gray matter.
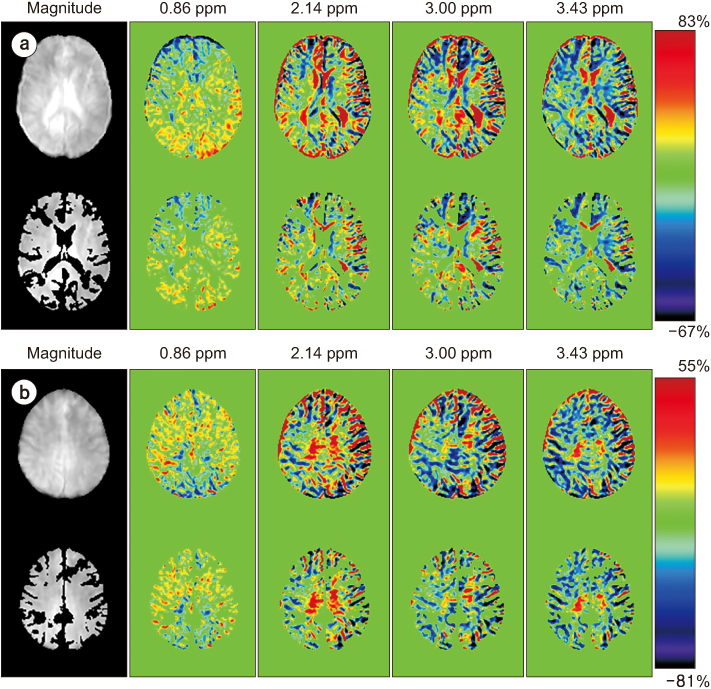
Fig. 2 Representative magnetization transfer ratio asymmetry (MTRasym) maps acquired at four different offset frequencies and the corresponding reference image obtained without (top) and with (bottom) masking the cerebrospinal fluid (CSF) signals of the ventricle (a) and cortex levels (b) with the three-dimentional-segmented gradient-echo echo-planar imaging sequence. The MTRasym maps were obtained at the offset frequencies 0.86, 2.14, 3.00, and 3.43 ppm. In the MTRasymmap, the color bar indicates the MTRasym value in percentage. The MTRasym values for the ventricle and perivascular space area were higher under the unmasked condition than that under masked condition. The MTRasym values for the ventricles and around the ventricles were higher under the unmasked condition than that under the masked CSF signals.
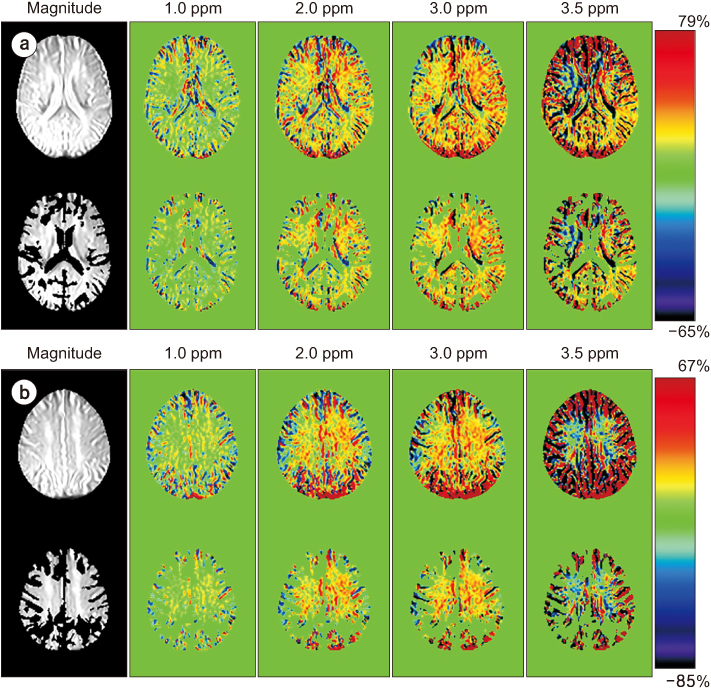
Fig. 3 Representative magnetization transfer ratio asymmetry (MTRasym) maps at acquired at four different offset frequencies and the corresponding reference image obtained without (top) and with (bottom) masking the cerebrospinal fluid (CSF) signals at the ventricle (a) and cortex levels (b) with the three-dimentional gradient and spin-echo sequence. The MTRasym maps were obtained at offset frequencies of 1.0, 2.0, 3.0, and 3.5 ppm. In the MTRasym map, the color bar indicates the MTRasym value in percentage. In general, the MTRasym values for the areas of the brain were higher without masking the CSF signals (unmasked condition) than that with masking (masked condition).
Cited by 1 articles
-
Magnetic Resonance Imaging: Historical Overview, Technical Developments, and Clinical Applications
Geon-Ho Jahng, Soonchan Park, Chang-Woo Ryu, Zang-Hee Cho
Prog Med Phys. 2020;31(3):35-53. doi: 10.14316/pmp.2020.31.3.35.
Reference
-
1. Oh JH, Kim HG, Woo DC, Jeong HK, Lee SY, Jahng GH. Chemical-exchange-saturation-transfer magnetic resonance imaging to map gamma-aminobutyric acid, glutamate, myoinositol, glycine, and asparagine: phantom experiments. J Korean Phys Soc. 2017; 70:545–553.
Article2. Dagher AP, Aletras A, Choyke P, Balaban RS. Imaging of urea using chemical exchange-dependent saturation transfer at 15T. J Magn Reson Imaging. 2000; 12:745–748.
Article3. Guivel-Scharen V, Sinnwell T, Wolff SD, Balaban RS. Detection of proton chemical exchange between metabolites and water in biological tissues. J Magn Reson. 1998; 133:36–45.
Article4. Zhou J, Lal B, Wilson DA, Laterra J, van Zijl PC. Amide proton transfer (APT) contrast for imaging of brain tumors. Magn Reson Med. 2003; 50:1120–1126.
Article5. van Zijl PC, Yadav NN. Chemical exchange saturation transfer (CEST): what is in a name and what isn't? Magn Reson Med. 2011; 65:927–948.
Article6. Bryant RG. The dynamics of water-protein interactions. Annu Rev Biophys Biomol Struct. 1996; 25:29–53.
Article7. Ward KM, Aletras AH, Balaban RS. A new class of contrast agents for MRI based on proton chemical exchange dependent saturation transfer (CEST). J Magn Reson. 2000; 143:79–87.
Article8. Xiao Y, Ma B, McElheny D, Parthasarathy S, Long F, Hoshi M, et al. Aβ(1-42) fibril structure illuminates self-recognition and replication of amyloid in Alzheimer's disease. Nat Struct Mol Biol. 2015; 22:499–505.
Article9. Zhang Y, Man VH, Roland C, Sagui C. Amyloid properties of asparagine and glutamine in prion-like proteins. ACS Chem Neurosci. 2016; 7:576–587.
Article10. Haris M, Cai K, Singh A, Hariharan H, Reddy R. In vivo mapping of brain myo-inositol. Neuroimage. 2011; 54:2079–2085.
Article11. Jahng GH, Lee DK, Lee JM, Rhee HY, Ryu CW. Double in version recovery imaging improves the evaluation of gray matter volume losses in patients with Alzheimer's disease and mild cognitive impairment. Brain Imaging Behav. 2016; 10:1015–1028.12. Tohka J. Partial volume effect modeling for segmentation and tissue classification of brain magnetic resonance images: a review. World J Radiol. 2014; 6:855–864.
Article13. Sun PZ, Lu J, Wu Y, Xiao G, Wu R. Evaluation of the dependence of CEST-EPI measurement on repetition time, RF irradiation duty cycle and imaging flip angle for enhanced pH sensitivity. Phys Med Biol. 2013; 58:N229–N240.
Article14. Zhu H, Jones CK, van Zijl PC, Barker PB, Zhou J. Fast 3D chemical exchange saturation transfer (CEST) imaging of the human brain. Magn Reson Med. 2010; 64:638–644.
Article15. Kim M, Gillen J, Landman BA, Zhou J, van Zijl PC. Water saturation shift referencing (WASSR) for chemical exchange saturation transfer (CEST) experiments. Magn Reson Med. 2009; 61:1441–1450.
Article16. Zaiss M, Xu J, Goerke S, Khan IS, Singer RJ, Gore JC, et al. Inverse Z-spectrum analysis for spillover-, MT-, and T1 -corrected steady-state pulsed CEST-MRI — application to pH-weighted MRI of acute stroke. NMR Biomed. 2014; 27:240–252.17. Tietze A, Blicher J, Mikkelsen IK, Østergaard L, Strother MK, Smith SA, et al. Assessment of ischemic penumbra in patients with hyperacute stroke using amide proton transfer (APT) chemical exchange saturation transfer (CEST) MRI. NMR Biomed. 2014; 27:163–174.
Article18. Zhou J, Blakeley JO, Hua J, Kim M, Laterra J, Pomper MG, et al. Practical data acquisition method for human brain tumor amide proton transfer (APT) imaging. Magn Reson Med. 2008; 60:842–849.
Article19. Sun PZ, Farrar CT, Sorensen AG. Correction for artifacts induced by B(0) and B(1) field inhomogeneities in pH-sensitive chemical exchange saturation transfer (CEST) imaging. Magn Reson Med. 2007; 58:1207–1215.20. Zu Z, Li K, Janve VA, Does MD, Gochberg DF. Optimizing pulsed-chemical exchange saturation transfer imaging sequences. Magn Reson Med. 2011; 66:1100–1108.
Article21. Tee YK, Khrapitchev AA, Sibson NR, Payne SJ, Chappell MA. Evaluating the use of a continuous approximation for model-based quantification of pulsed chemical exchange saturation transfer (CEST). J Magn Reson. 2012; 222:88–95.
Article
- Full Text Links
-
- Actions
-
Cited
- CITED
-
- Close
- Share
-
- Similar articles
-
- Preliminary Phantom Experiments to Map Amino Acids and Neurotransmitters Using MRI
- Physical Modeling of Chemical Exchange Saturation Transfer Imaging
- Advances in magnetic resonance technique for tumor imaging
- Added Value of Chemical Exchange-Dependent Saturation Transfer MRI for the Diagnosis of Dementia
- Traumatic Cerebrospinal Fluid Rhinorrhea: Successful Closure under the Surgical Microscope
