CT Evaluation for Clinical Lung Cancer Staging: Do Multiplanar Measurements Better Reflect Pathologic T-Stage than Axial Measurements?
- Affiliations
-
- 1Department of Radiology and Research Institute of Radiology, University of Ulsan College of Medicine, Asan Medical Center, Seoul, Korea. sangmin.lee.md@gmail.com
- 2Department of Convergence Medicine, University of Ulsan College of Medicine, Asan Medical Center, Seoul, Korea.
- KMID: 2467031
- DOI: http://doi.org/10.3348/kjr.2018.0824
Abstract
OBJECTIVE
To retrospectively investigate whether tumor size assessment on multiplanar reconstruction (MPR) CT images better reflects pathologic T-stage than evaluation on axial images and evaluate the additional value of measurement in three-dimensional (3D) space.
MATERIALS AND METHODS
From 1661 patients who had undergone surgical resection for primary lung cancer between June 2013 and November 2016, 210 patients (145 men; mean age, 64.4 years) were randomly selected and 30 were assigned to each pathologic T-stage. Two readers independently measured the maximal lesion diameters on MPR CT. The longest diameters on 3D were obtained using volume segmentation. T-stages determined on CT images were compared with pathologic T-stages (overall and subgroup"”Group 1, T1a/b; Group 2, T1c or higher), with differences in accuracy evaluated using McNemar's test. Agreement between readers was evaluated with intraclass correlation coefficients (ICC).
RESULTS
The diagnostic accuracy of MPR measurements for determining T-stage was significantly higher than that of axial measurement alone for both reader 1 (74.3% [156/210] vs. 63.8% [134/210]; p = 0.001) and reader 2 (68.1% [143/210] vs. 61.9% [130/210]; p = 0.049). In the subgroup analysis, diagnostic accuracy with MPR diameter was significantly higher than that with axial diameter in only Group 2 (p < 0.05). Inter-reader agreements for the ICCs on axial and MPR measurements were 0.98 and 0.98. The longest diameter on 3D images showed a significantly lower performance than MPR, with an accuracy of 54.8% (115/210) (p < 0.05).
CONCLUSION
Size measurement on MPR CT better reflected the pathological T-stage, specifically for T1c or higher stage lung cancer. Measurements in a 3D plane showed no added value.
MeSH Terms
Figure
-
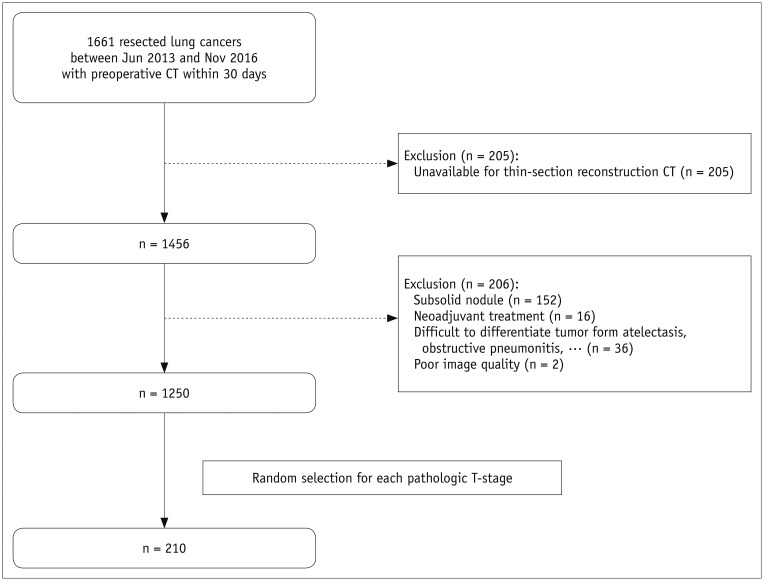
Fig. 1 Flow chart of patient inclusion procedure.
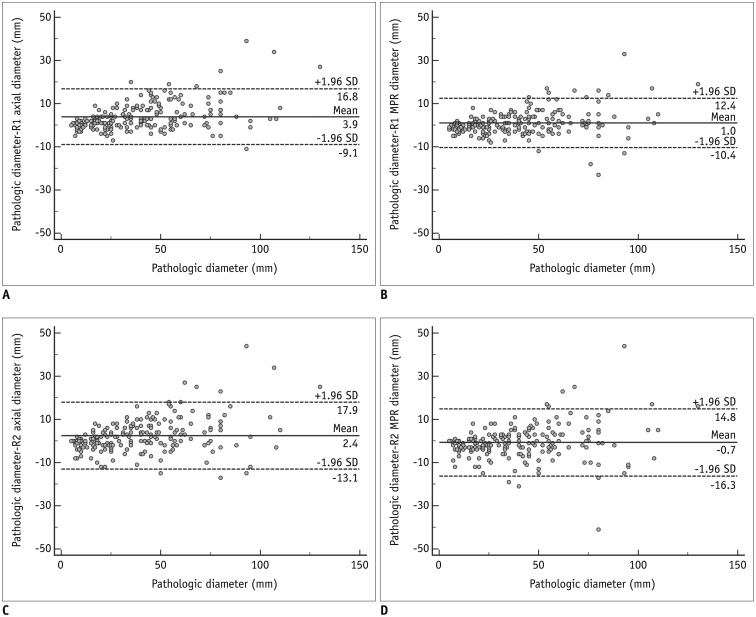
Fig. 2 Bland-Altman plots showing relationship between CT and pathologic diameters.A–D. Graphs show differences between CT diameter and pathologic size. X-axes represent pathologic size and Y-axes represent differences in size between CT diameter and pathologic size. A. axial diameter measured by reader 1. B. MPR diameter measured by reader 1. C. axial diameter measured by reader 2. D. MPR diameter measured by reader 2. MPR = multiplanar reconstruction, SD = standard deviation
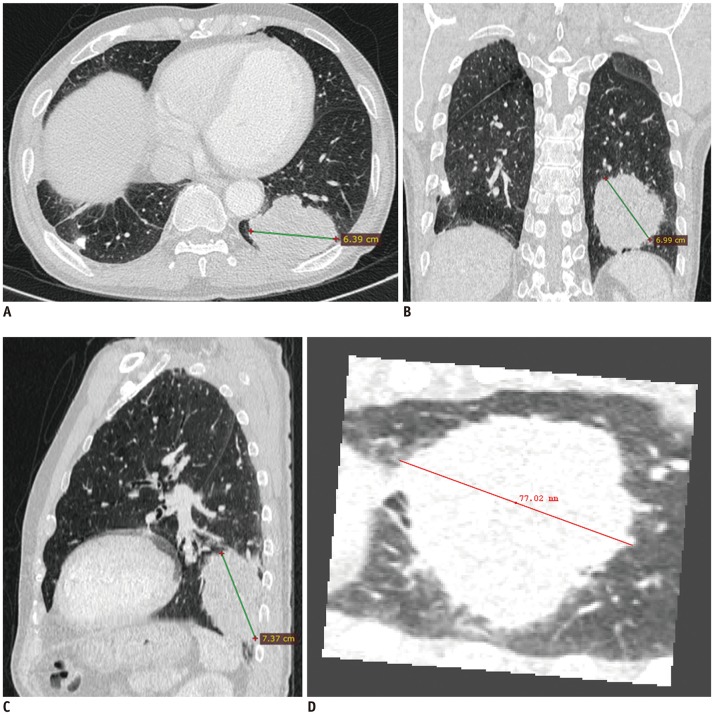
Fig. 3 Correct staging using MPR in T4 stages.(A) Axial, (B) coronal, and (C) sagittal CT scans of large lobulated mass in left lower lobe of 74-year-old man. Tumor lies anterosuperiorly to posteroinferiorly, so longest dimension of tumor was captured on sagittal plane. On axial CT alone, both readers underestimated tumor size (64 mm and 62 mm), with corresponding stage being T3. On sagittal CT, diameter measured by both readers was 74 mm, which was equal to pathologic diameter and resulted in accurate clinical staging as T4. D. Longest diameter on three-dimensional was 77 mm.
Reference
-
1. Goldstraw P, Chansky K, Crowley J, Rami-Porta R, Asamura H, Eberhardt WE, et al. International Association for the Study of Lung Cancer Staging and Prognostic Factors Committee, Advisory Boards, and Participating Institutions. The IASLC lung cancer staging project: proposals for revision of the TNM stage groupings in the forthcoming (eighth) edition of the TNM classification for lung cancer. J Thorac Oncol. 2016; 11:39–51. PMID: 26762738.2. Bankier AA, MacMahon H, Goo JM, Rubin GD, Schaefer-Prokop CM, Naidich DP. Recommendations for measuring pulmonary nodules at CT: a statement from the Fleischner Society. Radiology. 2017; 285:584–600. PMID: 28650738.3. Oxnard GR, Zhao B, Sima CS, Ginsberg MS, James LP, Lefkowitz RA, et al. Variability of lung tumor measurements on repeat computed tomography scans taken within 15 minutes. J Clin Oncol. 2011; 29:3114–3119. PMID: 21730273.
Article4. Heidinger BH, Anderson KR, Moriarty EM, Costa DB, Gangadharan SP, VanderLaan PA, et al. Size measurement and T-staging of lung adenocarcinomas manifesting as solid nodules ≤30 mm on CT: radiology-pathology correlation. Acad Radiol. 2017; 24:851–859. PMID: 28256438.5. Heidinger BH, Nemec U, Anderson KR, Costa DB, Gangadharan SP, VanderLaan PA, et al. “Rounding” the size of pulmonary nodules: impact of rounding methods on nodule management, as defined by the 2017 Fleischner Society guidelines. Acad Radiol. 2017; 24:1422–1427. PMID: 28666724.6. Ridge CA, Huang J, Cardoza S, Zabor EC, Moskowitz CS, Zakowski MF, et al. Comparison of multiplanar reformatted CT lung tumor measurements to axial tumor measurement alone: impact on maximal tumor dimension and T stage. AJR Am J Roentgenol. 2013; 201:959–963. PMID: 24147464.
Article7. Ahn H, Lee KW, Lee KH, Kim J, Kim K, Chung JH, et al. Effect of computed tomography window settings and reconstruction plane on 8th edition T-stage classification in patients with lung adenocarcinoma manifesting as a subsolid nodule. Eur J Radiol. 2018; 98:130–135. PMID: 29279151.
Article8. Wang Y, de Bock GH, van Klaveren RJ, van Ooyen P, Tukker W, Zhao Y, et al. Volumetric measurement of pulmonary nodules at low-dose chest CT: effect of reconstruction setting on measurement variability. Eur Radiol. 2010; 20:1180–1187. PMID: 19921204.
Article9. Goo JM, Tongdee T, Tongdee R, Yeo K, Hildebolt CF, Bae KT. Volumetric measurement of synthetic lung nodules with multi-detector row CT: effect of various image reconstruction parameters and segmentation thresholds on measurement accuracy. Radiology. 2005; 235:850–856. PMID: 15914478.
Article10. Petrou M, Quint LE, Nan B, Baker LH. Pulmonary nodule volumetric measurement variability as a function of CT slice thickness and nodule morphology. AJR Am J Roentgenol. 2007; 188:306–312. PMID: 17242235.
Article11. Ravenel JG, Leue WM, Nietert PJ, Miller JV, Taylor KK, Silvestri GA. Pulmonary nodule volume: effects of reconstruction parameters on automated measurements--a phantom study. Radiology. 2008; 247:400–408. PMID: 18430874.
Article12. Detterbeck FC, Boffa DJ, Tanoue LT. The new lung cancer staging system. Chest. 2009; 136:260–271. PMID: 19584208.
Article13. Lee KH, Goo JM, Park SJ, Wi JY, Chung DH, Go H, et al. Correlation between the size of the solid component on thin-section CT and the invasive component on pathology in small lung adenocarcinomas manifesting as ground-glass nodules. J Thorac Oncol. 2014; 9:74–82. PMID: 24346095.
Article
- Full Text Links
-
- Actions
-
Cited
- CITED
-
- Close
- Share
-
- Similar articles
-
- The Usefulness of Multiplanar Reconstruction Images in Preoperative T-staging of Advanced Gastric Cancer
- Lung cancer: acurracy of CT staging
- Utility of Multiplanar Reformation Images of Helical CT in the Evaluation of Pancreatic Diseases
- The Usefulness of Multiplanar Reconstruction Images in Preoperative CT Evaluation of Advanced Gastric Cancer
- Tumor Size Evaluation according to the T Component of the Seventh Edition of the International Association for the Study of Lung Cancer's TNM Classification: Interobserver Agreement between Radiologists and Computer-Aided Diagnosis System in Patients with Lung Cancer
