In-Vivo Proton Magnetic Resonance Spectroscopy of 2-Hydroxyglutarate in Isocitrate Dehydrogenase-Mutated Gliomas: A Technical Review for Neuroradiologists
- Affiliations
-
- 1Department of Radiology, Seoul National University Hospital, Seoul 03080, Korea. hyeonjinkim@snu.ac.kr
- 2Department of Biomedical Sciences, Seoul National University, Seoul 03087, Korea.
- 3Institute of Radiation Medicine, Seoul National University Medical Research Center, Seoul 03080, Korea.
- KMID: 2458053
- DOI: http://doi.org/10.3348/kjr.2016.17.5.620
Abstract
- The diagnostic and prognostic potential of an onco-metabolite, 2-hydroxyglutarate (2HG) as a proton magnetic resonance spectroscopy (1H-MRS) detectable biomarker of the isocitrate dehydrogenase (IDH)-mutated (IDH-MT) gliomas has drawn attention of neuroradiologists recently. However, due to severe spectral overlap with background signals, quantification of 2HG can be very challenging. In this technical review for neuroradiologists, first, the biochemistry of 2HG and its significance in the diagnosis of IDH-MT gliomas are summarized. Secondly, various 1H-MRS methods used in the previous studies are outlined. Finally, wereview previous in vivo studies, and discuss the current status of 1H-MRS in the diagnosis of IDH-MT gliomas.
Keyword
MeSH Terms
Figure
-
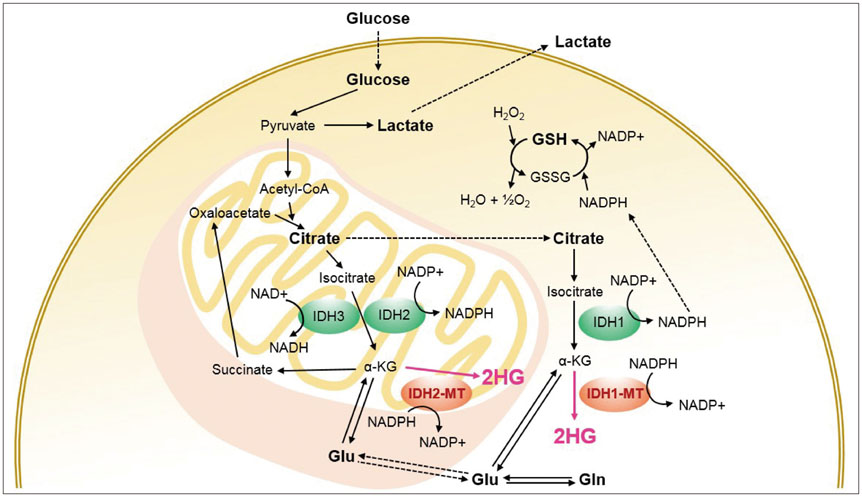
Fig. 1 Simplified metabolic pathways associated with isocitrate dehydrogenase (IDH) and 2-hydroxyglutarate (2HG). Mutations of IDH1 and IDH2 result in overproduction of 2HG. 1H-MRS-visible metabolites including 2HG are marked in bold. Acetyl-CoA = acetyl coenzyme A, Gln = glutamine, Glu = glutamate, GSH = glutathione, GSSG = glutathione disulfide, H2O = water, H2O2 = hydrogen peroxide, IDH-MT = mutant isocitrate dehydrogenase, NAD = nicotinamide adenine dinucleotide, NADH = nicotinamide adenine dinucleotide hydrate, NADP = nicotinamide adenine dinucleotide phosphate, NADPH = nicotinamide adenine dinucleotide phosphate hydrate, α-KG = alpha-ketoglutarate
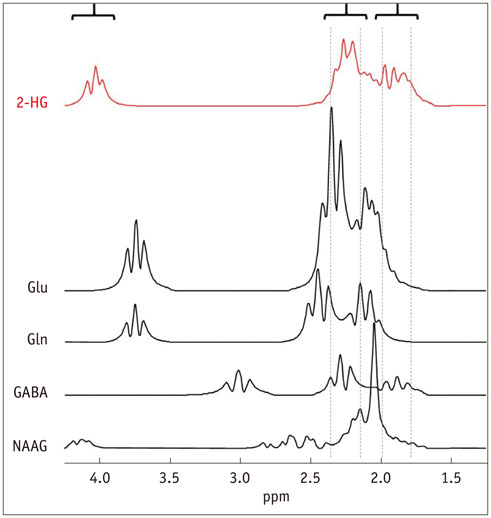
Fig. 2 Simulated spectra of 2HG and its background metabolites at 3T. Concentration ratio of 5:9.25:4.5:1.5:1.5 (mM) was assumed for 2HG:Glu:Gln:GABA:NAAG. Linewidth of all spectra were broadened to mimic in-vivo spectra. GABA = gamma-aminobutylic acid, Gln = glutamine, Glu = glutamate, NAAG = N-acetylaspartylglutamate, 2HG = 2-hydroxyglutarate
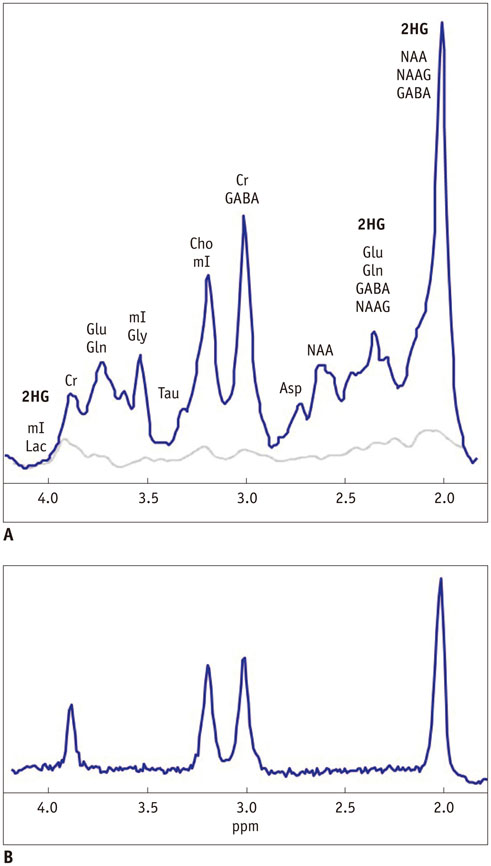
Fig. 3 Representative in-vivo spectra of normal human brain at 3T acquired at short TE (A) and long TE (B). Spectral baseline is also illustrated in A, which is typically assumed to be negligible in B. In B, spectrum consists mainly of Cr (~3.0 and ~3.9 ppm), Cho (~3.2 ppm), and NAA (~2.0 ppm) signals. Spectral locations of 2HG are also shown. Asp = aspartate, Cho = choline, Cr = creatine, GABA = gamma-aminobutylic acid, Gln = glutamine, Glu = glutamate, Gly = glycine, Lac = lactate, mI = myo-inositol, NAA = N-acetylaspartate, NAAG = N-acetylaspartylglutamate, Tau = taurine, TE = echo time, 2HG = 2-hydroxyglutarate
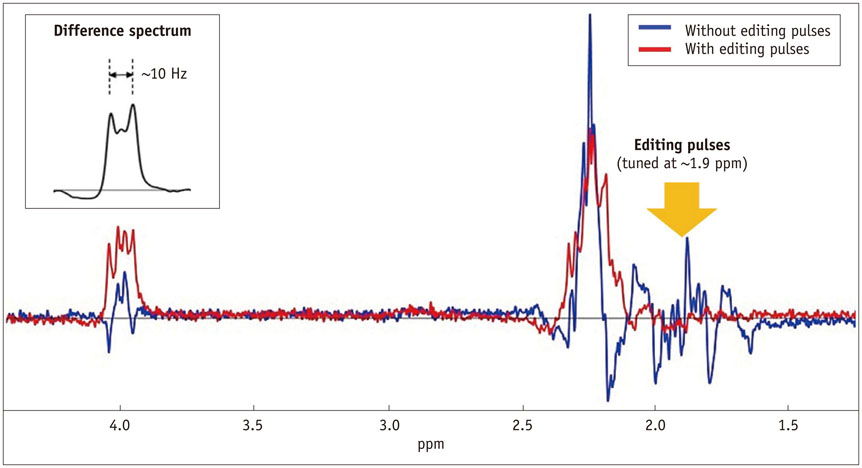
Fig. 4 Illustration of basic principle of difference editing method for 2HG editing in phantom at 3T. Spectra acquired with and without editing pulses that are tuned at ~1.9 ppm are shown in red and blue, respectively. By subtracting latter from former, edited 2HG signal is obtained at ~4.0 ppm in difference spectrum (shown in inset), which appears as doublet. Note that peak-to-peak distance of edited 2HG doublet is ~10 Hz at 3T. 2HG = 2-hydroxyglutarate

Fig. 5 Representative brain spectra of glioma patients by using short TE and long TE methods at 3T. Spectra from IDH-MT glioma patient (A, B) are compared with those from IDH-WT glioma patient (C, D). For all spectra, correct diagnostic results were obtained by LCModel (i.e., 2HG-positive for A and B, and 2HG-negative for C and D). Compared to spectra from normal human brain (Fig. 3), Cho/NAA ratios were substantially increased in these glioma patients. Cho = choline, Cr = creatine, GABA = gamma-aminobutylic acid, Gln = glutamine, Glu = glutamate, IDH-MT = isocitrate dehydrogenase-mutated, IDH-WT = isocitrate dehydrogenase wild-type, Lac = lactate, mI = myo-inositol, NAA = N-acetylaspartate, NAAG = N-acetylaspartylglutamate, TE = echo time, 2HG = 2-hydroxyglutarate
Reference
-
1. Law M, Yang S, Wang H, Babb JS, Johnson G, Cha S, et al. Glioma grading: sensitivity, specificity, and predictive values of perfusion MR imaging and proton MR spectroscopic imaging compared with conventional MR imaging. AJNR Am J Neuroradiol. 2003; 24:1989–1998.2. Möller-Hartmann W, Herminghaus S, Krings T, Marquardt G, Lanfermann H, Pilatus U, et al. Clinical application of proton magnetic resonance spectroscopy in the diagnosis of intracranial mass lesions. Neuroradiology. 2002; 44:371–381.3. Herholz K, Heindel W, Luyten PR, denHollander JA, Pietrzyk U, Voges J, et al. In vivo imaging of glucose consumption and lactate concentration in human gliomas. Ann Neurol. 1992; 31:319–327.4. Rock JP, Scarpace L, Hearshen D, Gutierrez J, Fisher JL, Rosenblum M, et al. Associations among magnetic resonance spectroscopy, apparent diffusion coefficients, and image-guided histopathology with special attention to radiation necrosis. Neurosurgery. 2004; 54:1111–1117. discussion 1117-1119.5. Verma N, Cowperthwaite MC, Burnett MG, Markey MK. Differentiating tumor recurrence from treatment necrosis: a review of neuro-oncologic imaging strategies. Neuro Oncol. 2013; 15:515–534.6. Blüml S, Panigrahy A, Laskov M, Dhall G, Krieger MD, Nelson MD, et al. Elevated citrate in pediatric astrocytomas with malignant progression. Neuro Oncol. 2011; 13:1107–1117.7. Howe FA, Barton SJ, Cudlip SA, Stubbs M, Saunders DE, Murphy M, et al. Metabolic profiles of human brain tumors using quantitative in vivo 1H magnetic resonance spectroscopy. Magn Reson Med. 2003; 49:223–232.8. Majós C, Alonso J, Aguilera C, Serrallonga M, Pérez-Martín J, Acebes JJ, et al. Proton magnetic resonance spectroscopy ((1) H MRS) of human brain tumours: assessment of differences between tumour types and its applicability in brain tumour categorization. Eur Radiol. 2003; 13:582–591.9. Zonari P, Baraldi P, Crisi G. Multimodal MRI in the characterization of glial neoplasms: the combined role of single-voxel MR spectroscopy, diffusion imaging and echo-planar perfusion imaging. Neuroradiology. 2007; 49:795–803.10. Parsons DW, Jones S, Zhang X, Lin JC, Leary RJ, Angenendt P, et al. An integrated genomic analysis of human glioblastoma multiforme. Science. 2008; 321:1807–1812.11. Yan H, Parsons DW, Jin G, McLendon R, Rasheed BA, Yuan W, et al. IDH1 and IDH2 mutations in gliomas. N Engl J Med. 2009; 360:765–773.12. Dang L, White DW, Gross S, Bennett BD, Bittinger MA, Driggers EM, et al. Cancer-associated IDH1 mutations produce 2-hydroxyglutarate. Nature. 2009; 462:739–744.13. Andronesi OC, Rapalino O, Gerstner E, Chi A, Batchelor TT, Cahill DP, et al. Detection of oncogenic IDH1 mutations using magnetic resonance spectroscopy of 2-hydroxyglutarate. J Clin Invest. 2013; 123:3659–3663.14. Pope WB, Prins RM, Albert Thomas M, Nagarajan R, Yen KE, Bittinger MA, et al. Non-invasive detection of 2-hydroxyglutarate and other metabolites in IDH1 mutant glioma patients using magnetic resonance spectroscopy. J Neurooncol. 2012; 107:197–205.15. Andronesi OC, Kim GS, Gerstner E, Batchelor T, Tzika AA, Fantin VR, et al. Detection of 2-hydroxyglutarate in IDH-mutated glioma patients by in vivo spectral-editing and 2D correlation magnetic resonance spectroscopy. Sci Transl Med. 2012; 4:116ra4.16. Choi C, Ganji SK, DeBerardinis RJ, Hatanpaa KJ, Rakheja D, Kovacs Z, et al. 2-hydroxyglutarate detection by magnetic resonance spectroscopy in IDH-mutated patients with gliomas. Nat Med. 2012; 18:624–629.17. Choi C, Ganji S, Hulsey K, Madan A, Kovacs Z, Dimitrov I, et al. A comparative study of short- and long-TE 1H MRS at 3 T for in vivo detection of 2-hydroxyglutarate in brain tumors. NMR Biomed. 2013; 26:1242–1250.18. Natsumeda M, Igarashi H, Nomura T, Ogura R, Tsukamoto Y, Kobayashi T, et al. Accumulation of 2-hydroxyglutarate in gliomas correlates with survival: a study by 3.0-tesla magnetic resonance spectroscopy. Acta Neuropathol Commun. 2014; 2:158.19. de la Fuente MI, Young RJ, Rubel J, Rosenblum M, Tisnado J, Briggs S, et al. Integration of 2-hydroxyglutarate-proton magnetic resonance spectroscopy into clinical practice for disease monitoring in isocitrate dehydrogenase-mutant glioma. Neuro Oncol. 2016; 18:283–290.20. Lazovic J, Soto H, Piccioni D, Lou JR, Li S, Mirsadraei L, et al. Detection of 2-hydroxyglutaric acid in vivo by proton magnetic resonance spectroscopy in U87 glioma cells overexpressing isocitrate dehydrogenase-1 mutation. Neuro Oncol. 2012; 14:1465–1472.21. Emir UE, Larkin SJ, de Pennington N, Voets N, Plaha P, Stacey R, et al. Noninvasive quantification of 2-hydroxyglutarate in human gliomas with IDH1 and IDH2 mutations. Cancer Res. 2016; 76:43–49.22. Heo H, Kim S, Lee HH, Cho HR, Xu WJ, Lee SH, et al. On the utility of short echo time (TE) single voxel 1H-MRS in non-invasive detection of 2-hydroxyglutarate (2HG); challenges and potential improvement illustrated with animal models using MRUI and LCModel. PLoS One. 2016; 11:e0147794.23. Yen KE, Bittinger MA, Su SM, Fantin VR. Cancer-associated IDH mutations: biomarker and therapeutic opportunities. Oncogene. 2010; 29:6409–6417.24. Esmaeili M, Vettukattil R, Bathen TF. 2-hydroxyglutarate as a magnetic resonance biomarker for glioma subtyping. Transl Oncol. 2013; 6:92–98.25. Chaumeil MM, Larson PE, Woods SM, Cai L, Eriksson P, Robinson AE, et al. Hyperpolarized [1-13C] glutamate: a metabolic imaging biomarker of IDH1 mutational status in glioma. Cancer Res. 2014; 74:4247–4257.26. Tönjes M, Barbus S, Park YJ, Wang W, Schlotter M, Lindroth AM, et al. BCAT1 promotes cell proliferation through amino acid catabolism in gliomas carrying wild-type IDH1. Nat Med. 2013; 19:901–908.27. Shi J, Sun B, Shi W, Zuo H, Cui D, Ni L, et al. Decreasing GSH and increasing ROS in chemosensitivity gliomas with IDH1 mutation. Tumour Biol. 2015; 36:655–662.28. Marin-Valencia I, Yang C, Mashimo T, Cho S, Baek H, Yang XL, et al. Analysis of tumor metabolism reveals mitochondrial glucose oxidation in genetically diverse human glioblastomas in the mouse brain in vivo. Cell Metab. 2012; 15:827–837.29. de Graaf RA. In vivo NMR spectroscopy: principles and techniques. 2nd ed. Chichester: John Wiley & Sons;2007. p. 26–32.30. Allen PS, Thompson RB, Wilman AH. Metabolite-specific NMR spectroscopy in vivo. NMR Biomed. 1997; 10:435–444.31. Govindaraju V, Young K, Maudsley AA. Proton NMR chemical shifts and coupling constants for brain metabolites. NMR Biomed. 2000; 13:129–153.32. Bottomley PA. Selective volume method for performing localized NMR spectroscopy. United States patent US. 4480228. 1984. 10. 30.33. Frahm J, Bruhn H, Gyngell ML, Merboldt KD, Hänicke W, Sauter R. Localized high-resolution proton NMR spectroscopy using stimulated echoes: initial applications to human brain in vivo. Magn Reson Med. 1989; 9:79–93.34. Behar KL, Rothman DL, Spencer DD, Petroff OA. Analysis of macromolecule resonances in 1H NMR spectra of human brain. Magn Reson Med. 1994; 32:294–302.35. Seeger U, Klose U, Mader I, Grodd W, Nägele T. Parameterized evaluation of macromolecules and lipids in proton MR spectroscopy of brain diseases. Magn Reson Med. 2003; 49:19–28.36. Auer DP, Gössl C, Schirmer T, Czisch M. Improved analysis of 1H-MR spectra in the presence of mobile lipids. Magn Reson Med. 2001; 46:615–618.37. Hofmann L, Slotboom J, Jung B, Maloca P, Boesch C, Kreis R. Quantitative 1H-magnetic resonance spectroscopy of human brain: influence of composition and parameterization of the basis set in linear combination model-fitting. Magn Reson Med. 2002; 48:440–453.38. Provencher SW. Estimation of metabolite concentrations from localized in vivo proton NMR spectra. Magn Reson Med. 1993; 30:672–679.39. Cudalbu C, Mlynárik V, Gruetter R. Handling macromolecule signals in the quantification of the neurochemical profile. J Alzheimers Dis. 2012; 31:Suppl 3. S101–S115.40. Penner J, Bartha R. Semi-LASER 1 H MR spectroscopy at 7 Tesla in human brain: metabolite quantification incorporating subject-specific macromolecule removal. Magn Reson Med. 2015; 74:4–12.41. Kim H, Thompson RB, Hanstock CC, Allen PS. Variability of metabolite yield using STEAM or PRESS sequences in vivo at 3.0 T, illustrated with myo-inositol. Magn Reson Med. 2005; 53:760–769.42. Thompson RB, Allen PS. A new multiple quantum filter design procedure for use on strongly coupled spin systems found in vivo: its application to glutamate. Magn Reson Med. 1998; 39:762–771.43. Sørensen OW, Eich GW, Levitt MH, Bodenhausen G, Ernst RR. Product operator-formalism for the description of NMR pulse experiments. Prog NMR Spectrosc. 1983; 16:163–192.44. Young K, Govindaraju V, Soher BJ, Maudsley AA. Automated spectral analysis I: formation of a priori information by spectral simulation. Magn Reson Med. 1998; 40:812–815.45. Young K, Soher BJ, Maudsley AA. Automated spectral analysis II: application of wavelet shrinkage for characterization of non-parameterized signals. Magn Reson Med. 1998; 40:816–821.46. Thompson RB, Allen PS. Sources of variability in the response of coupled spins to the PRESS sequence and their potential impact on metabolite quantification. Magn Reson Med. 1999; 41:1162–1169.47. Li Y, Srinivasan R, Ratiney H, Lu Y, Chang SM, Nelson SJ. Comparison of T(1) and T(2) metabolite relaxation times in glioma and normal brain at 3T. J Magn Reson Imaging. 2008; 28:342–350.48. Lange T, Dydak U, Roberts TP, Rowley HA, Bjeljac M, Boesiger P. Pitfalls in lactate measurements at 3T. AJNR Am J Neuroradiol. 2006; 27:895–901.49. Mescher M, Merkle H, Kirsch J, Garwood M, Gruetter R. Simultaneous in vivo spectral editing and water suppression. NMR Biomed. 1998; 11:266–272.50. Rothman DL, Behar KL, Hetherington HP, Shulman RG. Homonuclear 1H double-resonance difference spectroscopy of the rat brain in vivo. Proc Natl Acad Sci U S A. 1984; 81:6330–6334.51. Hetherington HP, Avison MJ, Shulman RG. 1H homonuclear editing of rat brain using semiselective pulses. Proc Natl Acad Sci U S A. 1985; 82:3115–3118.52. Ernst RR, Bodenhausen G, Wokaun A. Principles of nuclear magnetic resonance in one and two dimensions. Oxford: Oxford University Press;1987. p. 400–427.53. Aue WP, Bartholdi E, Ernst RR. Two-dimensional spectroscopy. Application to nuclear magnetic resonance. J Chem Phys. 1976; 64:2229–2246.54. Provencher SW. LCModel & LCMgui user's manual. Web site. Accessed January 5, 2016. http://s-provencher.com/pub/LCModel/manual/manual.pdf.55. Opstad KS, Bell BA, Griffiths JR, Howe FA. Toward accurate quantification of metabolites, lipids, and macromolecules in HRMAS spectra of human brain tumor biopsies using LCModel. Magn Reson Med. 2008; 60:1237–1242.56. Naressi A, Couturier C, Devos JM, Janssen M, Mangeat C, de Beer R, et al. Java-based graphical user interface for the MRUI quantitation package. MAGMA. 2001; 12:141–152.57. Cavassila S, Deval S, Huegen C, van Ormondt D, Graveron-Demilly D. Cramér-Rao bounds: an evaluation tool for quantitation. NMR Biomed. 2001; 14:278–283.58. Reitman ZJ, Jin G, Karoly ED, Spasojevic I, Yang J, Kinzler KW, et al. Profiling the effects of isocitrate dehydrogenase 1 and 2 mutations on the cellular metabolome. Proc Natl Acad Sci U S A. 2011; 108:3270–3275.59. Terunuma A, Putluri N, Mishra P, Mathé EA, Dorsey TH, Yi M, et al. MYC-driven accumulation of 2-hydroxyglutarate is associated with breast cancer prognosis. J Clin Invest. 2014; 124:398–412.60. Mardis ER, Ding L, Dooling DJ, Larson DE, McLellan MD, Chen K, et al. Recurring mutations found by sequencing an acute myeloid leukemia genome. N Engl J Med. 2009; 361:1058–1066.61. Struys EA, Salomons GS, Achouri Y, Van Schaftingen E, Grosso S, Craigen WJ, et al. Mutations in the D-2-hydroxyglutarate dehydrogenase gene cause D-2-hydroxyglutaric aciduria. Am J Hum Genet. 2005; 76:358–360.62. Green A, Beer P. Somatic mutations of IDH1 and IDH2 in the leukemic transformation of myeloproliferative neoplasms. N Engl J Med. 2010; 362:369–370.63. Ward PS, Patel J, Wise DR, Abdel-Wahab O, Bennett BD, Coller HA, et al. The common feature of leukemia-associated IDH1 and IDH2 mutations is a neomorphic enzyme activity converting alpha-ketoglutarate to 2-hydroxyglutarate. Cancer Cell. 2010; 17:225–234.64. Kang MR, Kim MS, Oh JE, Kim YR, Song SY, Seo SI, et al. Mutational analysis of IDH1 codon 132 in glioblastomas and other common cancers. Int J Cancer. 2009; 125:353–355.65. Sjöblom T, Jones S, Wood LD, Parsons DW, Lin J, Barber TD, et al. The consensus coding sequences of human breast and colorectal cancers. Science. 2006; 314:268–274.66. Lopez GY, Reitman ZJ, Solomon D, Waldman T, Bigner DD, McLendon RE, et al. IDH1(R132) mutation identified in one human melanoma metastasis, but not correlated with metastases to the brain. Biochem Biophys Res Commun. 2010; 398:585–587.
- Full Text Links
-
- Actions
-
Cited
- CITED
-
- Close
- Share
-
- Similar articles
-
- Comparison of in Vivo, in Vitro 3T MR Spectroscopy and Proton NMR Spectroscopy for the Fluid from Cystic Tumor: Preliminary Study
- Determination of serum isocitrate dehydrogenase activities in thedifferentation of contrilobular from periportal hepatic necrosis in rats
- Feasibility of In vivo Proton Magnetic Resonance Spectroscopy for Lung Cancer
- Identification of a New Selective Chemical Inhibitor of Mutant Isocitrate Dehydrogenase-1
- Use of in vivo magnetic resonance spectroscopy for studying metabolic diseases
