Nat Prod Sci.
2018 Sep;24(3):164-170. 10.20307/nps.2018.24.3.164.
Classficiation of Bupleuri Radix according to Geographical Origins using Near Infrared Spectroscopy (NIRS) Combined with Supervised Pattern Recognition
- Affiliations
-
- 1College of Pharmacy and Research Institute of Pharmaceutical Science, Seoul National University, Seoul 151-742, Republic of Korea. shsung@snu.ac.kr
- 2College of Pharmacy, Sookmyung Women's University, Seoul 04310, Republic of Korea.
- 3College of Pharmacy, Dongduk Women's University, Seoul 136-714, Republic of Korea.
- KMID: 2422008
- DOI: http://doi.org/10.20307/nps.2018.24.3.164
Abstract
- Rapid geographical classification of Bupleuri Radix is important in quality control. In this study, near infrared spectroscopy (NIRS) combined with supervised pattern recognition was attempted to classify Bupleuri Radix according to geographical origins. Three supervised pattern recognitions methods, partial least square discriminant analysis (PLS-DA), quadratic discriminant analysis (QDA) and radial basis function support vector machine (RBF-SVM), were performed to establish the classification models. The QDA and RBF-SVM models were performed based on principal component analysis (PCA). The number of principal components (PCs) was optimized by cross-validation in the model. The results showed that the performance of the QDA model is the optimum among the three models. The optimized QDA model was obtained when 7 PCs were used; the classification rates of the QDA model in the training and test sets are 97.8% and 95.2% respectively. The overall results showed that NIRS combined with supervised pattern recognition could be applied to classify Bupleuri Radix according to geographical origin.
Keyword
MeSH Terms
Figure
-
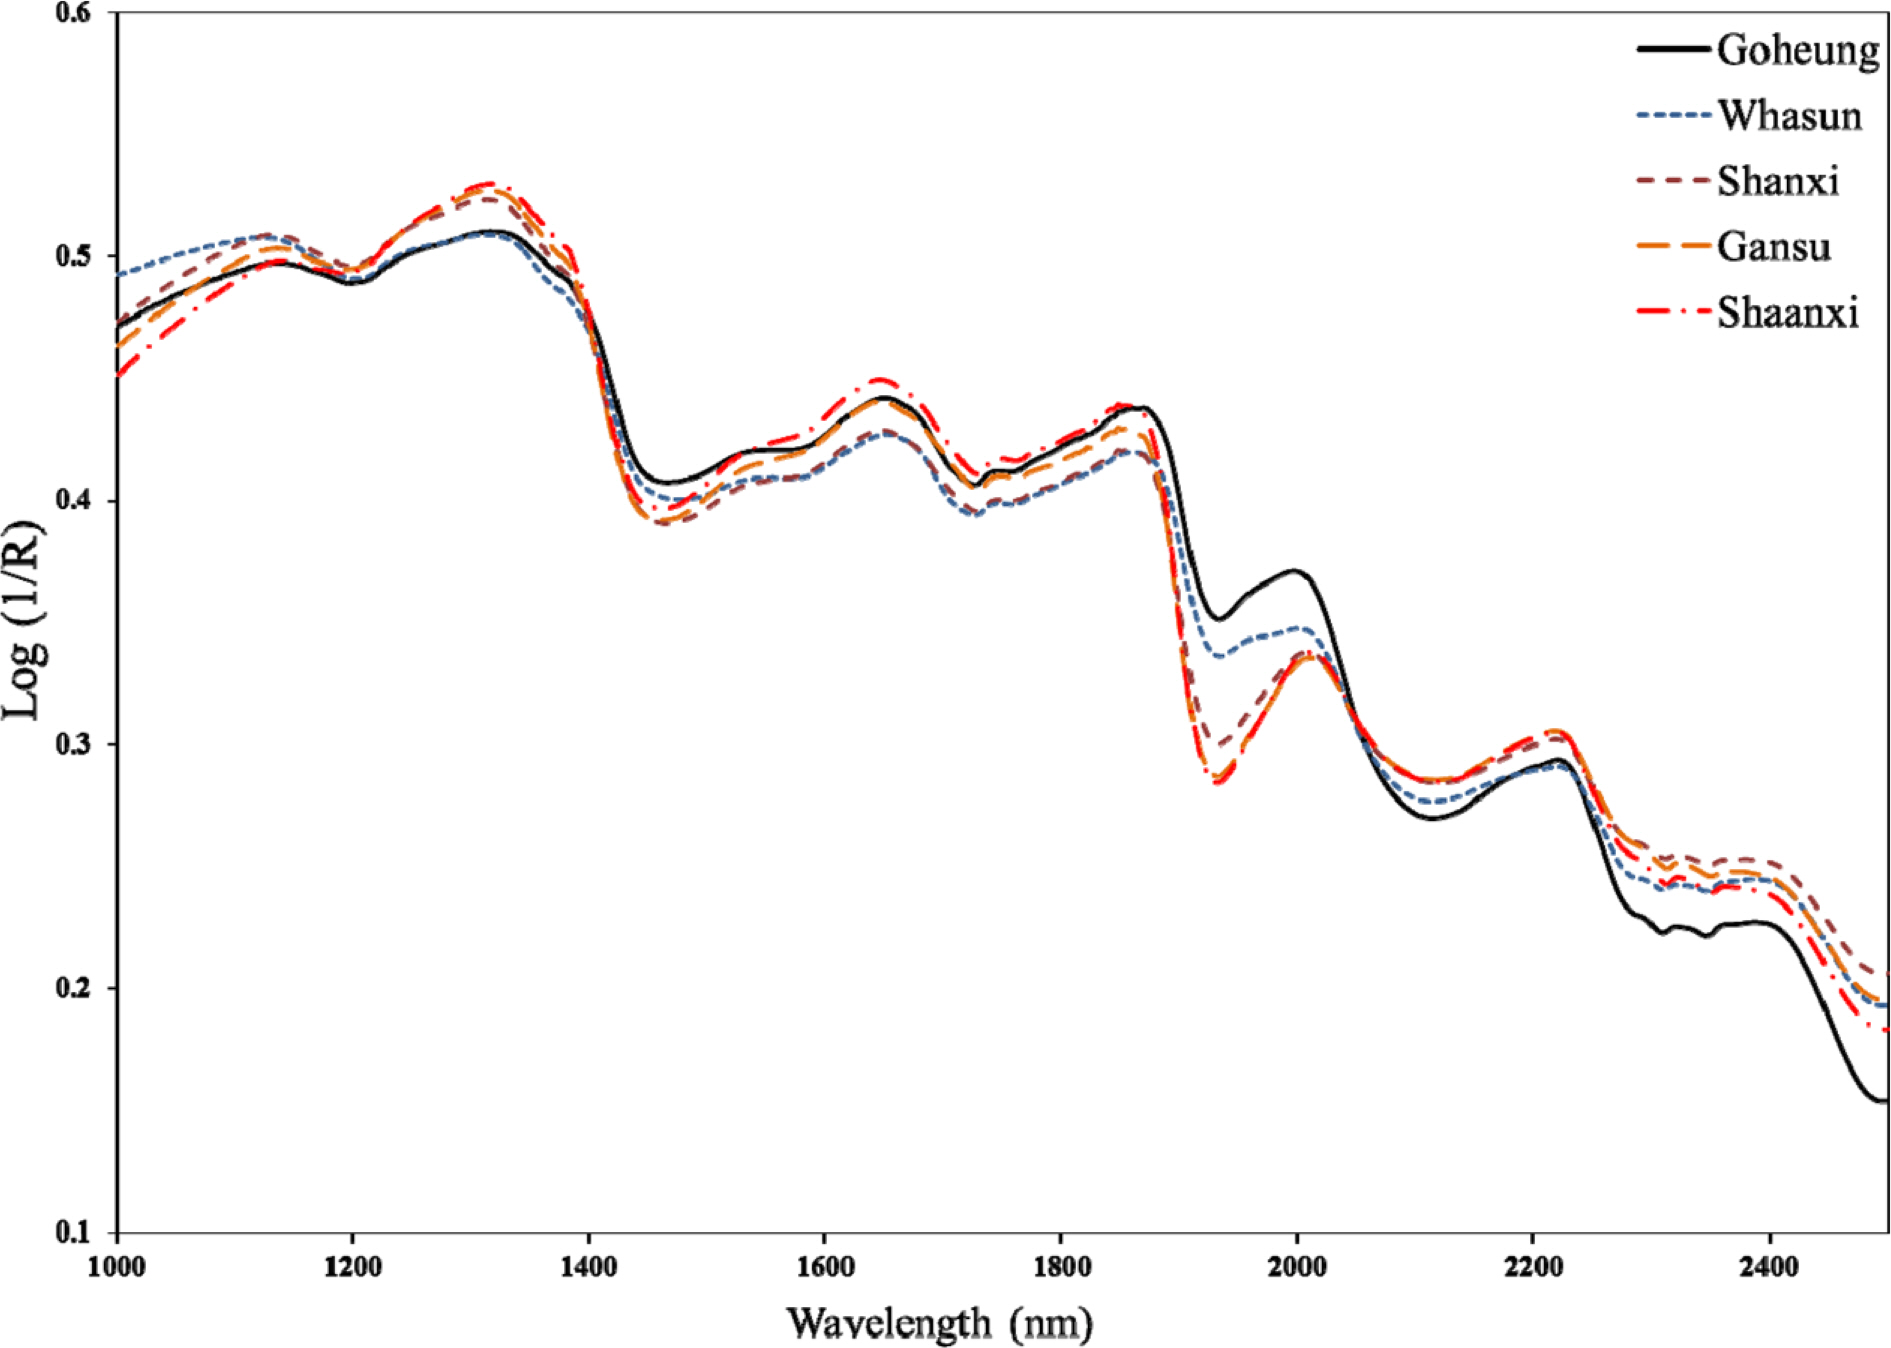
Fig. 1. Average NIR reflectance specrtra of Bupleuri Radix obtained from raw data.

Fig. 2. Average NIR reflectance specrtra of Bupleuri Radix with 2nd derivative preprocessing.
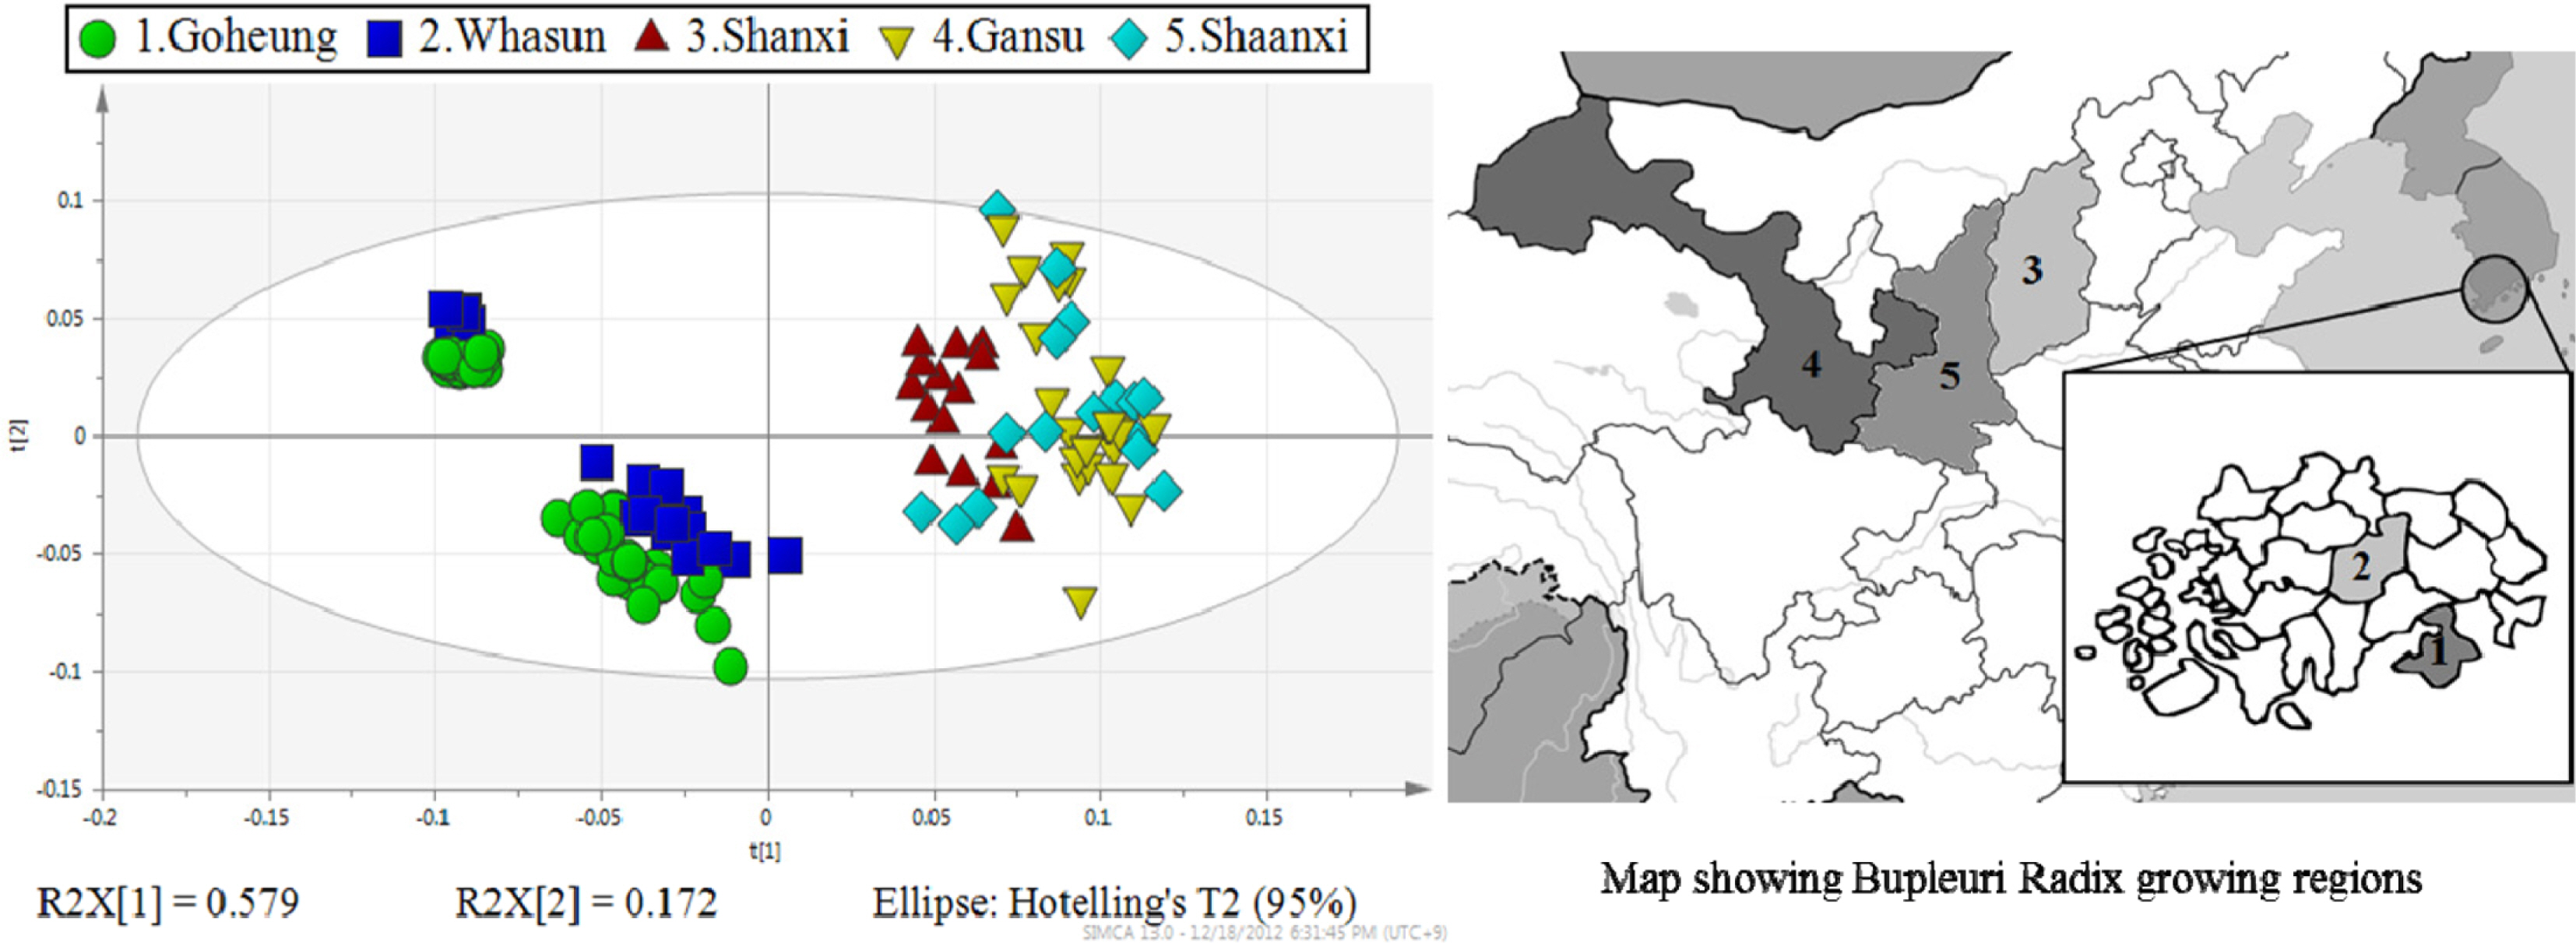
Fig. 3. Two dimensional score plot of the top two principal components (PCs) for all samples.
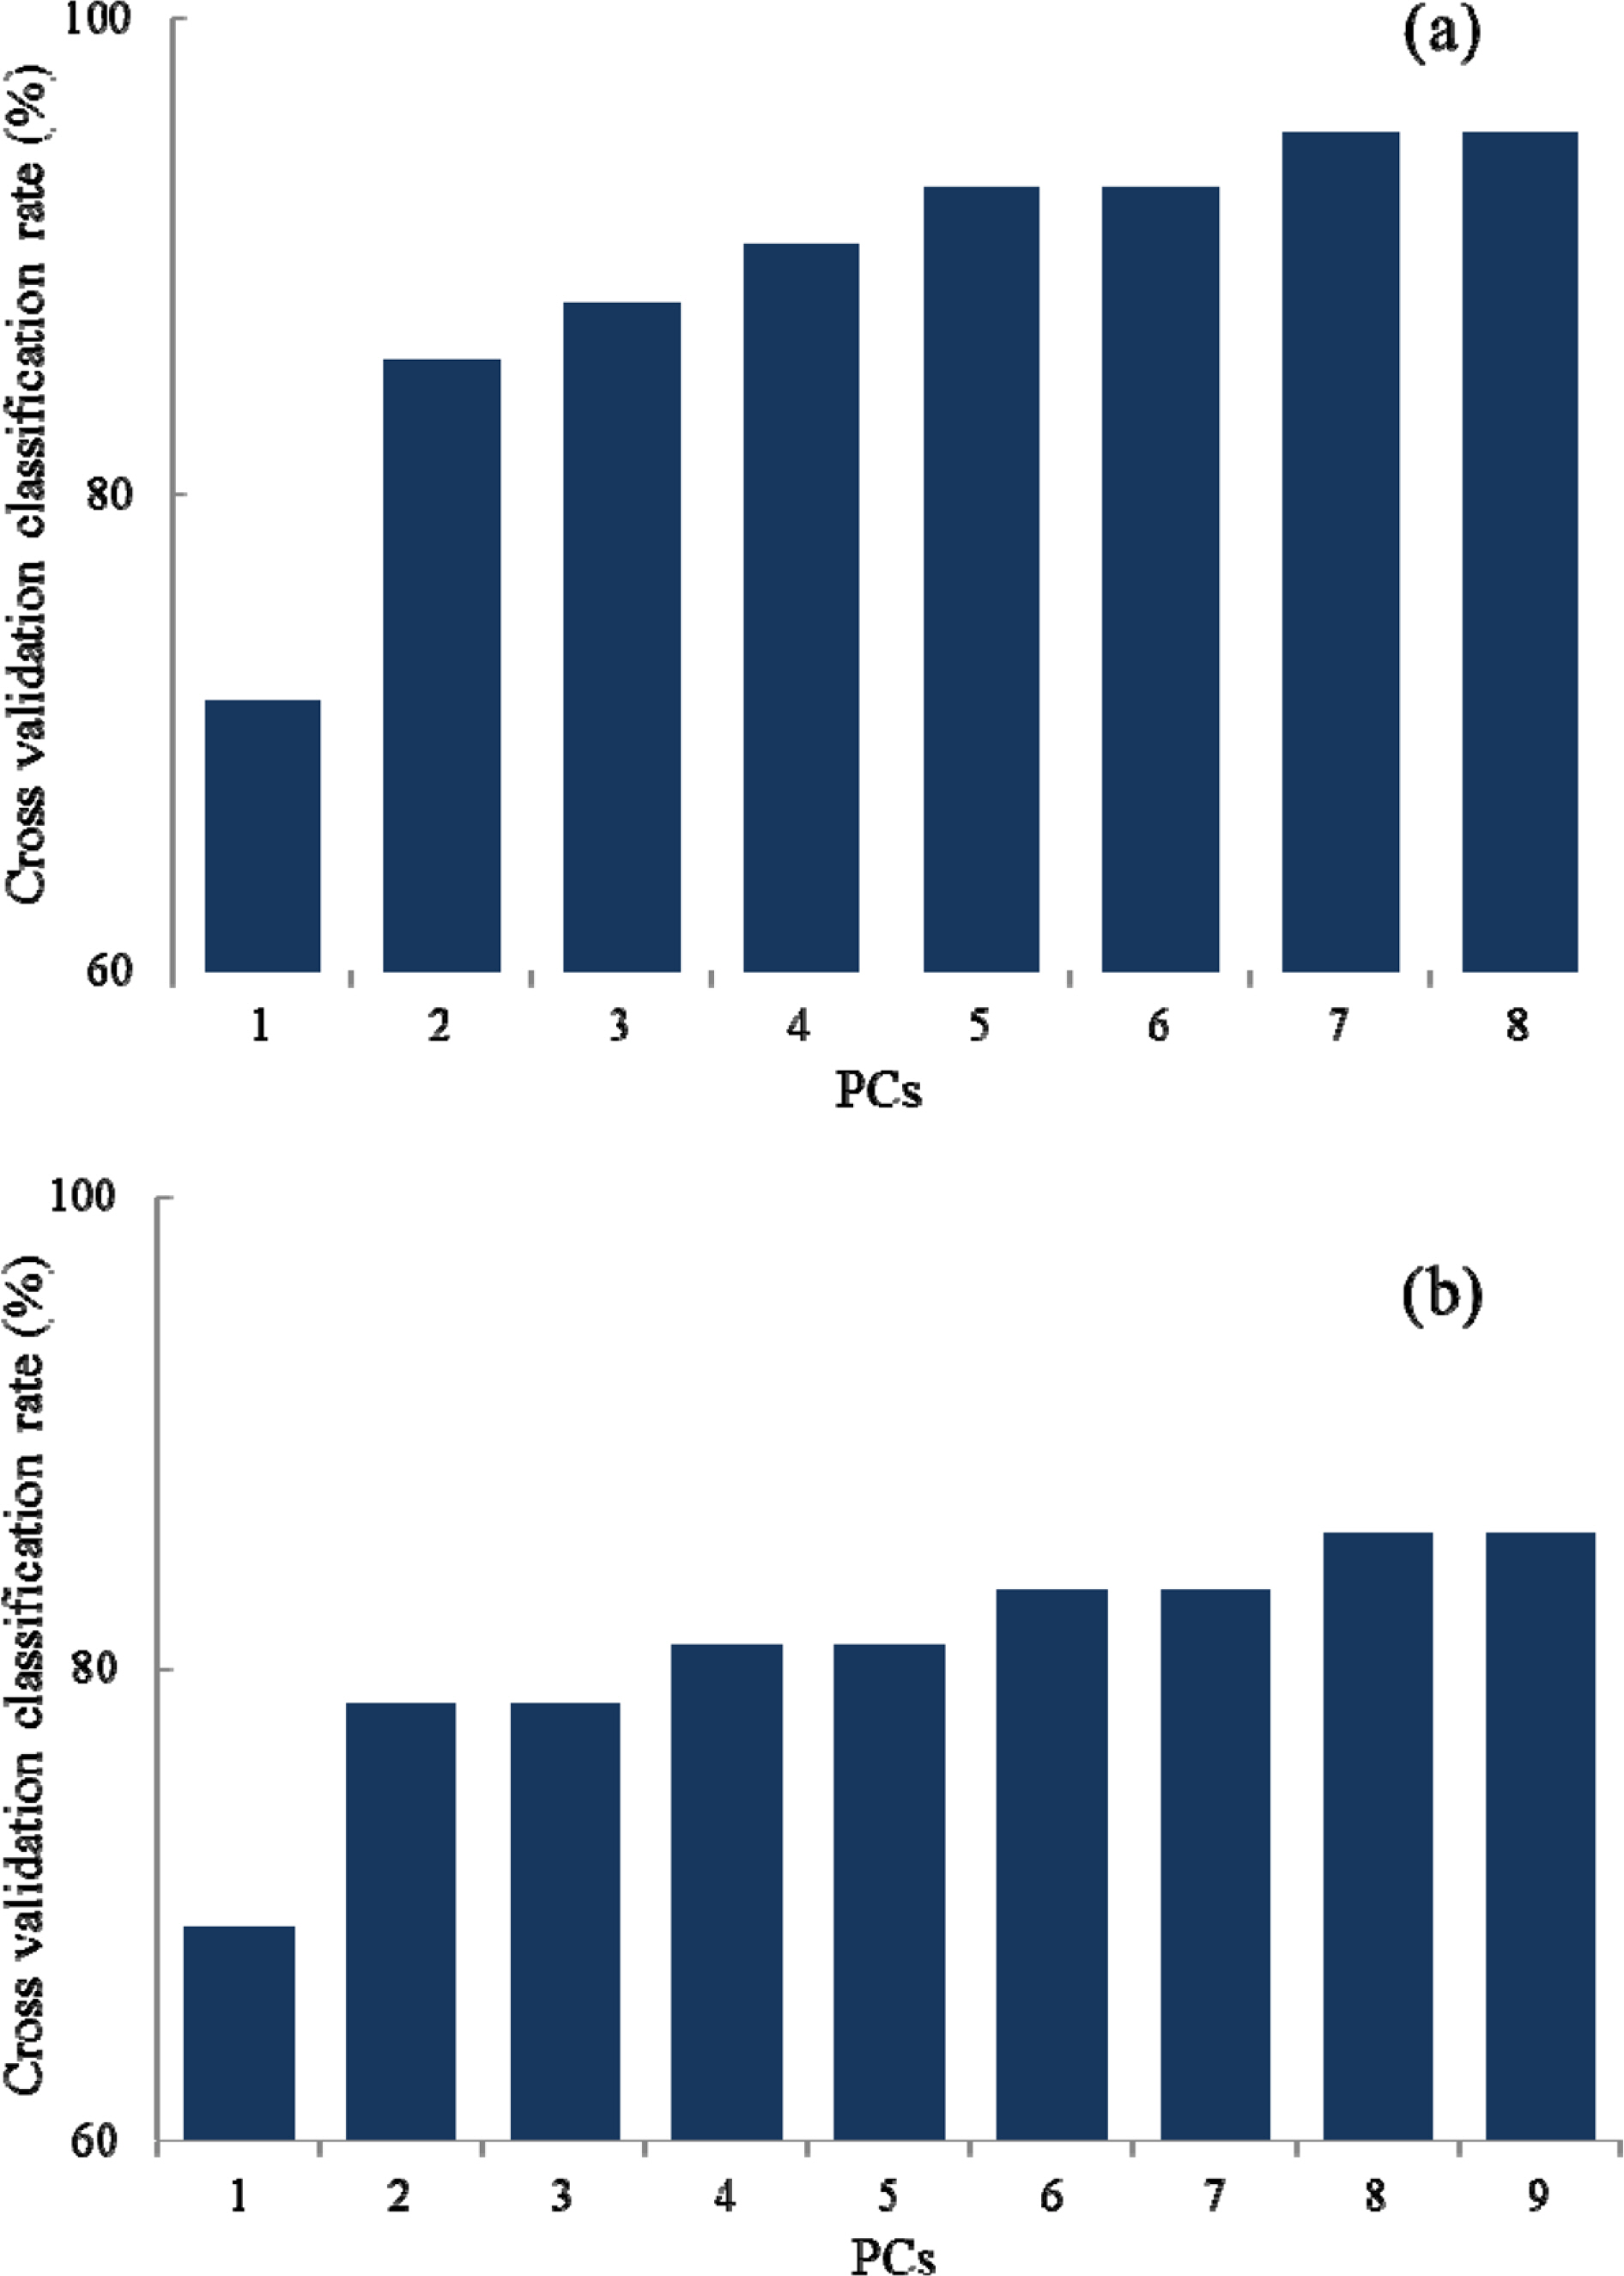
Fig. 4. Cross validation classification rates of QDA (a) and RBF-SVM (b) models at different PCs.
Reference
-
(1). Ashour M. L., Wink M. J.Pharm. Pharmacol. 2011; 63:305–321.(2). Bermejo Benito P., Abad Martínez M. J., Silván Sen A. M., Sanz Gómez A., Fernández Matellano L., Sánchez Contreras S., Díaz Lanza A. M.Life Sci. 1998; 63:1147–1156.(3). Cheng X. Q., Li H., Yue X. L., Xie J. Y., Zhang Y. Y., Di H. Y., Chen D. F. J.Ethnopharmacol. 2010; 130:363–368.(4). Sun X. B., Matsumoto T., Yamada H. J.Pharm. Pharmacol. 1991; 43:699–704.(5). Wen S., Huifu X., Hao H.Immunopharmacol. Immunotoxicol. 2011; 33:433–437.(6). Zhu L., Liang Z. T., Yi T., Ma Y., Zhao Z. Z., Guo B. L., Zhang J. Y., Chen H. B.BMC Complement. Altern. Med. 2017; 17:305–316.(7). Li X., Jia Y., Song A., Chen X., Bi K.Yakugaku Zasshi. 2005; 125:815–819.(8). Bao Y., Li C., Shen H., Nan F.Anal. Chem. 2004; 76:4208–4216.(9). Liau B. C., Hsiao S. S., Lee M. R., Jong T. T., Chiang S. T. J.Pharm. Biomed. Anal. 2007; 43:1174–1178.(10). Lee J., Yang D. H., Suh J. H., Kim U., Eom H. Y., Kim J., Lee M. Y., Kim J., Han S. B. J. Chromatogr. B.Analyt. Technol. Biomed. Life Sci. 2011; 879:3887–3895.(11). Huang H. Q., Su J., Zhang X., Shan L., Zhang W. D. J.Chromatogr. A. 2011; 1218:1131–1138.(12). Tian R. T., Xie P. S., Liu H. P. J.Chromatogr. A. 2009; 1216:2150–2155.(13). Qin X., Dai Y., Liu N. Q., Li Z., Liu X., Hu J., Choi Y. H., Verpoorte R.Planta Med. 2012; 78:926–933.(14). Lin X., Xue L., Zhang H., Zhu C.Anal. Bioanal. Chem. 2005; 382:1610–1615.(15). Gong F., Wang B. T., Chau F. T., Liang Y. Z.Anal. Lett. 2005; 38:2475–2492.(16). McGoverin C. M., Weeranantanaphan J., Downey G., Manley M. J.Near Infrared Spec. 2010; 18:87–111.(17). Chen Y., Xie M. Y., Yan Y., Zhu S. B., Nie S. P., Li C., Wang Y. X., Gong X. F.Anal. Chim. Acta. 2008; 618:121–130.(18). Luo X. F., Yu, X.;Wu, X. M.;Cheng, H. B.;Qu H. B.Microchem. J. 2008; 90:8–12.(19). Wang L., Lee F. S. C., Wang X.LWT-Food Sci. Technol. 2007; 40:83–88.(20). Chen Q., Zhao J., Lin H. Spectrochim.Acta A. Mol. Biomol. Spectrosc. 2009; 72:845–850.(21). Lin H., Zhao J., Chen Q., Zhou F., Sun L. Spectrochim Acta. A.Mol. Biomol. Spectrosc. 2011; 79:1381–1385.(22). Lee D. Y., Kim S. H., Kim Y. C., Kim H. J., Sung S. H.Microchem. J. 2011; 99:213–217.(23). Berrueta L. A., Alonso-Salces R. M., Héberger K.J. Chromatogr. A. 2007; 1158:196–214.(24). Li B., Wei Y., Duan H., Xi L., Wu X.Vib. Spectrosc. 2012; 62:17–22.(25). Chiang L. H., Russell E. L., Braatz R. D.Chemometrics Intell. Lab. Syst. 2000; 50:243–252.(26). Jiang H., Liu G. H., Xiao X., Yu S., Mei C., Ding Y.Food Anal. Methods. 2012; 5:928–934.(27). Luts J., Ojeda F., Van de Plas R., De Moor B., Van Huffel S., Suykens J. A.Anal. Chim. Acta. 2010; 665:129–145.(28). Ballabio D., Consonni V.Anal. Methods. 2013; 5:3790–3798.(29). Rubin T. N., Chambers A., Smyth P., Steyvers M.Mach. Learn. 2012; 88:157–208.
- Full Text Links
-
- Actions
-
Cited
- CITED
-
- Close
- Share
-
- Similar articles
-
- Application of near-infrared spectroscopy in clinical neurology
- Near-Infrared Spectroscopy versus Transcranial Doppler-Based Monitoring in Carotid Endarterectomy
- Evaluation of distal skin temperature and tissue oxygen saturation determined by near-infrared spectroscopy for predicting ultrasound-guided lateral infraclavicular block success
- Comparison between Regional Cerebral Oxygen Saturation and Jugular Bulb Venous Oxygen Saturation in Patients Undergoing OPCAB Surgery
- Application of Near-Infrared Spectroscopy in Neurological Disorders: Especially in Orthostatic Intolerance
