Associations between gene expression profiles of invasive breast cancer and Breast Imaging Reporting and Data System MRI lexicon
- Affiliations
-
- 1Department of Radiology, Inha University Hospital, Inha University School of Medicine, Incheon, Korea.
- 2Department of Surgery, Inha University Hospital, Inha University School of Medicine, Incheon, Korea.
- 3Department of Surgery, Severance Hospital, Yonsei University College of Medicine, Seoul, Korea. bsmin@yuhs.ac
- KMID: 2392279
- DOI: http://doi.org/10.4174/astr.2017.93.1.18
Abstract
- PURPOSE
To evaluate whether the Breast Imaging Reporting and Data System (BI-RADS) MRI lexicon could reflect the genomic information of breast cancers and to suggest intuitive imaging features as biomarkers.
METHODS
Matched breast MRI data from The Cancer Imaging Archive and gene expression profile from The Cancer Genome Atlas of 70 invasive breast cancers were analyzed. Magnetic resonance images were reviewed according to the BI-RADS MRI lexicon of mass morphology. The cancers were divided into 2 groups of gene clustering by gene set enrichment an alysis. Clinicopathologic and imaging characteristics were compared between the 2 groups.
RESULTS
The luminal subtype was predominant in the group 1 gene set and the triple-negative subtype was predominant in the group 2 gene set (55 of 56, 98.2% vs. 9 of 14, 64.3%). Internal enhancement descriptors were different between the 2 groups; heterogeneity was most frequent in group 1 (27 of 56, 48.2%) and rim enhancement was dominant in group 2 (10 of 14, 71.4%). In group 1, the gene sets related to mammary gland development were overexpressed whereas the gene sets related to mitotic cell division were overexpressed in group 2.
CONCLUSION
We identified intuitive imaging features of breast MRI associated with distinct gene expression profiles using the standard imaging variables of BI-RADS. The internal enhancement pattern on MRI might reflect specific gene expression profiles of breast cancers, which can be recognized by visual distinction.
Figure
-

Fig. 1 Unsupervised hierarchical clustering and a heatmap of gene expression profile of all samples. The top row shows dendrogram cluster 2 major groups. The next row indicates cluster classification of groups 1 (black) and 2 (red). The rows below the heatmap indicates clinicopathologic and breast MRI characteristics.

Fig. 2 Axial T1-weighted contrast-enhanced subtraction MR images of women classified into groups 1 (A) and 2 (B). (A) A 73-year-old woman with luminal cancer in her left lower outer quadrant breast shows irregular mass with irregular margin and hetero geneous internal enhancement pattern. (B) A 51-year-old woman with triple-negative cancer in her right upper outer quadrant breast shows irregular mass with specular margin and rim enhancement.
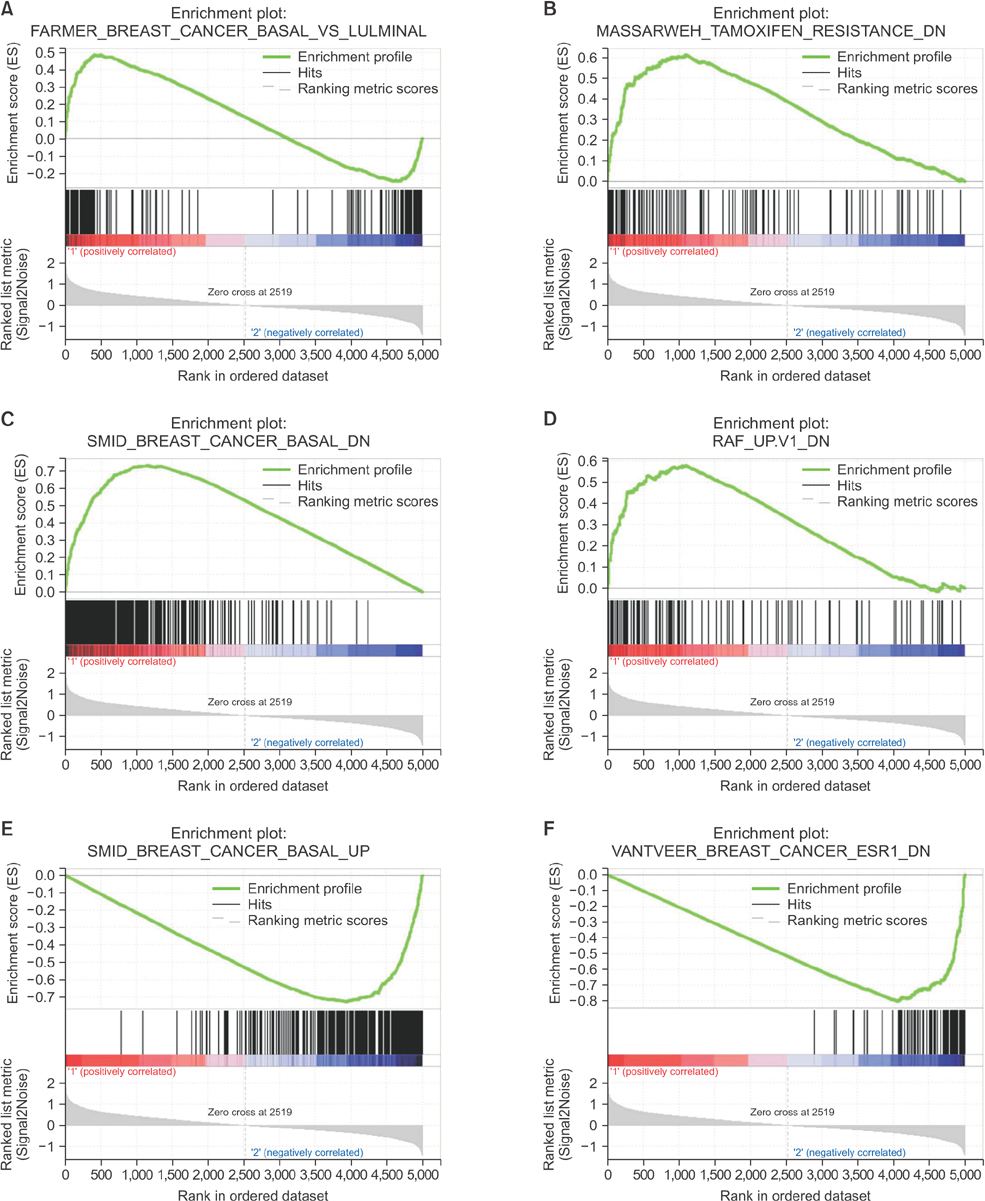
Fig. 3 Enrichment plots of top gene sets (signatures) for groups 1 (A–D) and 2 (E, F). In each plot, enrichment score (ES) is the maximum deviation from zero encountered in running down the rank list (middle). The bottom portion of each plot shows the value of the ranking metric which is signal-to-noise ratio in this analysis.
Cited by 1 articles
-
Imaging features of breast cancer molecular subtypes: state of the art
Nariya Cho
J Pathol Transl Med. 2021;55(1):16-25. doi: 10.4132/jptm.2020.09.03.
Reference
-
1. Voduc KD, Cheang MC, Tyldesley S, Gelmon K, Nielsen TO, Kennecke H. Breast cancer subtypes and the risk of local and regional relapse. J Clin Oncol. 2010; 28:1684–1691.2. Trop I, LeBlanc SM, David J, Lalonde L, Tran-Thanh D, Labelle M, et al. Molecular classification of infiltrating breast cancer: toward personalized therapy. Radiographics. 2014; 34:1178–1195.3. Kim H, Cho J, Kwon SY, Kang SH. Biologic sub type is a more important prognostic factor than nodal involvement in patients with stages I and II breast carcinoma. Ann Surg Treat Res. 2016; 90:1–9.4. Uematsu T, Kasami M, Yuen S. Triple-negative breast cancer: correlation between MR imaging and pathologic findings. Radiology. 2009; 250:638–547.5. Loo CE, Straver ME, Rodenhuis S, Muller SH, Wesseling J, Vrancken Peeters MJ, et al. Magnetic resonance imaging response monitoring of breast cancer during neoadjuvant chemotherapy: relevance of breast cancer subtype. J Clin Oncol. 2011; 29:660–666.6. Youk JH, Son EJ, Chung J, Kim JA, Kim EK. Triple-negative invasive breast cancer on dynamic contrast-enhanced and diffusion-weighted MR imaging: comparison with other breast cancer subtypes. Eur Radiol. 2012; 22:1724–1734.7. Dogan BE, Gonzalez-Angulo AM, Gilcrease M, Dryden MJ, Yang WT. Multimodality imaging of triple receptor-;negative tumors with mammography, ultrasound, and MRI. AJR Am J Roentgenol. 2010; 194:1160–1166.8. Agner SC, Rosen MA, Englander S, Tomaszewski JE, Feldman MD, Zhang P, et al. Computerized image analysis for identifying triple-negative breast cancers and differentiating them from other molecular subtypes of breast cancer on dy na mic contrast-enhanced MR images: a feasibility study. Radiology. 2014; 272:91–99.9. Perou CM, Sorlie T, Eisen MB, van de Rijn M, Jeffrey SS, Rees CA, et al. Molecular portraits of human breast tumours. Nature. 2000; 406:747–752.10. Yamamoto S, Han W, Kim Y, Du L, Jamshidi N, Huang D, et al. Breast cancer: radiogenomic biomarker reveals associations among dynamic contrast-enhanced MR imaging, long noncoding RNA, and metastasis. Radiology. 2015; 275:384–392.11. Yamamoto S, Maki DD, Korn RL, Kuo MD. Radiogenomic analysis of breast cancer using MRI: a preliminary study to define the landscape. AJR Am J Roentgenol. 2012; 199:654–663.12. Ashraf AB, Daye D, Gavenonis S, Mies C, Feldman M, Rosen M, et al. Identification of intrinsic imaging phenotypes for breast cancer tumors: preliminary associations with gene expression profiles. Radiology. 2014; 272:374–384.13. Zhu Y, Li H, Guo W, Drukker K, Lan L, Giger ML, et al. Deciphering genomic under pinnings of quantitative MRI-based radio mic phenotypes of invasive breast carcinoma. Sci Rep. 2015; 5:17787.14. Clark K, Vendt B, Smith K, Freymann J, Kirby J, Koppel P, et al. The Cancer Imaging Archive (TCIA): maintaining and operating a public information repository. J Digit Imaging. 2013; 26:1045–1057.15. Cancer Genome Atlas Network. Comprehensive molecular portraits of human breast tumours. Nature. 2012; 490:61–70.16. Broad Institute TCGA Genome Data Analy sis Center: Firehose version 2016_ 01_28 stddata run [Internet]. Broad Institute of MIT and Harvard;c2016. cited 2016 Sep 30. Available from: http://gdac.broadinstitute.org/runs/stddata__2016_01_28/.17. Hammond ME, Hayes DF, Dowsett M, Allred DC, Hagerty KL, Badve S, et al. American Society of Clinical Oncology/College of American Pathologists guideline recommendations for immuno histoche mical testing of estrogen and pro geste rone receptors in breast cancer. Arch Pathol Lab Med. 2010; 134:907–922.18. Wolff AC, Hammond ME, Schwartz JN, Hagerty KL, Allred DC, Cote RJ, et al. American Society of Clinical Oncology/College of American Pathologists guideline recommendations for human epidermal growth factor receptor 2 testing in breast cancer. Arch Pathol Lab Med. 2007; 131:18–43.19. D'Orsi Carl J. American College of Radiology. BI-RADS Committee. ACR BI-RADS atlas: breast imaging reporting and data system. 5th ed. Reston (VA): American College of Radiology;2013.20. Ritchie ME, Phipson B, Wu D, Hu Y, Law CW, Shi W, et al. limma powers dif fer ential expression analyses for RNA-se quencing and microarray studies. Nucleic Acids Res. 2015; 43:e47.21. Dennis G Jr, Sherman BT, Hosack DA, Yang J, Gao W, Lane HC, et al. DAVID: data base for annotation, visualization, and integrated discovery. Genome Biol. 2003; 4:P3.22. Subramanian A, Tamayo P, Mootha VK, Mukherjee S, Ebert BL, Gillette MA, et al. Gene set enrichment analysis: a knowledge-based approach for inter preting genome-wide expression profiles. Proc Natl Acad Sci U S A. 2005; 102:15545–15550.23. Mootha VK, Lindgren CM, Eriksson KF, Subramanian A, Sihag S, Lehar J, et al. PGC-1alpha-responsive genes involved in oxidative phosphorylation are co ordinately downregulated in human diabetes. Nat Genet. 2003; 34:267–273.24. DeVita VT Jr, Rosenberg SA. Two hundred years of cancer research. N Engl J Med. 2012; 366:2207–2014.25. Almendro V, Fuster G. Heterogeneity of breast cancer: etiology and clinical relevance. Clin Transl Oncol. 2011; 13:767–773.26. Schmitz AM, Loo CE, Wesseling J, Pijnappel RM, Gilhuijs KG. Association bet ween rim enhancement of breast cancer on dynamic contrast-enhanced MRI and patient outcome: impact of subtype. Breast Cancer Res Treat. 2014; 148:541–551.27. Liu H, Kato Y, Erzinger SA, Kiriakova GM, Qian Y, Palmieri D, et al. The role of MMP-1 in breast cancer growth and metastasis to the brain in a xenograft model. BMC Cancer. 2012; 12:583.28. Rimawi MF, Shetty PB, Weiss HL, Schiff R, Osborne CK, Chamness GC, et al. Epidermal growth factor receptor expression in breast cancer association with biologic phenotype and clinical outcomes. Cancer. 2010; 116:1234–1242.29. Kim JY, Jung HH, Do IG, Bae S, Lee SK, Kim SW, et al. Prognostic value of ERBB4 expression in patients with triple negative breast cancer. BMC Cancer. 2016; 16:138.30. Grimm LJ, Anderson AL, Baker JA, Johnson KS, Walsh R, Yoon SC, et al. Inter observer variability between breast imagers using the fifth edition of the BI-RADS MRI lexicon. AJR Am J Roentgenol. 2015; 204:1120–1224.
- Full Text Links
-
- Actions
-
Cited
- CITED
-
- Close
- Share
-
- Similar articles
-
- Practical and illustrated summary of updated BI-RADS for ultrasonography
- Breast Imaging Reporting and Data System (BI-RADS): Advantages and Limitations
- The Role of Preoperative Breast MRI in Patients With Early-Stage Breast Cancer
- Clinical Applications of Breast MRI
- Analysis of Breast Imaging Reporting and Data System Category 4 Complex Cystic Masses of the Breast: Do All the Complex Cystic Breast Masses Merit a Biopsy?
