Optical Coherence Tomography Angiography According to Severity of Diabetic Retinopathy
- Affiliations
-
- 1Department of Ophthalmology, Ulsan University Hospital, University of Ulsan College of Medicine, Ulsan, Korea. limbus68@naver.com
- KMID: 2382673
- DOI: http://doi.org/10.3341/jkos.2017.58.6.653
Abstract
- PURPOSE
To evaluate the extent of macular microvascular changes in diabetic retinopathy according to progression of diabetic retinopathy using optical coherence tomography angiography (OCTA).
METHODS
We retrospectively analyzed 46 diabetic patients and 10 normal patients who underwent OCTA. Diabetic patients were classified as mild, moderate, severe non-proliferative diabetic retinopathy (NPDR), and proliferative diabetic retinopathy (PDR) according to international clinical diabetic retinopathy severity classification fundus findings. OCTA was performed on a 3 × 3 mm region centered on the fovea and parafoveal areas to measure the width of the fovea avascular zone (FAZ) of the superficial and deep capillary plexuses.
RESULTS
Among the control group, NPDR, and PDR, the superficial capillary plexus (SCP) and deep capillary plexus (DCP) of the FAZ increased with progression of diabetic retinopathy. In the SCP (p<0.001) and DCP (p<0.001), there was a significant difference in size between the NPDR and PDR groups. In the NPDR group, there were meaningful differences in SCP (p=0.011) and DCP (p=0.038) size between the moderate and severe NPDR groups.
CONCLUSIONS
In this study, OCTA was used to measure the FAZ, and we aimed to determine if there was a significant difference in FAZ between the NPDR and the PDR groups and between the moderate and severe NPDR groups in terms of the degree of progression of diabetic retinopathy. The results suggest that the size of the FAZ could be a marker of progression of diabetic retinopathy, and noninvasive OCTA can be used to confirm such progression.
MeSH Terms
Figure
-
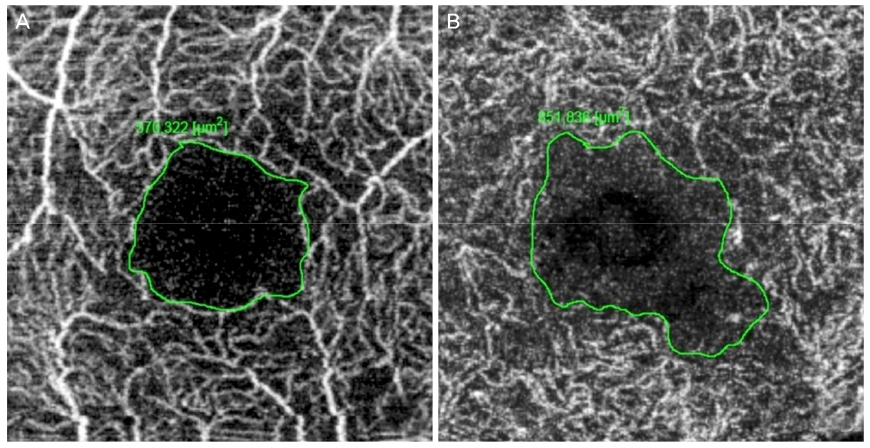
Figure 1 Manual drawing of the foveal avascular zone boundary using intrinsic measure area software. (A) Example of manual drawing of 3 × 3 mm optical coherence tomography angiogram in superficial capillary plexuses in a non-proliferative diabetic retinopathy (NPDR) patient. (B) Example of manual drawing of 3 × 3 mm optical coherence tomography angiogram in deep capillary plexuses in a NPDR patient.

Figure 2 Manual drawing of the foveal avascular zone (FAZ) boundary. (A, B) FAZ of the SCP and DCP in no diabetic retinopathy patients. (C, D) FAZ of the SCP and DCP in mild non-proliferative diabetic retinopathy (NPDR) patients. (E, F) FAZ of the SCP and DCP in moderate NPDR patients. (G, H) FAZ of the SCP and DCP in severe NPDR patients. (I, J) FAZ of the SCP and DCP in proliferative diabetic retinopathy patients.
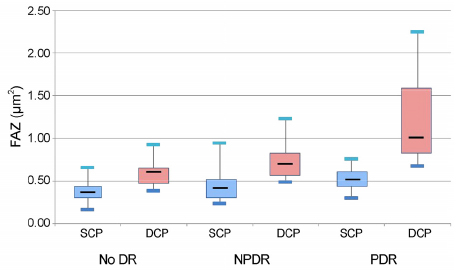
Figure 3 Comparison of fovea avascular zone (FAZ) area between non-proliferative diabetic retinopathy (NPDR) group and proliferative diabetic retinopathy (PDR) group. Boxplot showing the fovea avascular zone area in the superficial capillary plexuses (SCPs) and deep capillary plexuses (DCPs) in patients with no diabetic retinopathy (DR), NPDR and PDR.
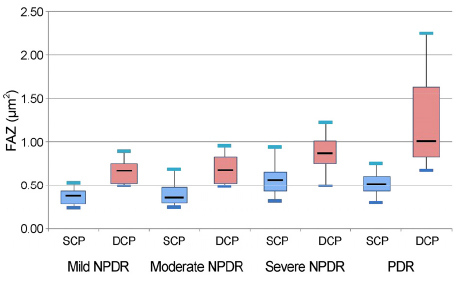
Figure 4 Comparison of fovea avascular zone (FAZ) area according to the severity of diabetic retinopathy (DR). Boxplot showing the fovea avascular zone area in the superficial capillary plexuses (SCPs) and deep capillary plexuses (DCPs) in patients with mild, moderate, severe non-proliferative diabetic retinopathy (NPDR) and proliferative diabetic retinopathy (PDR).
Cited by 1 articles
-
Measurement of Vessel Density Using Optical Coherence Tomography-angiography in Normal Subjects: Difference by Analysis Area
Jong Chan Im
J Korean Ophthalmol Soc. 2019;60(4):355-361. doi: 10.3341/jkos.2019.60.4.355.
Reference
-
1. Varma R, Bressler NM, Doan QV, et al. Prevalence of and risk factors for diabetic macular edema in the United States. JAMA Ophthalmol. 2014; 132:1334–1340.2. Choi CW, Lee SJ, Kang HR, Yang YS. The change of microaneurysm in diabetic retinopathy patients who undergo intravitreal avastin (bevacizumab) injection. J Korean Ophthalmol Soc. 2014; 55:1481–1486.3. Chey JH, Park JM. Retinal vascular caliber changes in diabetic retinopathy after panretinal photocoagulation and additivd bevacizumab injections. J Korean Ophthalmol Soc. 2016; 57:917–923.4. Arend O, Wolf S, Jung F, et al. Retinal microcirculation in patients with diabetes mellitus: dynamic and morphological analysis of perifoveal capillary network. Br J Ophthalmol. 1991; 75:514–518.5. Ji B, Kim HC. Foveal microvascular changes based on optical coherence tomography angiography in mild nonproliferative diabetic retinopathy. J Korean Ophthalmol Soc. 2016; 57:1723–1730.6. Al-Sheikh M, Akil H, Pfau M, Sadda SR. Swept-source OCT angiography imaging of the foveal avascular zone and macular capillary network density in diabetic retinopathy. Invest Ophthalmol Vis Sci. 2016; 57:3907–3913.7. Snodderly DM, Weinhaus RS. Retinal vasculature of the fovea of the squirrel monkey saimiri sciureus: three-dimensional architecture, visual screening, and relationships to the neuronal layers. J Comp Neurol. 1990; 297:145–163.8. Nagaoka T, Sato E, Takahashi A, et al. Impaired retinal circulation in patients with type 2 diabetes mellitus: retinal laser doppler velocimetry study. Invest Ophthalmol Vis Sci. 2010; 51:6729–6734.9. Wiley HE, Ferris FL. Nonproliferative diabetic retinopathy and diabetic macular edema. In : Ryan SJ, Sadda S, Hinton D, editors. Retina. 5th ed. London: Elsevier Saunders;2013. v. 2:chap. 2.10. de Carlo TE, Bonini Filho MA, Chin AT, et al. Spectral-domain optical coherence tomography angiography of choroidal neovascularization. Ophthalmology. 2015; 122:1228–1238.11. Savastano MC, Lumbroso B, Rispoli M. In vivo characterization of retinal vascularization morphology using optical coherence tomography angiography. Retina. 2015; 35:2196–2203.12. Spaide RF, Klancnik JM Jr, Cooney MJ. Retinal vascular layers imaged by fluorescein angiography and optical coherence tomography angiography. JAMA Ophthalmol. 2015; 133:45–50.13. Jia Y, Tan O, Tokayer J, et al. Split-spectrum amplitude-decorrelation angiography with optical coherence tomography. Opt Express. 2012; 20:4710–4725.14. Wilkinson CP, Ferris FL 3rd, Klein RE, et al. Proposed international clinical diabetic retinopathy and diabetic macular edema disease severity scales. Ophthalmology. 2003; 110:1677–1682.15. Stein MR, Parker CW. Reactions following intravenous fluorescein. Am J Ophthalmol. 1971; 72:861–868.16. Karhunen u, Raitta C, Kala R. Adverse reactions to fluorescein angiography. Acta Ophthalmol (Copenh). 1986; 64:282–286.17. Lipson BK, Yannuzzi LA. Coplication of intravenous fluorescein injections. Int Ophthalmol Clin. 1989; 29:200–205.18. Amalric P, Biau C, Féniès MT. Incidents and accidents during fluorescein angiography. Bull Soc Ophtalmol Fr. 1968; 68:968–973.19. Deglin SM, Deglin EA, Chung EK. Acute myocardial infarction following fluorescein angiography. Heart Lung. 1977; 6:505–509.20. Cunningham EE, Balu V. Cardiac arrest following fluorescein angiography. JAMA. 1979; 242:2431.21. Wons J, Pfau M, Wirth MA, et al. Optical coherence tomography angiography of the foveal avascular zone in retinal vein occlusion. Ophthalmologica. 2016; 235:195–202.22. de Carlo TE, Romano A, Waheed NK, Duker JS. A review of optical coherence tomography angiography (OCTA). Int J Retina Vitreous. 2015; 1:5. eCollection 2015.23. Freiberg FJ, Pfau M, Wons J, et al. Optical coherence tomography angiography of the foveal avascular zone in diabetic retinopathy. Graefes Arch Clin Exp Ophthalmol. 2016; 254:1051–1058.24. Garcia JM, Lima TT, Louzada RN, et al. Diabetic macular ischemia diagnosis: comparison between optical coherence tomography angiography and fluorescein angiography. J Ophthalmol. 2016; 2016:3989310.25. Hwang TS, Jia Y, Gao SS, et al. Optical coherence tomography angiography features of diabetic retinopathy. Retina. 2015; 35:2371–2376.26. Dmuchowska DA, Krasnicki P, Mariak Z. Can optical coherence tomography replace fluorescein angiography in detection of ischemic diabetic maculopathy? Graefes Arch Clin Exp Ophthalmol. 2014; 252:731–738.27. Dimitrova G, Chihara E, Takahashi H, et al. Quantitative retinal optical coherence tomography angiography in patients with diabetes without diabetic retinopathy. Invest Ophthalmol Vis Sci. 2017; 58:190–196.28. Falavarjani KG, Sarraf D. Optical coherence tomography angiography of the retina and choroid; current applications and future directions. J Curr Ophthalmol. 2017; 29:1–4.29. Samara WA, Shahlaee A, Adam MK, et al. Quantification of diabetic macular ischemia using optical coherence tomography angiography and its relationship with visual acuity. Ophthalmology. 2017; 124:235–244.30. Lee J, Moon BG, Cho AR, Yoon YH. Optical coherence tomography angiography of DME and its association with anti-VEGF treatment response. Ophthalmology. 2016; 123:2368–2375.31. de Carlo TE, Chin AT, Bonini Filho MA, et al. Detection of microvascular changes in eyes of patients with diabetes but not clinical diabetic retinopathy using optical coherence tomography angiography. Retina. 2015; 35:2364–2370.32. Coscas F, Glacet-Bernard A, Miere A, et al. Optical coherence tomography angiography in retinal vein occlusion: evaluation of superficial and deep capillary plexa. Am J Ophthalmol. 2016; 161:160–171. 171.e1–171.e2.
- Full Text Links
-
- Actions
-
Cited
- CITED
-
- Close
- Share
-
- Similar articles
-
- Choroidal Thickness at the Outside of Fovea in Diabetic Retinopathy Using Spectral-Domain Optical Coherence Tomography
- Optical Coherence Tomography-angiography: Comparison of the Foveal Avascular Zone between Diabetic Retinopathy and Normal Subjects
- Foveal Microvascular Changes Based on Optical Coherence Tomography Angiography in Mild Nonproliferative Diabetic Retinopathy
- Current Concepts in Diabetic Retinopathy
- New Modalities for the Diagnosis and Treatment of Diabetic Retinopathy
