Calibration of High-Density Lipoprotein Cholesterol Values From the Korea National Health and Nutrition Examination Survey Data, 2008 to 2015
- Affiliations
-
- 1Department of Laboratory Medicine, Konkuk University School of Medicine, Seoul, Korea.
- 2Department of Laboratory Medicine, Seoul National University Bundang Hospital, Seongnam, Korea. songjhcp@snu.ac.kr
- 3Department of Laboratory Medicine, Veterans Health Service Medical Center, Seoul, Korea.
- 4Department of Laboratory Medicine, Yonsei University College of Medicine, Seoul, Korea.
- 5Department of Statistics, Seoul National University, Seoul, Korea.
- 6Interdisciplinary Program in Bioinformatics, Seoul National University, Seoul, Korea.
- 7Department of Laboratory Medicine, Seoul National University Hospital, Seoul, Korea.
- 8Green Cross Laboratories, Yongin, Korea.
- 9Seegene Medical Foundation, Seoul, Korea.
- 10Division of Health and Nutrition Survey, Centers for Disease Control and Prevention, Cheongju, Korea.
- KMID: 2373607
- DOI: http://doi.org/10.3343/alm.2017.37.1.1
Abstract
- BACKGROUND
For correct interpretation of the high-density lipoprotein cholesterol (HDL-C) data from the Korea National Health and Nutrition Examination Survey (KNHANES), the values should be comparable to reference values. We aimed to suggest a way to calibrate KNHANES HDL-C data from 2008 to 2015 to the Centers for Disease Control and Prevention (CDC) reference method values.
METHODS
We derived three calibration equations based on comparisons between the HDL-C values of the KNHANES laboratory and the CDC reference method values in 2009, 2012, and 2015 using commutable frozen serum samples. The selection of calibration equation for correcting KNHANES HDL-C in each year was determined by the accuracy-based external quality assurance results of the KNHANES laboratory.
RESULTS
Significant positive biases of HDL-C values were observed in all years (2.85-9.40%). We created the following calibration equations: standard HDL-C=0.872×[original KNHANES HDL-C]+2.460 for 2008, 2009, and 2010; standard HDL-C=0.952×[original KNHANES HDL-C]+1.096 for 2012, 2013, and 2014; and standard HDL-C=1.01×[original KNHANES HDL-C]-3.172 for 2011 and 2015. We calibrated the biases of KNHANES HDL-C data using the calibration equations.
CONCLUSIONS
Since the KNHANES HDL-C values (2008-2015) showed substantial positive biases compared with the CDC reference method values, we suggested using calibration equations to correct KNHANES data from these years. Since the necessity for correcting the biases depends on the characteristics of research topics, each researcher should determine whether to calibrate KNHANES HDL-C data or not for each study.
MeSH Terms
Figure
-
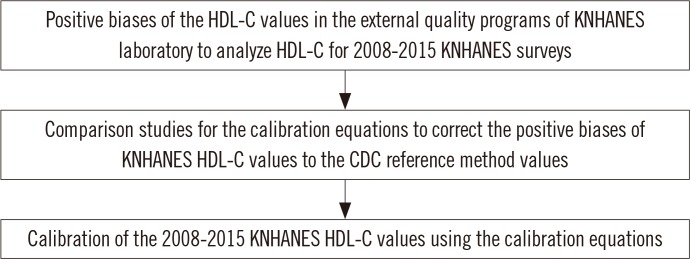
Fig. 1 Flow diagram for the study. Since positive biases ranging from 2.85% to 9.40% were observed in the external quality programs of KNHANES laboratory to analyze HDL-C for 2008-2015 KNHANES surveys, correction of the KNHANES HDL-C values from these years was necessary. Three calibration equations were derived by the comparison studies, which compared the HDL-C values at the KNHANES laboratory with those at the CRMLN laboratory in 2009, 2012, and 2015. The application of the calibration equations to the KNHANES HDL-C values in each year was determined on the basis of the external quality assurance results in the KNHANES laboratory.Abbreviations: HDL-C, high-density lipoprotein cholesterol; CDC, Centers for Disease Control and Prevention; KNHANES, Korea National Health and Nutrition Examination Surveys; CRMLN, Cholesterol Reference Method Laboratory Network.
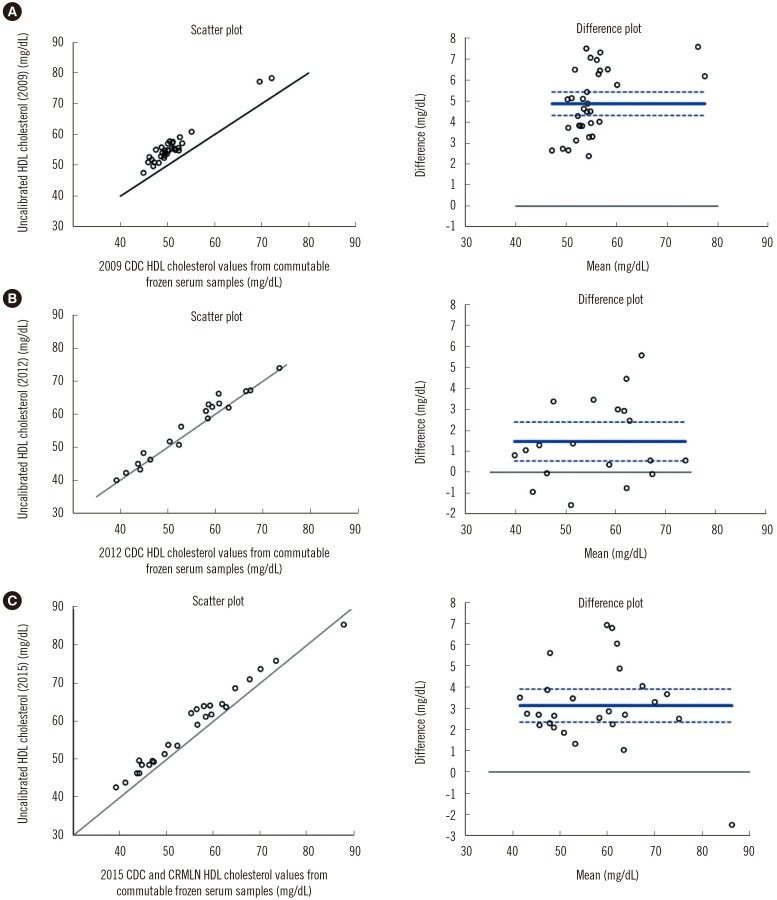
Fig. 2 High-density lipoprotein cholesterol (HDL-C) comparison study in 2009, 2012, and 2015. (A) Scatter plot and Bland-Altman plot of uncalibrated HDL-C (2009) and Centers for Disease Control and Prevention (CDC) reference laboratory HDL-C values from commutable frozen serum samples (mg/dL). (B) Scatter plot and Bland-Altman plot of uncalibrated HDL-C (2012) and CDC reference HDL-C. (C) Scatter plot and Bland-Altman plot of uncalibrated HDL-C (2015) and CDC and Cholesterol Reference Method Laboratory Network (CRMLN) reference HDL-C values. The solid line in the scatter plot is the line of identity (45 degree). The solid line in the Bland-Altman plot is the mean difference with 95% confidence interval (dotted lines); the solid line is drawn at zero.
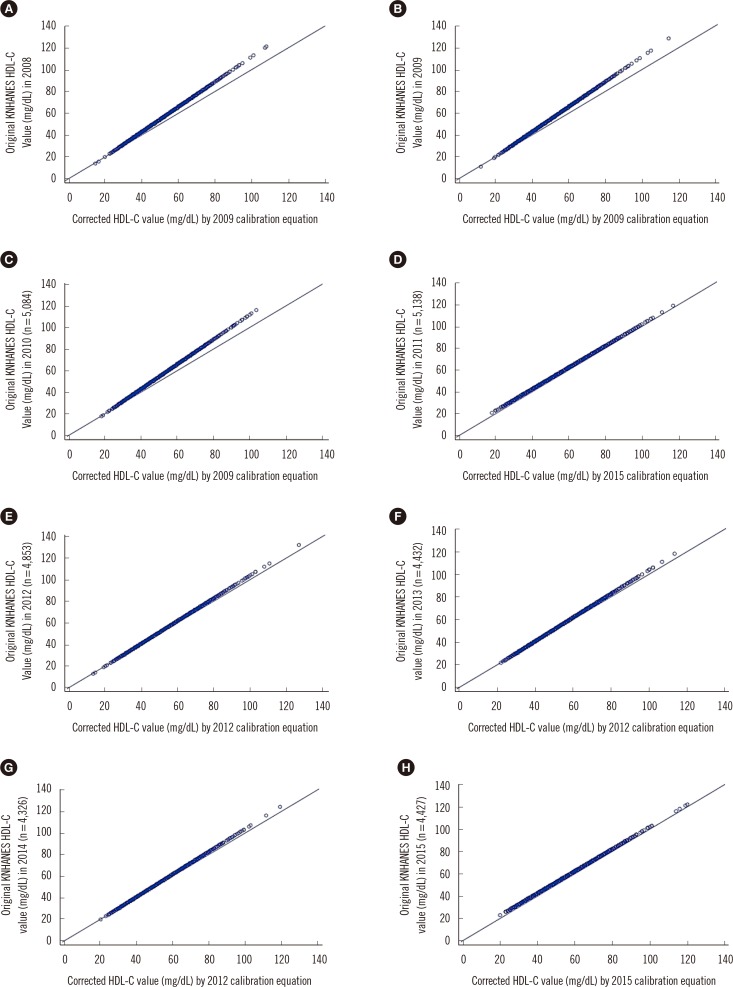
Fig. 3 Distribution of Korea National Health and Nutrition Examination Survey (KNHANES) 2008-2015 data for each year before and after data correction by calibration, expressed as a scatter plot. Calibration equations were used based on Passing-Bablok regression analysis. The mean value (mg/dL) of the original KNHANES HDL-C data with the corrected values by calibration equation in each year is shown (n is the number of results for the KNHANES participants above 30 yr of age). (A) The mean value of 50.6 (mg/dL) in KNHANES 2008 HDL-C data (n=5,530) was corrected to 47.6 (mg/dL) by the 2009 calibration equation. (B) The mean value of 51.3 (mg/dL) in KNHANES 2009 HDL-C data (n=6,001) was corrected to 47.2 (mg/dL) by the 2009 equation. (C) The mean value of 52.3 (mg/dL) in KNHANES 2010 HDL-C data (n=5,084) was corrected to 48.0 (mg/dL) by the 2009 equation. (D) The mean value of 52.5 (mg/dL) in KNHANES 2011 HDL-C data (n=5,138) was corrected to 49.8 (mg/dL) by the 2015 equation. (E) The mean value of 51.0 (mg/dL) in KNHANES 2012 HDL-C data (n=4,853) was corrected to 49.6 (mg/dL) by the 2012 equation. (F) The mean value of 51.5 (mg/dL) in KNHANES 2013 HDL-C data (n= 4,432) was corrected to 50.2 (mg/dL) by the 2012 equation. (G) The mean value of 52.0 (mg/dL) in KNHANES 2014 HDL-C data (n=4,326) was corrected to 50.6 (mg/dL) by the 2012 equation. (H) The mean value of 53.1 (mg/dL) in KNHANES 2015 HDL-C data (n=4,427) was corrected to 50.4 (mg/dL) by the 2015 equation.
Cited by 3 articles
-
Association of Smoking Status and High Density Lipoprotein-Cholesterol in Males in the Fifth Korea National Health and Nutrition Examination Survey
In Kyung Jung
Korean J Health Promot. 2017;17(4):289-297. doi: 10.15384/kjhp.2017.17.4.289.Association between High-Density Lipoprotein Cholesterol and Vitamin D Levels in Adult Men in the Fifth Korea National Health and Nutrition Examination Survey
In Kyung Jung
Korean J Health Promot. 2019;19(4):210-220. doi: 10.15384/kjhp.2019.19.4.210.Limitations of current screening methods for lipid disorders in Korean adolescents and a proposal for an effective detection method: a nationwide, cross-sectional study
Jung Hyun Shin, Ji In Cheong, Hee Won Cheuh, Jae-Ho Yoo
Ann Pediatr Endocrinol Metab. 2020;25(4):265-271. doi: 10.6065/apem.2040098.049.
Reference
-
1. Miller WG, Myers GL, Sakurabayashi I, Bachmann LM, Caudill SP, Dziekonski A, et al. Seven direct methods for measuring HDL and LDL cholesterol compared with ultracentrifugation reference measurement procedures. Clin Chem. 2010; 56:977–986. PMID: 20378768.2. Selvin E, Manzi J, Stevens LA, Van Lente F, Lacher DA, Levey AS, et al. Calibration of serum creatinine in the National Health and Nutrition Examination Surveys (NHANES) 1988-1994, 1999-2004. Am J Kidney Dis. 2007; 50:918–926. PMID: 18037092.3. Selvin E, Juraschek SP, Eckfeldt J, Levey AS, Inker LA, Coresh J. Calibration of cystatin C in the National Health and Nutrition Examination Surveys (NHANES). Am J Kidney Dis. 2013; 61:353–354. PMID: 23177702.4. Rifai N, Warnick GR, editors. Handbook of lipoprotein testing. 2nd ed. Washington DC: AACC Press;2001. p. 227–230.5. Rifai N, Warnick GR, editors. Handbook of lipoprotein testing. 2nd ed. Washington DC: AACC Press;2001. p. 717–748.6. Clinical and Laboratory Standards Institute. Preparation and validation of commutable frozen human serum pools as secondary reference materials for cholesterol measurement procedure: Approved Guideline. CLSI document C37-A. Wayne, PA: Clinical and Laboratory Standards Institute;1999.7. Passing H, Bablok . A new biometrical procedure for testing the equality of measurements from two different analytical methods. Application of linear regression procedures for method comparison studies in clinical chemistry, Part I. J Clin Chem Clin Biochem. 1983; 21:709–720. PMID: 6655447.8. Yun Y. Development of trend analysis methods for lipid profile in the KNHANES. Korea Centers for Disease Control and Prevention;2014. Available at: http://cdc.go.kr/CDC/notice/CdcKrInfo0201.jsp?menuIds=HOME001-MNU1154-MNU0004-MNU1889&cid=25575.9. Yetley EA, Pfeiffer CM, Schleicher RL, Phinney KW, Lacher DA, Christakos S, et al. NHANES monitoring of serum 25-hydroxyvitamin D: a roundtable summary. J Nutr. 2010; 140:2030S–2045S. PMID: 20881084.10. National Health and Nutrition Examination Survey 2007 - 2008 Data Documentation, Codebook, and Frequencies; HDL-Cholesterol (HDL_E). National Center for Health Statistics, Centers for Disease Control and Prevention;2010. Available at: http://wwwn.cdc.gov/nchs/nhanes/2007-2008/HDL_E.htm.11. Clinical and Laboratory Standards Institute. Measurement procedure comparison and bias estimation using patient samples: Approved Guideline. CLSI document EP09-A3. Wayne, PA: Clinical and Laboratory Standards Institute;2013.
- Full Text Links
-
- Actions
-
Cited
- CITED
-
- Close
- Share
-
- Similar articles
-
- Relationship of Low Density Lipoprotein Cholesterol Level and Interest Nutrition on Nutrition Label in Korean Adults: 2008–2011 Korea National Health and Nutrition Examination Survey
- Relationship between Waist Circumference and Cardiovascular Risk Factors in Adolescents: Analysis of the Korea National Health and Nutrition Examination Survey Data
- The Prevalence, Awareness and Treatment of High Low Density Lipoprotein-Cholesterol in Korean Adults Without Coronary Heart Diseases: The Third Korea National Health and Nutrition Examination Survey, 2005
- The Amount of Physical Activity According to the Level of High Density Lipoprotein Cholesterol in Korean Adults
- Fish consumption, mercury exposure, and the risk of cholesterol profiles: findings from the Korea National Health and Nutrition Examination Survey 2010-2011
