Use of a Combined Gene Expression Profile in Implementing a Drug Sensitivity Predictive Model for Breast Cancer
- Affiliations
-
- 1Department of Pathology, Yanbian University Medical College, Yanji City, China.
- 2Department of Oral and Maxillofacial Surgery, College of Dentistry, Yonsei University, Seoul, Korea.
- 3BK21 PLUS Project, Yonsei University College of Dentistry, Yonsei University, Seoul, Korea. kky1004@yuhs.ac
- KMID: 2367509
- DOI: http://doi.org/10.4143/crt.2016.085
Abstract
- PURPOSE
Chemotherapy targets all rapidly growing cells, not only cancer cells, and thus is often associated with unpleasant side effects. Therefore, examination of the chemosensitivity based on genotypes is needed in order to reduce the side effects.
MATERIALS AND METHODS
Various computational approaches have been proposed for predicting chemosensitivity based on gene expression profiles. A linear regression model can be used to predict the response of cancer cells to chemotherapeutic drugs, based on genomic features of the cells, and appropriate sample size for this method depends on the number of predictors. We used principal component analysis and identified a combined gene expression profile to reduce the number of predictors.
RESULTS
The coefficients of determinanation (R²) of prediction models with combined gene expression and several independent gene expressions were similar. Corresponding F values, which represent model significances were improved by use of a combined gene expression profile, indicating that the use of a combined gene expression profile is helpful in predicting drug sensitivity. Even better, a prediction model can be used even with small samples because of the reduced number of predictors.
CONCLUSION
Combined gene expression analysis is expected to contribute to more personalized management of breast cancer cases by enabling more effective targeting of existing therapies. This procedure for identifying a cell-type-specific gene expression profile can be extended to other chemotherapeutic treatments and many other heterogeneous cancer types.
MeSH Terms
Figure
-

Fig. 1. The summary of the study plan using two published datasets. G-matrix includes 638 genes, which showed significantly different expression among subtypes of breast cancer cell lines.

Fig. 2. Expression patterns of 638 genes in breast cancer cell lines, identified by ANOVA. The vertical and horizontal axes represent gene expressions and breast cancer cell lines, respectively.
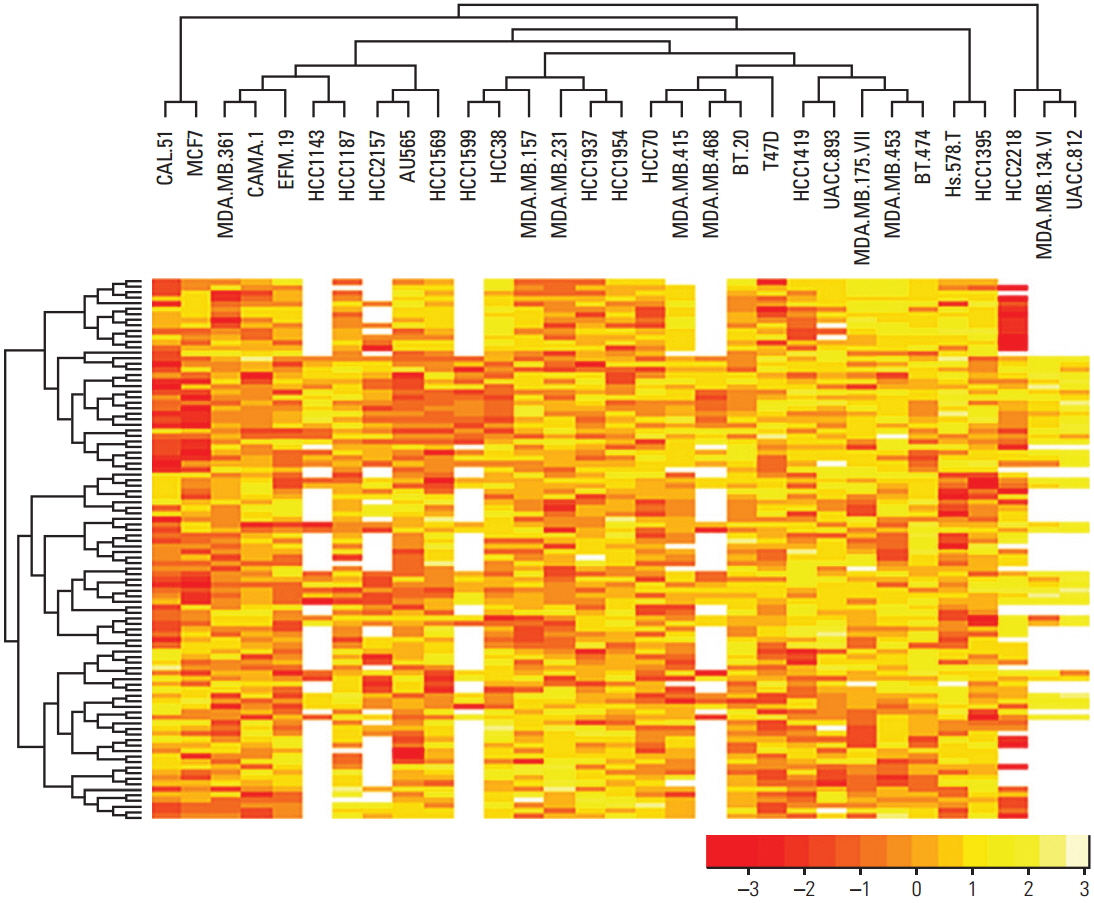
Fig. 3. Patterns of standardized IC50 scores in 31 breast cancer cell lines. The vertical and horizontal axes represent 98 drugs and 31 breast cancer cell lines, respectively.

Fig. 4. Patterns of standardized IC50 of four drugs in 31 breast cancer cell lines. The vertical and horizontal axes represent four drugs and 31 breast cancer cell lines, respectively.

Fig. 5. DG-matrix. Correlation pattern of 638 gene expressions and standardized IC50 scores of 98 drugs. The vertical and horizontal axes represent 638 genes and 98 drugs, respectively. Correlation coefficients range from –1 to 1.
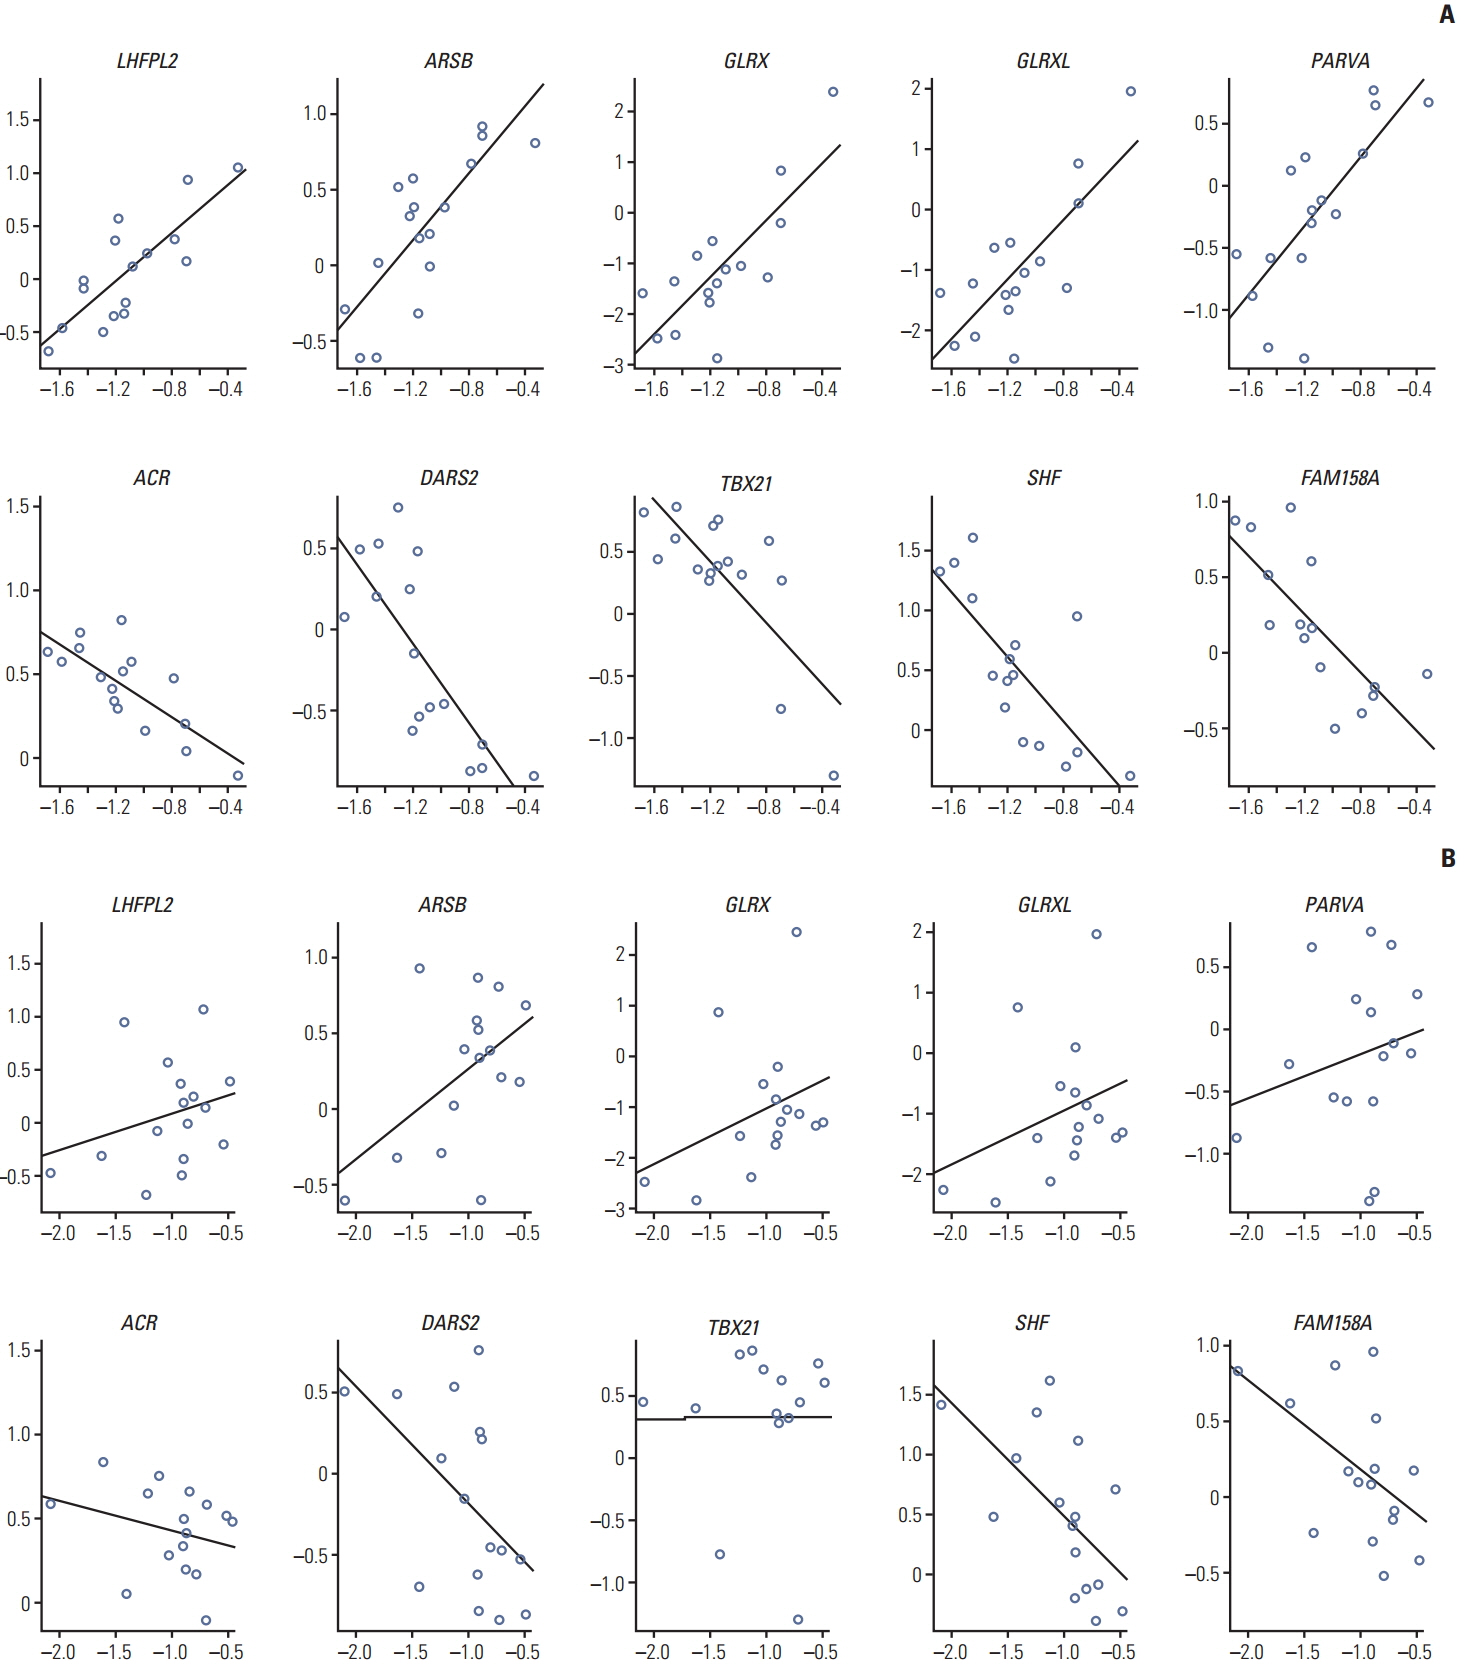
Fig. 6. The relationship between expressions of doxorubicin-related genes and drug sensitivity of doxorubicin (A) and mitomycin (B). The horizontal and vertical axes represent the standardized IC50 scores and gene expressions, respectively.

Fig. 7. Association of gene expressions and chemosensitivity to doxorubicin in breast cancer. Doxorubicin represents IC50 scores against doxorubicin and combined biomarker represents combined gene expression.
Reference
-
References
1. Jemal A, Bray F, Center MM, Ferlay J, Ward E, Forman D. Global cancer statistics. CA Cancer J Clin. 2011; 61:69–90.
Article2. DeSantis C, Ma J, Bryan L, Jemal A. Breast cancer statistics, 2013. CA Cancer J Clin. 2014; 64:52–62.
Article3. Torre LA, Bray F, Siegel RL, Ferlay J, Lortet-Tieulent J, Jemal A. Global cancer statistics, 2012. CA Cancer J Clin. 2015; 65:87–108.
Article4. Oh HS. Targeted therapy for breast cancer. Hanyang Med Rev. 2012; 32:112–7.
Article5. Jung KW, Won YJ, Oh CM, Kong HJ, Cho H, Lee JK, et al. Prediction of cancer incidence and mortality in Korea, 2016. Cancer Res Treat. 2016; 48:451–7.
Article6. BreastCancerTrials.org [Internet]. San Francisco, CA: Breast-CancerTrials.org;2016. [cited 2016 May 1]. Available from: https://www.breastcancertrials.org/.7. Garnett MJ, Edelman EJ, Heidorn SJ, Greenman CD, Dastur A, Lau KW, et al. Systematic identification of genomic markers of drug sensitivity in cancer cells. Nature. 2012; 483:570–5.8. Scherf U, Ross DT, Waltham M, Smith LH, Lee JK, Tanabe L, et al. A gene expression database for the molecular pharmacology of cancer. Nat Genet. 2000; 24:236–44.
Article9. Kao J, Salari K, Bocanegra M, Choi YL, Girard L, Gandhi J, et al. Molecular profiling of breast cancer cell lines defines relevant tumor models and provides a resource for cancer gene discovery. PLoS One. 2009; 4:e6146.
Article10. Menden MP, Iorio F, Garnett M, McDermott U, Benes CH, Ballester PJ, et al. Machine learning prediction of cancer cell sensitivity to drugs based on genomic and chemical properties. PLoS One. 2013; 8:e61318.
Article11. Ferriss JS, Kim Y, Duska L, Birrer M, Levine DA, Moskaluk C, et al. Multi-gene expression predictors of single drug responses to adjuvant chemotherapy in ovarian carcinoma: predicting platinum resistance. PLoS One. 2012; 7:e30550.
Article12. Lee JK, Havaleshko DM, Cho H, Weinstein JN, Kaldjian EP, Karpovich J, et al. A strategy for predicting the chemosensitivity of human cancers and its application to drug discovery. Proc Natl Acad Sci U S A. 2007; 104:13086–91.
Article13. De Abreu FB, Schwartz GN, Wells WA, Tsongalis GJ. Personalized therapy for breast cancer. Clin Genet. 2014; 86:62–7.
Article14. Ring BZ, Chang S, Ring LW, Seitz RS, Ross DT. Gene expression patterns within cell lines are predictive of chemosensitivity. BMC Genomics. 2008; 9:74.
Article15. Wu D, Pang Y, Wilkerson MD, Wang D, Hammerman PS, Liu JS. Gene-expression data integration to squamous cell lung cancer subtypes reveals drug sensitivity. Br J Cancer. 2013; 109:1599–608.
Article16. Knofczynski GT, Mundfrom D. Sample sizes when using multiple linear regression for prediction. Educ Psychol Meas. 2008; 68:431–42.
Article17. Ku JM, Kim SR, Hong SH, Choi HS, Seo HS, Shin YC, et al. Cucurbitacin D induces cell cycle arrest and apoptosis by inhibiting STAT3 and NF-kappaB signaling in doxorubicin-resistant human breast carcinoma (MCF7/ADR) cells. Mol Cell Biochem. 2015; 409:33–43.18. Felding-Habermann B, O’Sullivan DM, Lorger M, Mac-Dermed D, Fernandez-Santidrian A, Steele JB, et al. PD03-07: Breast cancer heterogeneity and treatment resistance: clues from metaplastic tumors. In : In: Thirty-Fourth Annual CTRC-AACR San Antonio Breast Cancer Symposium; 2011. Dec 6-10; San Antonio, TX, USA.
Article19. Fukunaga K. Introduction to statistical pattern recognition. Boston, MA: Academic Press;1990.20. R Foundation. The R Project for Statistical Computing [Internet]. Vienna: R Foundation;2016. [cited 2016 May 1]. Available from: http://www.r-project.org/.21. Cohen J. Statistical power analysis for the behavioral sciences. 2nd ed. Hillsdale, NJ: Lawrence Erlbaum Associates;1988.22. Heiser LM, Sadanandam A, Kuo WL, Benz SC, Goldstein TC, Ng S, et al. Subtype and pathway specific responses to anticancer compounds in breast cancer. Proc Natl Acad Sci U S A. 2012; 109:2724–9.
Article
- Full Text Links
-
- Actions
-
Cited
- CITED
-
- Close
- Share
-
- Similar articles
-
- Identification of Biomarkers for Breast Cancer Using Databases
- Correlation of multidrug resistance gene expression with hestologic grade in locally advanced breast cancer
- A Predictive Model for Distant Metastasis in Patients With Breast Cancer Based on Machine Learning
- Characterization of the Differentially Expressed Genes in Human Breast Cancer using Subtractive Hybridization
- The Analysis of HER-2/neu Gene Status and Correlation with Other Clinico-Pathologic Factors for Breast Cancer Using Tissue Microarray
