Association between Microperimetric Parameters and Optical Coherent Tomographic Findings in Various Macular Diseases
- Affiliations
-
- 1Department of Ophthalmology, Asan Medical Center, University of Ulsan College of Medicine, Seoul, Korea. ophthalmo@amc.seoul.kr
- 2Department of Ophthalmology, Ulsan University Hospital, University of Ulsan College of Medicine, Ulsan, Korea.
- 3University of Ulsan College of Medicine, Seoul, Korea.
- KMID: 2363714
- DOI: http://doi.org/10.3341/kjo.2015.29.2.92
Abstract
- PURPOSE
To analyze the correlation between microperimetric parameters and optical coherent tomographic findings in the eyes of patients with macular diseases.
METHODS
A total of 64 eyes were included in this retrospective cross-sectional study. Differences in the macular integrity index and microperimetric parameters were analyzed according to types of outer retinal band defects. Correlations between average threshold values and retinal thickness in the corresponding areas were analyzed. Finally, microperimetric parameters were compared between inner and outer retinal lesions.
RESULTS
Measures of best-corrected visual acuity, macular integrity index, and average threshold values were significantly worse in eyes with defects in the ellipsoid portion of the photoreceptor inner segment (ISe), the cone outer segment tip (COST), and the external limiting membrane (ELM) than in eyes without ISe, COST, and ELM defects. Also, visual functionality is more significantly impacted by ELM defects than by other hyper-reflective band defects. There was a significant negative correlation between retinal thickness and the average threshold of the corresponding area in the Early Treatment Diabetic Retinopathy Study grid. Microperimetric parameters in the eyes of patients with inner retinal lesions were better than in the eyes of patients with outer retinal lesions.
CONCLUSIONS
The macular integrity index may be a useful factor for reflecting the functional aspects of macular diseases. Specifically, ELM, ISe, and COST defects are significantly associated with poor retinal sensitivity and macular integrity index values that suggest abnormalities. Among eyes with these particular defects, the visual functionality of patients is most sensitively impacted by ELM defects. This finding suggests that microperimetric parameters are sensitive and useful for evaluating functional abnormalities in the eyes of patients with macular disease, particularly in patients with outer retinal pathology.
Keyword
MeSH Terms
Figure
-
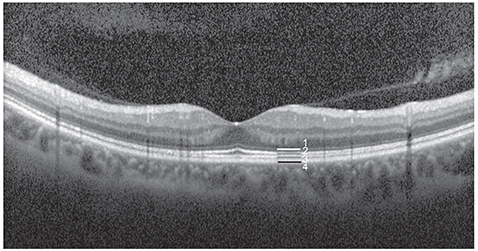
Fig. 1 Outer hyper-reflective bands on spectral domain optical coherent tomography. Band 1, external limiting membrane; band 2, ellipsoid portion of the photoreceptor inner segment; band 3, cone outer segment tip; band 4, retinal pigment epithelium.
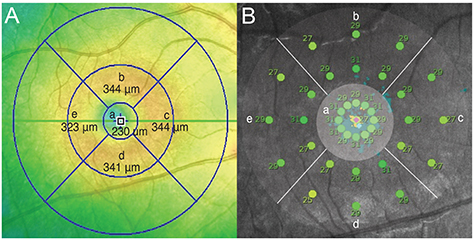
Fig. 2 Retinal thickness map (A) and average threshold of the corresponding area (B). (a) Fovea center within a 1,000-µm diameter, (b) superior to fovea center (1,000 to 3,000 µm), (c) nasal to fovea center (1,000 to 3,000 µm), (d) inferior to fovea center (1,000 to 3,000 µm), and (e) temporal to fovea center (1,000 to 3,000 µm).
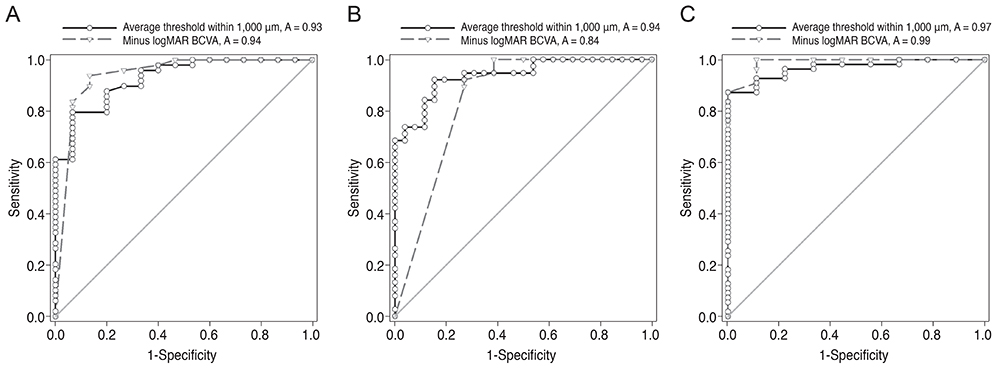
Fig. 3 Receiver operating characteristic (ROC) curves for average threshold within a 1,000-µm diameter and minus logarithm of the minimum angle of resolution (logMAR) best-corrected visual acuity (BCVA) according to (A) ellipsoid portion of the photoreceptor inner segment (ISe), (B) cone outer segment tip (COST), and (C) external limiting membrane (ELM) defects. The areas under the ROC curve (AUROC curve values) for the average threshold within a 1,000-µm diameter and minus logMAR BCVA according to ISe defects were 0.927 (95% confidence interval [CI], 0.860 to 0.995; p < 0.001) and 0.940 (95% CI, 0.861 to 1.020; p < 0.001), respectively. AUROC curve values for the average threshold within a 1,000-µm diameter and minus logMAR BCVA according to COST defects were 0.938 (95% CI, 0.884 to 0.992; p < 0.001) and 0.844 (95% CI, 0.747 to 0.941; p < 0.001), respectively. AUROC curve values for the average threshold within a 1,000-µm diameter and minus logMAR BCVA according to ELM defects were 0.968 (95% CI, 0.928 to 1.001; p < 0.001) and 0.988 (95% CI, 0.963 to 1.013; p < 0.001), respectively.
Reference
-
1. Hwang JU, Joe SG, Lee JY, et al. Microincision vitrectomy surgery for myopic foveoschisis. Br J Ophthalmol. 2013; 97:879–884.2. Iezzi R, Kapoor KG. No face-down positioning and broad internal limiting membrane peeling in the surgical repair of idiopathic macular holes. Ophthalmology. 2013; 120:1998–2003.3. Rosenfeld PJ, Brown DM, Heier JS, et al. Ranibizumab for neovascular age-related macular degeneration. N Engl J Med. 2006; 355:1419–1431.4. Brown DM, Kaiser PK, Michels M, et al. Ranibizumab versus verteporfin for neovascular age-related macular degeneration. N Engl J Med. 2006; 355:1432–1444.5. Hwang JU, Sohn J, Moon BG, et al. Assessment of macular function for idiopathic epiretinal membranes classified by spectral-domain optical coherence tomography. Invest Ophthalmol Vis Sci. 2012; 53:3562–3569.6. Oh J, Kim SW, Kwon SS, et al. Correlation of fundus autofluorescence gray values with vision and microperimetry in resolved central serous chorioretinopathy. Invest Ophthalmol Vis Sci. 2012; 53:179–184.7. Schachar IH, Zahid S, Comer GM, et al. Quantification of fundus autofluorescence to detect disease severity in nonexudative age-related macular degeneration. JAMA Ophthalmol. 2013; 131:1009–1015.8. Leuschen JN, Schuman SG, Winter KP, et al. Spectral-domain optical coherence tomography characteristics of intermediate age-related macular degeneration. Ophthalmology. 2013; 120:140–150.9. Sull AC, Vuong LN, Price LL, et al. Comparison of spectral/Fourier domain optical coherence tomography instruments for assessment of normal macular thickness. Retina. 2010; 30:235–245.10. De Boer JF, Cense B, Park BH, et al. Improved signal-to-noise ratio in spectral-domain compared with time-domain optical coherence tomography. Opt Lett. 2003; 28:2067–2069.11. Leitgeb R, Hitzenberger C, Fercher A. Performance of fourier domain vs. time domain optical coherence tomography. Opt Express. 2003; 11:889–894.12. Oh J, Smiddy WE, Flynn HW Jr, et al. Photoreceptor inner/outer segment defect imaging by spectral domain OCT and visual prognosis after macular hole surgery. Invest Ophthalmol Vis Sci. 2010; 51:1651–1658.13. Spaide RF, Curcio CA. Anatomical correlates to the bands seen in the outer retina by optical coherence tomography: literature review and model. Retina. 2011; 31:1609–1619.14. Hayashi H, Yamashiro K, Tsujikawa A, et al. Association between foveal photoreceptor integrity and visual outcome in neovascular age-related macular degeneration. Am J Ophthalmol. 2009; 148:83–89.e1.15. Yohannan J, Bittencourt M, Sepah YJ, et al. Association of retinal sensitivity to integrity of photoreceptor inner/outer segment junction in patients with diabetic macular edema. Ophthalmology. 2013; 120:1254–1261.16. Fujita K, Shinoda K, Imamura Y, et al. Correlation of integrity of cone outer segment tips line with retinal sensitivity after half-dose photodynamic therapy for chronic central serous chorioretinopathy. Am J Ophthalmol. 2012; 154:579–585.17. Landa G, Su E, Garcia PM, et al. Inner segment-outer segment junctional layer integrity and corresponding retinal sensitivity in dry and wet forms of age-related macular degeneration. Retina. 2011; 31:364–370.18. Rohrschneider K, Bultmann S, Springer C. Use of fundus perimetry (microperimetry) to quantify macular sensitivity. Prog Retin Eye Res. 2008; 27:536–548.19. Querques L, Querques G, Forte R, Souied EH. Microperimetric correlations of autofluorescence and optical coherence tomography imaging in dry age-related macular degeneration. Am J Ophthalmol. 2012; 153:1110–1115.20. Reibaldi M, Parravano M, Varano M, et al. Foveal microstructure and functional parameters in lamellar macular hole. Am J Ophthalmol. 2012; 154:974–980.e1.21. Chhablani JK, Kim JS, Cheng L, et al. External limiting membrane as a predictor of visual improvement in diabetic macular edema after pars plana vitrectomy. Graefes Arch Clin Exp Ophthalmol. 2012; 250:1415–1420.22. Oishi A, Hata M, Shimozono M, et al. The significance of external limiting membrane status for visual acuity in age-related macular degeneration. Am J Ophthalmol. 2010; 150:27–32.e1.23. Mylonas G, Sacu S, Dunavoelgyi R, et al. Response of retinal sensitivity to ranibizumab treatment of macular edema after acute branch retinal vein occlusion. Retina. 2013; 33:1220–1226.24. Munk MR, Kiss CG, Huf W, et al. Visual acuity and microperimetric mapping of lesion area in eyes with inflammatory cystoid macular oedema. Acta Ophthalmol. 2014; 92:332–338.25. Perry VH, Cowey A. The ganglion cell and cone distributions in the monkey's retina: implications for central magnification factors. Vision Res. 1985; 25:1795–1810.26. Curcio CA, Messinger JD, Sloan KR, et al. Human chorioretinal layer thicknesses measured in macula-wide, high-resolution histologic sections. Invest Ophthalmol Vis Sci. 2011; 52:3943–3954.27. Curcio CA, Allen KA. Topography of ganglion cells in human retina. J Comp Neurol. 1990; 300:5–25.
- Full Text Links
-
- Actions
-
Cited
- CITED
-
- Close
- Share
-
- Similar articles
-
- Analysis of the Maular Change in Optical Coherent Tomography after Internal Limiting Membrane Peeling
- Patterns of Macular Edema in Patients with Branch Retinal Vein Occlusion on Optical Coherence Tomography
- Clinical Manifestation and Result of Vitrectomy of Vitreomacular Traction Syndrome
- Optical Coherence Tomographic Finding in a Case of Macular Coloboma
- The Correlation between Visual Acuity and Patterns of Diabetic Macular Edema in OCT Images
