J Korean Ophthalmol Soc.
2007 Dec;48(12):1675-1685.
Discrimination between Normal and Early Stage of Glaucomatous Eyes Using the Stratus Optical Coherence Tomography
- Affiliations
-
- 1Department of Ophthalmology, Hanyang University College of Medicine, Seoul, Korea. KBUhm@hanyang.ac.kr
Abstract
-
PURPOSE: To evaluate the diagnostic ability of Stratus optical coherence tomography (OCT) parameters to distinguish normal eyes from those with early glaucomatous visual field defects.
METHODS
One eye each of 52 normal-tension glaucoma patients with early visual field defects (mean deviation, -3.98+/-1.30dB; range, -0.01 to -5.86dB) and 88 age-matched normal subjects were enrolled. The Peripapillary retinal nerve fiber layer (RNFL) and optic nerve head regions were scanned using the Stratus OCT. Areas under the receiver operating characteristic curve (AROC) and the sensitivity and specificity for various OCT parameters were used to assess the performance of OCT.
RESULTS
The AROC for the C/D area ratio was 0.865. Other high AROC values included the vertical C/D ratio (0.848), the average RNFL thickness (0.813), and the RNFL thickness in the inferior quadrant (0.791). A stepwise discriminant analysis found that a combination of the C/D area ratio and RNFL thickness in the inferior quadrant could correctly identify 86.4% of the normals and 80.8% of the glaucoma patients (AROC=0.893).
CONCLUSIONS
In our sample of patients with early visual field defects, Stratus OCT parameters showed moderate discriminating abilities. Combining the C/D area ratio and RNFL thickness in the inferior quadrant by discriminant analysis improved the diagnostic ability to detect glaucoma.
Keyword
MeSH Terms
Figure
-
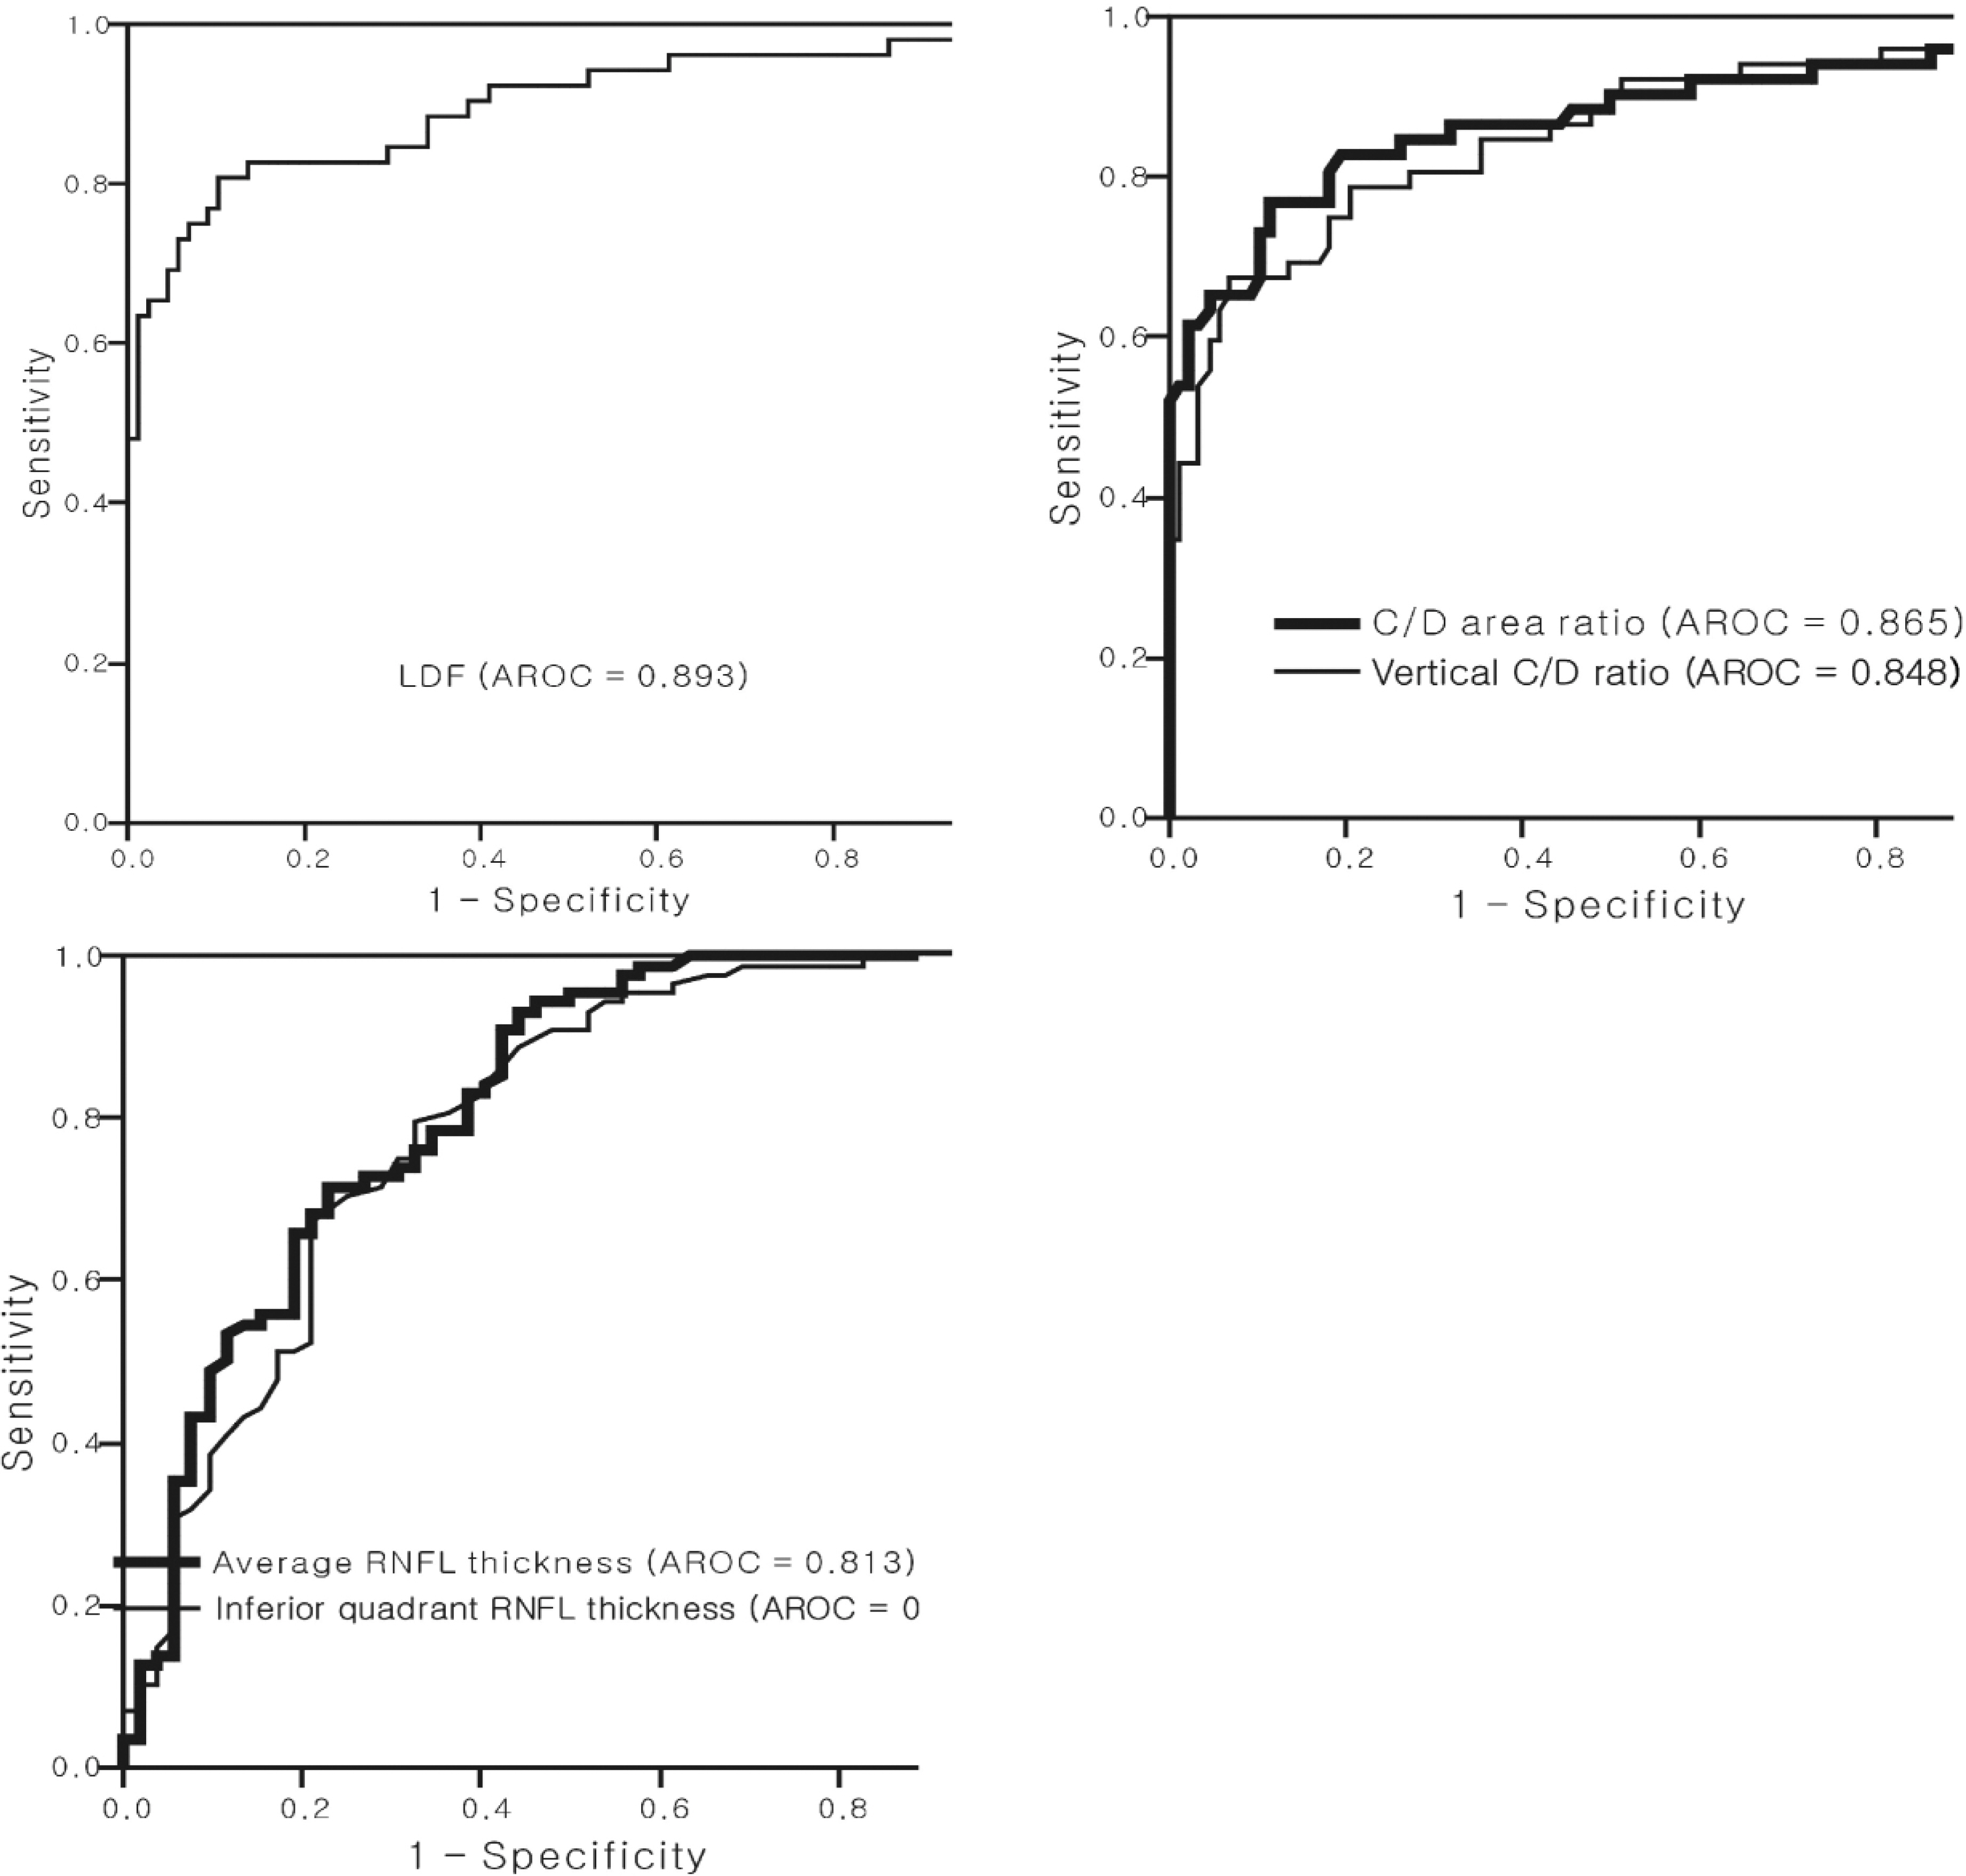
Figure 1. Areas under the receiver operating characteristic curves (AROC) of the linear discriminant function (LDF), of the best parameters from the Stratus OCT optic nerve head (cup/disc area ratio and vertical cup/disc ratio) and retinal nerve fiber layer (average thickness and inferior quadrant thickness).
Reference
-
References
1. Quigley HA, Addicks EM, Green WR. Optic nerve damage in human glaucoma. III. Quantitative correlation of nerve fiber loss and visual field defect in glaucoma, ischemic neuropathy, papilledema, and toxic neuropathy. Arch Ophthalmol. 1982; 100:135–46.2. Sommer A, Katz J, Quigley HA, et al. Clinically detectable nerve fiber atrophy precedes the onset of glaucomatous field loss. Arch Ophthalmol. 1991; 109:77–83.
Article3. Quigley HA, Katz J, Derick RJ, et al. An evaluation of optic disc and nerve fiber layer examinations in monitoring progression of early glaucoma damage. Ophthalmology. 1992; 99:19–28.
Article4. Uhm KB, Hong C, Kim JH, Baek CE. Sensitivity, specificity, and predictive value of optic disc parameters in primary open-angle glaucoma. J Korean Ophthalmol Soc. 1997; 38:1819–26.5. Jonas JB, Gusek GC, Naumann GO. Optic disc, cup and neuroretinal rim size, configuration and correlations in normal eyes. Invest Ophthalmol Vis Sci. 1995; 29:1151–8.6. Chi T, Ritch R, Stickler D, et al. Racial differences in optic nerve head parameters. Arch Ophthalmol. 1989; 107:836–9.
Article7. Poinoosawmy D, Fontana L, Wu JX, et al. Variation of nerve fiber layer thickness measurements with age and ethnicity by scanning laser polarimetry. Br J Ophthalmol. 1997; 81:350–4.8. Paunescu LA, Schuman JS, Price LL, et al. Reproducibility of nerve fiber thickness, macular thickness, and optic nerve head measurements using Stratus OCT. Invest Ophthalmol Vis Sci. 2004; 45:1716–24.9. Garway-Heath DF, Hitchings RA. Sources of bias in studies of optic disc and retinal nerve fiber layer morphology. Br J Ophthalmol. 1998; 82:986.10. Brusini P, Salvetat ML, Zeppieri M, et al. Comparison between GDx VCC scanning laser polarimetry and Stratus OCT optical coherence tomography in the diagnosis of chronic glaucoma. Acta Ophthalmol Scand. 2006; 84:650–5.
Article11. Bourne RR, Medeiros FA, Bowd C, et al. Comparability of retinal nerve fiber layer thickness measurements of optical coherence tomography instruments. Invest Ophthalmol Vis Sci. 2005; 46:1280–5.
Article12. Pieroth L, Schuman JS, Hertzmark E, et al. Evaluation of focal defects of the nerve fiber layer using optical coherence tomography. Ophthalmology. 1999; 106:570–9.
Article13. Chen HY, Huang ML. Discrimination between normal and glaucomatous eyes using Stratus optical coherence tomography in Taiwan Chinese subjects. Graefes Arch Clin Exp Ophthalmol. 2005; 243:894–902.
Article14. Medeiros FA, Zangwill LM, Bowd C, et al. Evaluation of retinal nerve fiber layer, optic nerve head, and macular thickness measurements for glaucoma detection using optical coherence tomography. Am J Ophthalmol. 2005; 139:44–55.
Article15. Wollstein G, Ishikawa H, Wang J, et al. Comparison of three optical coherence tomography scanning areas for detection of glaucomatous damage. Am J Ophthalmol. 2005; 139:39–43.
Article16. Manassakorn A, Nouri-Mahdavi K, Caprioli J. Comparison of retinal nerve fiber layer thickness and optic disk algorithms with optical coherence tomography to detect glaucoma. Am J Ophthalmol. 2006; 141:105–15.
Article17. Bowd C, Zangwill LM, Berry CC, et al. Detecting early glaucoma by assessment of retinal nerve fiber layer thickness and visual function. Invest Ophthalmol Vis Sci. 2001; 42:1993–2003.18. Zangwill LM, Bowd C, Berry CC, et al. Discriminating between normal and glaucomatous eyes using the Heidelberg retina tomograph, GDx nerve fiber analyzer, and optical coherence tomograph. Arch Ophthalmol. 2001; 119:985–93.
Article19. Kamal DS, Garway-Heath DF, Hitchings RA, et al. Use of sequential Heidelberg retina tomograph images to identify changes at the optic disc in ocular hypertensive patients at risk of developing glaucoma. Br J Ophthalmol. 2000; 84:993–8.
Article20. Parisi V, Manni G, Centofanti M, et al. Correlation between optical coherence tomography, pattern electroretinogram, and visual evoked potentials in open-angle glaucoma patients. Ophthalmology. 2001; 108:905–12.
Article21. Kang KD, Park CK. Comparison of diagnostic precision between preprogramed indicator and newly calculated indicator in optical coherence tomography. J Korean Ophthalmol Soc. 2006; 47:243–52.22. Leung CK, Chan WM, Hui YL, et al. Analysis of retinal nerve fiber layer and optic nerve head in glaucoma with different reference plane offsets, using optical coherence tomography. Invest Ophthalmol Vis Sci. 2005; 46:891–9.
Article23. Iliev ME, Meyenberg A, Garweg JG. Morphometric assessment of normal, suspect and glaucomatous optic discs with Stratus OCT and HRT II. Eye. 2006; 20:1288–99.
Article24. Schuman JS, Wollstein G, Farra T, et al. Comparison of optic nerve head measurements obtained by optical coherence tomography and confocal scanning laser ophthalmoscopy. Am J Ophthalmol. 2003; 135:504–12.
Article25. Jonas JB, Schmidt AM, Muller-Bergh JA, et al. Human optic nerve fiber count and optic disc size. Invest Ophthalmol Vis Sci. 1992; 33:2012–8.26. Savini G, Zanini M, Carelli V, et al. Correlation between retinal nerve fiber layer thickness and optic nerve head size:an optical coherence tomography study. Br J Ophthalmol. 2005; 89:489–92.27. Bowd C, Zangwill LM, Blumenthal EZ, et al. Imaging of the optic disc and retinal nerve fiber layer: the effects of age, optic disc area, refractive error, and gender. J Opt Soc Am A Opt Image Sci Vis. 2002; 19:197–207.
Article
- Full Text Links
-
- Actions
-
Cited
- CITED
-
- Close
- Share
-
- Similar articles
-
- Comparison of Diagnostic Ability of 3D and Stratus Optical Coherence Tomography in Early Glaucoma
- Comparison of Time Domain OCT and Spectrum Domain OCT for Retinal Nerve Fiber Layer Assessment
- Comparison of Glaucomatous Parameters in Normal, Ocular Hypertensive and Glaucomatous Eyes Using Optical Coherence Tomography 3000
- Optical Coherence Tomography Parameters of Normal, Glaucoma Suspect, and Early Glaucoma Patients
- The Effect of Various Factors on Variability of Retinal Nerve Fiber Layer Thickness Measurements Using Optical Coherence Tomography
