Retinal Nerve Fiber Layer Thickness Measurement Comparison Using Spectral Domain and Swept Source Optical Coherence Tomography
- Affiliations
-
- 1Department of Ophthalmology, Seoul National University Bundang Hospital, Seongnam, Korea. twkim7@snu.ac.kr
- KMID: 2160465
- DOI: http://doi.org/10.3341/kjo.2016.30.2.140
Abstract
- PURPOSE
To investigate the retinal nerve fiber layer (RNFL) thickness concordance when measured by spectral domain (SD) and swept source (SS) optical coherence tomography (OCT), and to compare glaucoma-discriminating capability.
METHODS
RNFL thicknesses were measured with the scan circle, centered on the optic nerve head, in 55 healthy, 41 glaucoma suspected, and 87 glaucomatous eyes. The RNFL thickness measured by the SD-OCT (sdRNFL thickness) and SS-OCT (ssRNFL thickness) were compared using the t-test. Bland-Altman analysis was performed to examine their agreement. We compared areas under the receiver operating characteristics curve and examined sdRNFL and ssRNFL thickness for discriminating glaucomatous eyes from healthy eyes, and from glaucoma suspect eyes.
RESULTS
The average ssRNFL thickness was significantly greater than sdRNFL thickness in healthy (110.0 ± 7.9 vs. 100.1 ± 6.8 µm, p < 0.001), glaucoma suspect (96.8 ± 9.3 vs. 89.6 ± 7.9 µm, p < 0.001), and glaucomatous eyes (74.3 ± 14.2 vs. 69.1 ± 12.4 µm, p = 0.011). Bland-Altman analysis showed that there was a tendency for the difference between ssRNFL and sdRNFL to increase in eyes with thicker RNFL. The area under the curves of the average sdRNFL and ssRNFL thickness for discriminating glaucomatous eyes from healthy eyes (0.984 vs. 0.986, p = 0.491) and glaucoma suspect eyes (0.936 vs. 0.918, p = 0.132) were comparable.
CONCLUSIONS
There was a tendency for ssRNFL thickness to increase, compared with sdRNFL thickness, in eyes with thicker RNFL. The ssRNFL thickness had comparable diagnostic capability compared with sdRNFL thickness for discriminating glaucomatous eyes from healthy eyes and glaucoma suspect eyes.
Keyword
MeSH Terms
Figure
-
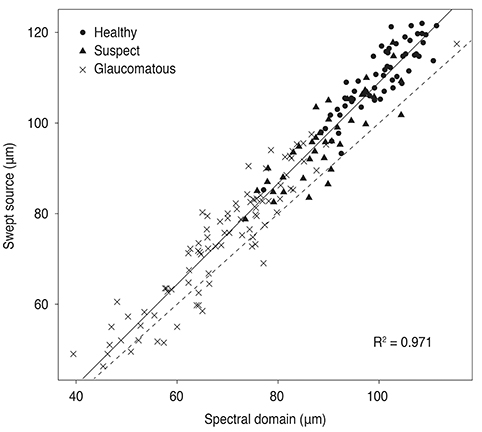
Fig. 1 Scatter plot of the average retinal nerve fiber layer thickness measurements for 183 eyes.
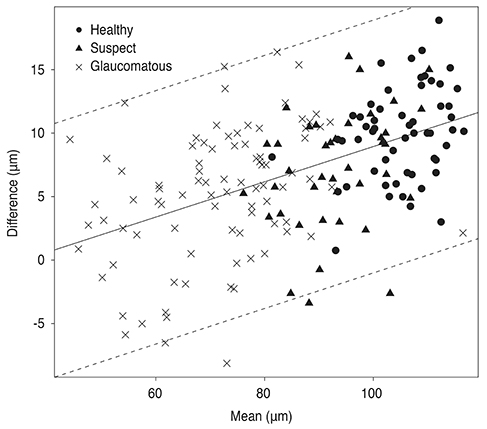
Fig. 2 Bland-Altman plot of average retinal nerve fiber layer (RNFL) thickness between swept source and spectral domain optical coherence tomography (OCT). Note that the swept source OCT RNFL thickness was greater than that of spectral domain OCT in eyes with larger RNFL thickness. The solid line indicates the regression line and the dashed lines indicate the 95% limit of agreement.
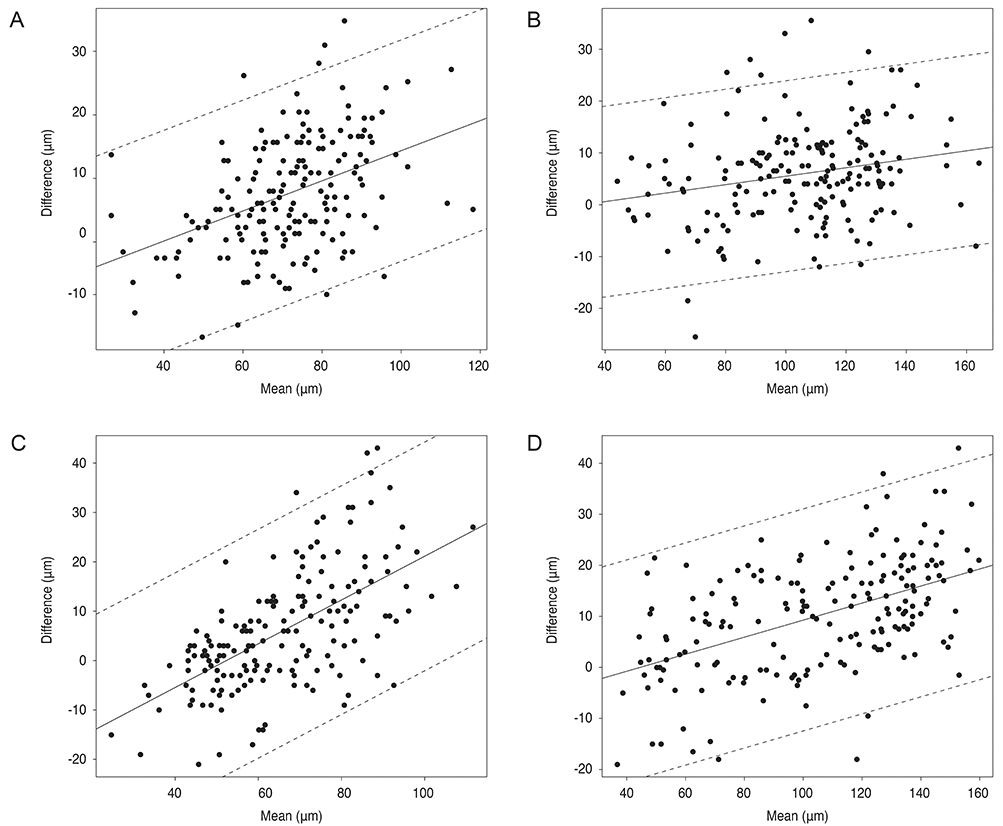
Fig. 3 Bland-Altman plots of agreement of quadrant retinal nerve fiber layer thicknesses between swept source and spectral domain optical coherence tomography at temporal (A), superior (B), nasal (C), and inferior (D) quadrants.
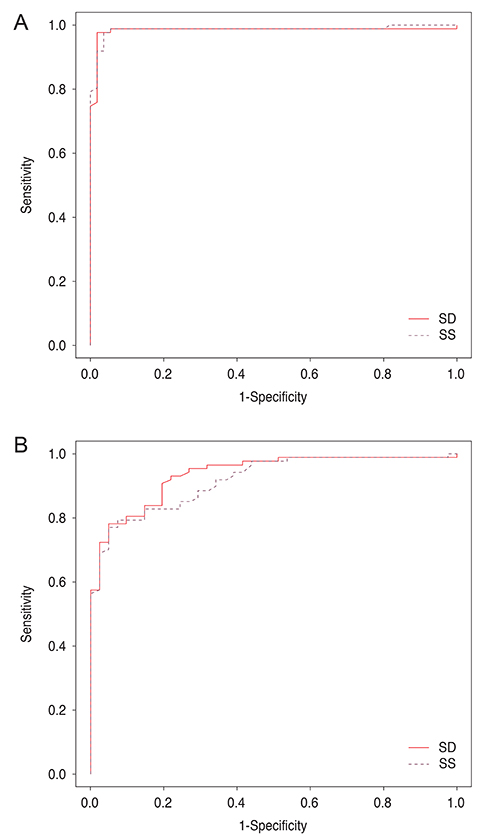
Fig. 4 The area under the curve for receiver operating characteristics of retinal nerve fiber layer thickness to discriminate glaucomatous eyes from healthy eyes (A) and suspect eyes (B). SD = spectral domain; SS = swept source.
Cited by 1 articles
-
A Comparison of Retinal Nerve Fiber Layer Thickness Measured Using Five Different Optical Coherence Tomography Devices
Youn Gon Lee, Young Hoon Hwang
J Korean Ophthalmol Soc. 2018;59(3):261-267. doi: 10.3341/jkos.2018.59.3.261.
Reference
-
1. Quigley HA, Katz J, Derick RJ, et al. An evaluation of optic disc and nerve fiber layer examinations in monitoring progression of early glaucoma damage. Ophthalmology. 1992; 99:19–28.2. Yucel YH, Gupta N, Kalichman MW, et al. Relationship of optic disc topography to optic nerve fiber number in glaucoma. Arch Ophthalmol. 1998; 116:493–497.3. Leung CK, Cheung CY, Lin D, et al. Longitudinal variability of optic disc and retinal nerve fiber layer measurements. Invest Ophthalmol Vis Sci. 2008; 49:4886–4892.4. Sehi M, Greenfield DS. Assessment of retinal nerve fiber layer using optical coherence tomography and scanning laser polarimetry in progressive glaucomatous optic neuropathy. Am J Ophthalmol. 2006; 142:1056–1059.5. Huang D, Swanson EA, Lin CP, et al. Optical coherence tomography. Science. 1991; 254:1178–1181.6. Drexler W, Fujimoto JG. State-of-the-art retinal optical coherence tomography. Prog Retin Eye Res. 2008; 27:45–88.7. Potsaid B, Baumann B, Huang D, et al. Ultrahigh speed 1050nm swept source/Fourier domain OCT retinal and anterior segment imaging at 100,000 to 400,000 axial scans per second. Opt Express. 2010; 18:20029–20048.8. Matsuo Y, Sakamoto T, Yamashita T, et al. Comparisons of choroidal thickness of normal eyes obtained by two different spectral-domain OCT instruments and one swept-source OCT instrument. Invest Ophthalmol Vis Sci. 2013; 54:7630–7636.9. Schuman JS, Hee MR, Puliafito CA, et al. Quantification of nerve fiber layer thickness in normal and glaucomatous eyes using optical coherence tomography. Arch Ophthalmol. 1995; 113:586–596.10. Varma R, Skaf M, Barron E. Retinal nerve fiber layer thickness in normal human eyes. Ophthalmology. 1996; 103:2114–2119.11. Budenz DL, Chang RT, Huang X, et al. Reproducibility of retinal nerve fiber thickness measurements using the stratus OCT in normal and glaucomatous eyes. Invest Ophthalmol Vis Sci. 2005; 46:2440–2443.12. Sung KR, Kim DY, Park SB, Kook MS. Comparison of retinal nerve fiber layer thickness measured by Cirrus HD and Stratus optical coherence tomography. Ophthalmology. 2009; 116:1264–1270.e1.13. Gyatsho J, Kaushik S, Gupta A, et al. Retinal nerve fiber layer thickness in normal, ocular hypertensive, and glaucomatous Indian eyes: an optical coherence tomography study. J Glaucoma. 2008; 17:122–127.14. Leung CK, Chan WM, Yung WH, et al. Comparison of macular and peripapillary measurements for the detection of glaucoma: an optical coherence tomography study. Ophthalmology. 2005; 112:391–400.15. Medeiros FA, Zangwill LM, Bowd C, et al. Evaluation of retinal nerve fiber layer, optic nerve head, and macular thickness measurements for glaucoma detection using optical coherence tomography. Am J Ophthalmol. 2005; 139:44–55.16. Mwanza JC, Oakley JD, Budenz DL, et al. Ability of cirrus HD-OCT optic nerve head parameters to discriminate normal from glaucomatous eyes. Ophthalmology. 2011; 118:241–248.17. Mwanza JC, Durbin MK, Budenz DL, et al. Glaucoma diagnostic accuracy of ganglion cell-inner plexiform layer thickness: comparison with nerve fiber layer and optic nerve head. Ophthalmology. 2012; 119:1151–1158.18. Shin HJ, Cho BJ. Comparison of retinal nerve fiber layer thickness between Stratus and Spectralis OCT. Korean J Ophthalmol. 2011; 25:166–173.19. Wollstein G, Schuman JS, Price LL, et al. Optical coherence tomography longitudinal evaluation of retinal nerve fiber layer thickness in glaucoma. Arch Ophthalmol. 2005; 123:464–470.20. Yuksel N, Altintas O, Ozkan B, et al. Discriminating ability of optical coherence tomography data in staging glaucomatous damage. Can J Ophthalmol. 2009; 44:297–307.21. Uchida H, Brigatti L, Caprioli J. Detection of structural damage from glaucoma with confocal laser image analysis. Invest Ophthalmol Vis Sci. 1996; 37:2393–2401.22. Wollstein G, Ishikawa H, Wang J, et al. Comparison of three optical coherence tomography scanning areas for detection of glaucomatous damage. Am J Ophthalmol. 2005; 139:39–43.
- Full Text Links
-
- Actions
-
Cited
- CITED
-
- Close
- Share
-
- Similar articles
-
- Retinal Nerve Fiber Layer Thickness Measurement Using Swept Source Optical Coherence Tomography in Healthy Korean
- Retinal Nerve Fiber Layer Thickness Measured by Spectral Domain Optical Coherence Tomography in Healthy Koreans
- Spectral-Domain Optical Coherence Tomography Findings in Acute Central Retinal Artery Occlusion
- Diagnostic Ability of Swept-Source and Spectral-Domain Optical Coherence Tomography for Glaucoma
- Comparison of Retinal Nerve Fiber Layer Thickness Measured by Spectral-Domain and Time-Domain Optical Coherence Tomography
