Diagnostic Ability of Swept-Source and Spectral-Domain Optical Coherence Tomography for Glaucoma
- Affiliations
-
- 1Department of Ophthalmology, Severance Hospital, Institute of Vision Research, Yonsei University College of Medicine, Seoul, Korea. kcyeye@yuhs.ac
- KMID: 2428916
- DOI: http://doi.org/10.3349/ymj.2018.59.7.887
Abstract
- PURPOSE
To compare the diagnostic abilities of swept-source optical coherence tomography (OCT) [Deep Range Imaging OCT-1 (DRI-OCT)] and spectral-domain OCT (Cirrus HD-OCT) for glaucoma in Korean adults.
MATERIALS AND METHODS
This retrospective study involved measuring peripapillary retinal nerve fiber layer (PP-RNFL) thickness, full macular thickness, and ganglion cell-inner plexiform layer (GC-IPL) thickness on two different OCT systems. We used three-dimensional optic disc scanning of DRI-OCT and included 12 clock-hour sectors for measurement of the PP-RNFL. Areas under receiver operating characteristic curves (AUCs) were calculated and compared to determine how well each system could distinguish control and glaucomatous patients.
RESULTS
Ninety-one healthy and 58 glaucomatous eyes were included. Both systems could clearly distinguish between control eyes and eyes with moderate to severe glaucoma. Among all sectors, the AUC values of areas associated with glaucoma were >0.7 for both OCTs. The PP-RNFL sector of highest AUC value on both OCTs was the inferior sector of the clock-hour map (0.968 and 0.959 in DRI-OCT and Cirrus HD-OCT, respectively). Among macular thickness sectors, AUC values were highest on both OCTs for the outer inferior sector (0.859 and 0.853 in DRI-OCT and Cirrus HD-OCT, respectively). The GC-IPL also provided high diagnostic values (DRI-OCT and Cirrus HD-OCT were the best in the average and inferior sectors, respectively).
CONCLUSION
Although the two OCT systems provided different thickness measurements, DRI-OCT exhibited as good, if not better, diagnostic ability for glaucoma as Cirrus HD-OCT in Korean adults.
Keyword
MeSH Terms
Figure
-
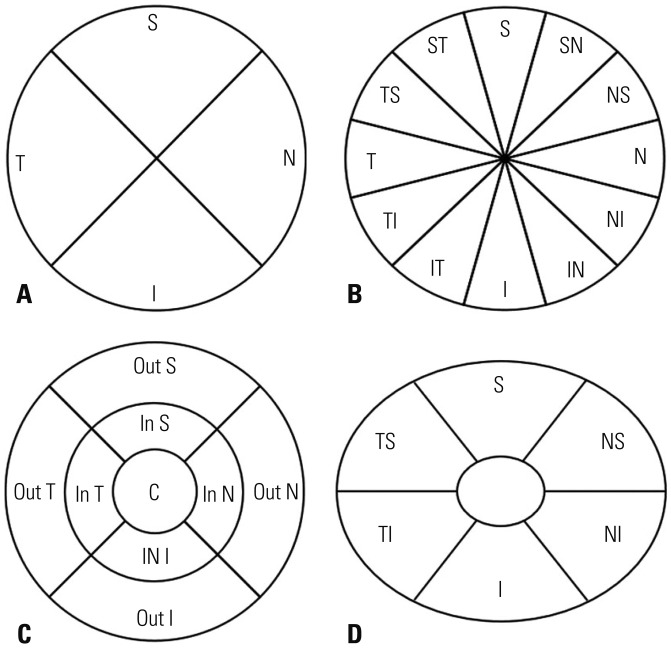
Fig. 1 Sectors used for optical coherence tomography (OCT) thickness measurements of peripapillary retinal nerve fiber layer thickness in both OCT systems (A: 4 sectors, B: 12 sectors). Sectors used for macular thickness (C) and ganglion cell inner plexiform layer thickness (D) measurements are also shown. All sectors shown are those used for right eye analyses. S, superior; N, nasal; I, inferior; T, temporal; SN, superonasal; NS, nasosuperior; NI, nasoinferior; IN, inferonasal; IT, inferotemporal; TI, temporoinferior; TS, temporosuperior; ST, superotemporal; Out S, outer superior; Out N, outer nasal; Out I, outer inferior; Out T, outer temporal; In S, inner superior; In N, inner nasal; In I, inner inferior; In T, inner temporal.
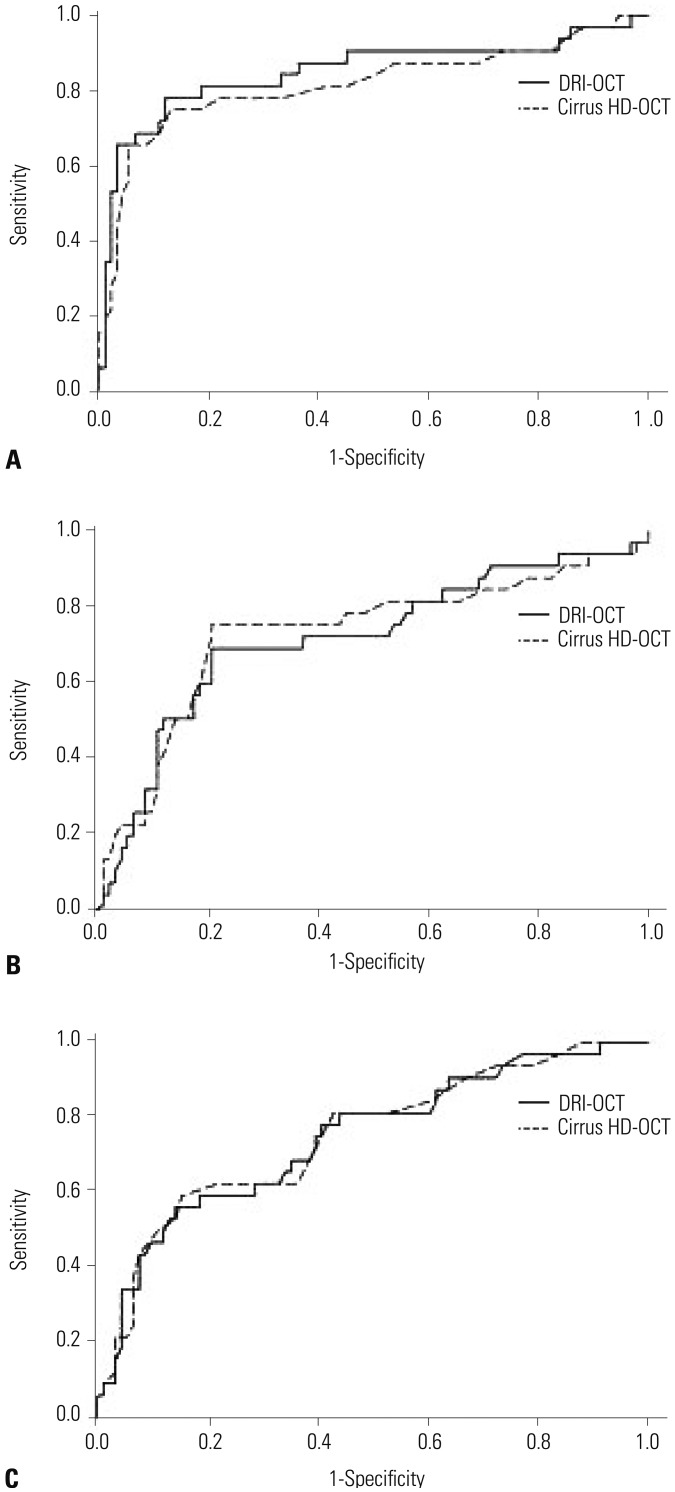
Fig. 2 Receiver operating characteristics curve of average peripapillary retinal nerve fiber layer thickness (A), macular thickness (B), and ganglion cell-inner plexiform layer thickness (C) measurements made with two optical coherence tomography (OCT) modalities (DRI-OCT and Cirrus HD-OCT) between control and early glaucoma.
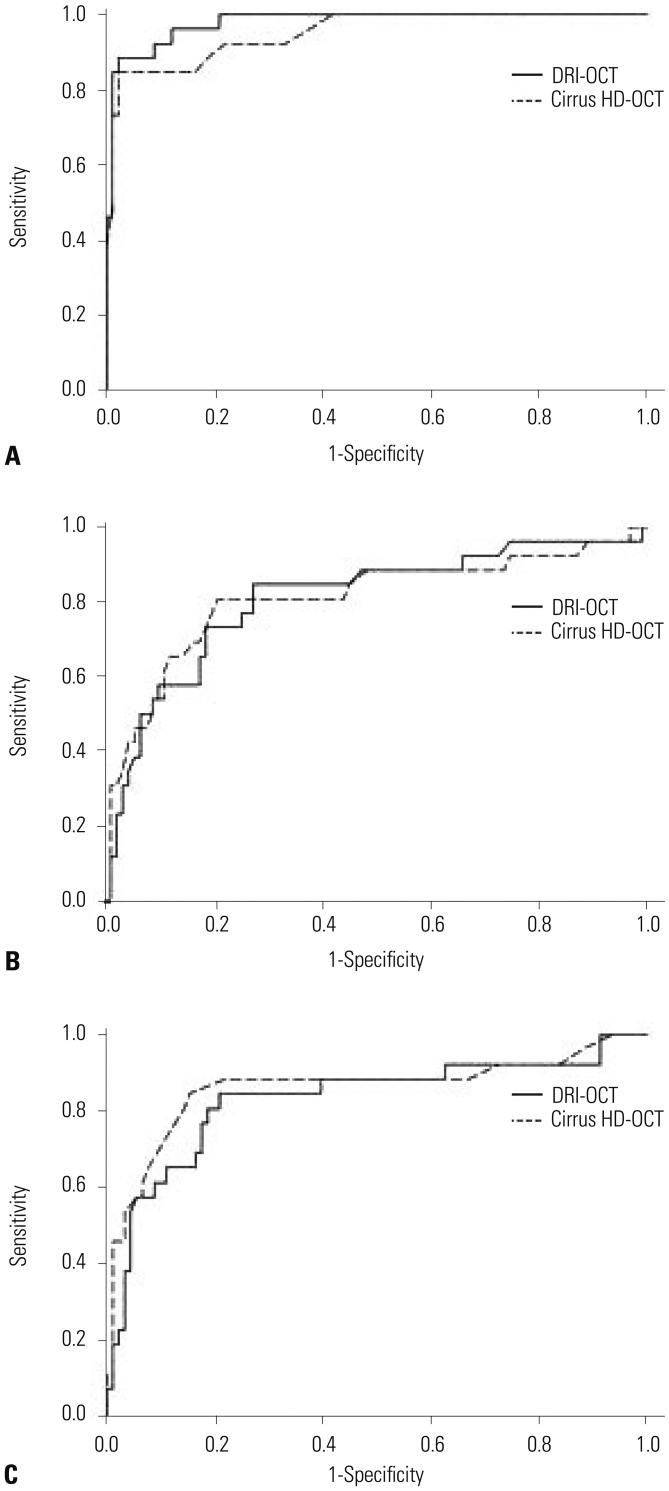
Fig. 3 Receiver operating characteristics curve of average peripapillary retinal nerve fiber layer thickness (A), macular thickness (B), and ganglion cell-inner plexiform layer thickness (C) measurements made with two optical coherence tomography (OCT) modalities (DRI-OCT and Cirrus HD-OCT) between control and moderate to severe glaucoma.
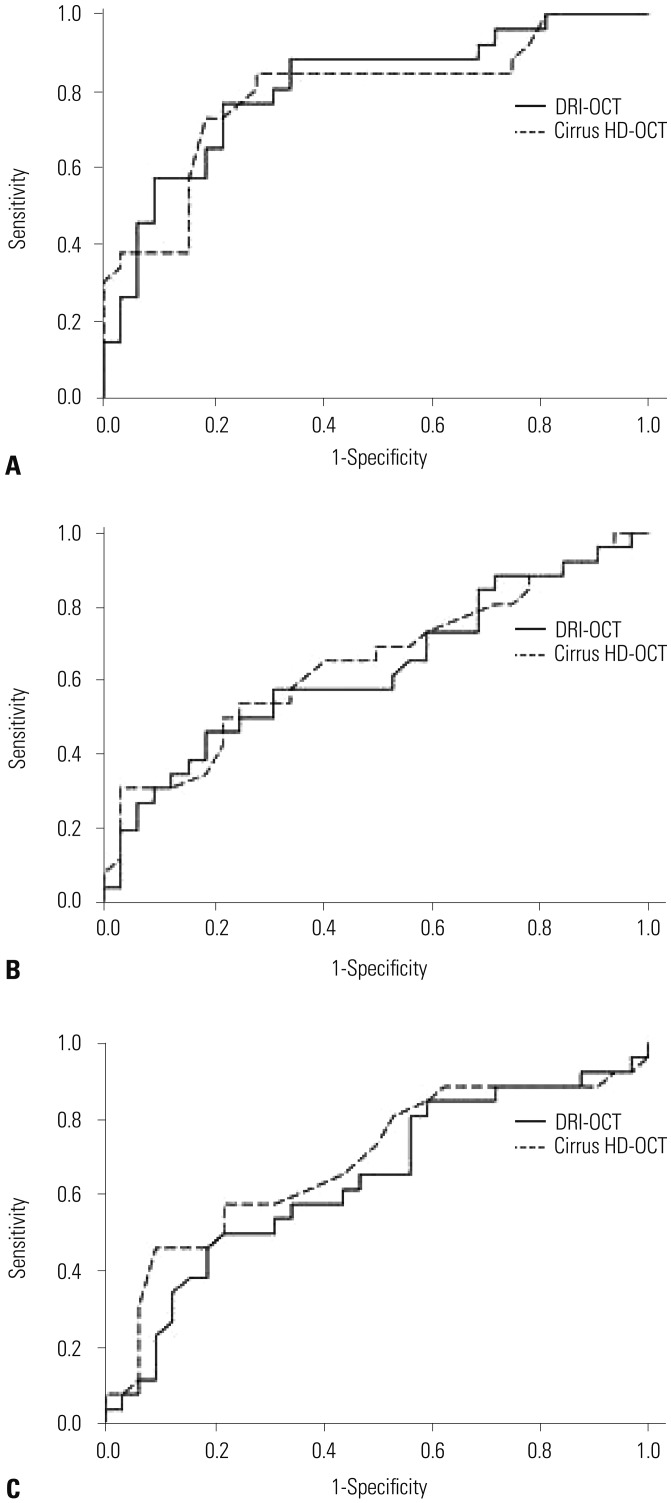
Fig. 4 Receiver operating characteristics curve of average peripapillary retinal nerve fiber layer thickness (A), macular thickness (B), and ganglion cell-inner plexiform layer thickness (C) measurements made with two optical coherence tomography (OCT) modalities (DRI-OCT and Cirrus HD-OCT) between early and moderate to severe glaucoma.
Reference
-
1. Bussel II, Wollstein G, Schuman JS. OCT for glaucoma diagnosis, screening and detection of glaucoma progression. Br J Ophthalmol. 2014; 98(Suppl 2):ii15–ii19. PMID: 24357497.
Article2. Leung CK. Diagnosing glaucoma progression with optical coherence tomography. Curr Opin Ophthalmol. 2014; 25:104–111. PMID: 24370973.
Article3. Bae HW, Lee SY, Kim S, Park CK, Lee K, Kim CY, et al. Asymmetry of peak thicknesses between the superior and inferior retinal nerve fiber layers for early glaucoma detection: a simple screening method. Yonsei Med J. 2018; 59:135–140. PMID: 29214788.
Article4. Gabriele ML, Wollstein G, Ishikawa H, Kagemann L, Xu J, Folio LS, et al. Optical coherence tomography: history, current status, and laboratory work. Invest Ophthalmol Vis Sci. 2011; 52:2425–2436. PMID: 21493951.
Article5. Mrejen S, Spaide RF. Optical coherence tomography: imaging of the choroid and beyond. Surv Ophthalmol. 2013; 58:387–429. PMID: 23916620.
Article6. Lee SY, Kwon HJ, Bae HW, Seo SJ, Lee YH, Hong S, et al. Frequency, type and cause of artifacts in swept-source and cirrus HD optical coherence tomography in cases of glaucoma and suspected glaucoma. Curr Eye Res. 2016; 41:957–964. PMID: 26431251.
Article7. Lee SY, Bae HW, Kwon HJ, Seong GJ, Kim CY. Repeatability and agreement of swept source and spectral domain optical coherence tomography evaluations of thickness sectors in normal eyes. J Glaucoma. 2017; 26:e46–e53. PMID: 27599180.
Article8. Yang Z, Tatham AJ, Weinreb RN, Medeiros FA, Liu T, Zangwill LM. Diagnostic ability of macular ganglion cell inner plexiform layer measurements in glaucoma using swept source and spectral domain optical coherence tomography. PLoS One. 2015; 10:e0125957. PMID: 25978420.
Article9. Yang Z, Tatham AJ, Zangwill LM, Weinreb RN, Zhang C, Medeiros FA. Diagnostic ability of retinal nerve fiber layer imaging by swept-source optical coherence tomography in glaucoma. Am J Ophthalmol. 2015; 159:193–201. PMID: 25448991.10. Ha A, Lee SH, Lee EJ, Kim TW. Retinal nerve fiber layer thickness measurement comparison using spectral domain and swept source pptical coherence tomography. Korean J Ophthalmol. 2016; 30:140–147. PMID: 27051263.11. Lee KM, Lee EJ, Kim TW, Kim H. Comparison of the abilities of SD-OCT and SS-OCT in evaluating the thickness of the macular inner retinal layer for glaucoma diagnosis. PLoS One. 2016; 11:e0147964. PMID: 26812064.
Article12. Chylack LT Jr, Wolfe JK, Singer DM, Leske MC, Bullimore MA, Bailey IL, et al. The lens opacities classification system III. The longitudinal study of cataract study group. Arch Ophthalmol. 1993; 111:831–836. PMID: 8512486.13. Budenz DL, Rhee P, Feuer WJ, McSoley J, Johnson CA, Anderson DR. Comparison of glaucomatous visual field defects using standard full threshold and Swedish interactive threshold algorithms. Arch Ophthalmol. 2002; 120:1136–1141. PMID: 12215086.
Article14. DeLong ER, DeLong DM, Clarke-Pearson DL. Comparing the areas under two or more correlated receiver operating characteristic curves: a nonparametric approach. Biometrics. 1988; 44:837–845. PMID: 3203132.
Article15. Mwanza JC, Durbin MK, Budenz DL, Sayyad FE, Chang RT, Neelakantan A, et al. Glaucoma diagnostic accuracy of ganglion cell-inner plexiform layer thickness: comparison with nerve fiber layer and optic nerve head. Ophthalmology. 2012; 119:1151–1158. PMID: 22365056.
Article16. Medeiros FA, Zangwill LM, Bowd C, Vessani RM, Susanna R Jr, Weinreb RN. Evaluation of retinal nerve fiber layer, optic nerve head, and macular thickness measurements for glaucoma detection using optical coherence tomography. Am J Ophthalmol. 2005; 139:44–55. PMID: 15652827.
Article17. Wollstein G, Schuman JS, Price LL, Aydin A, Stark PC, Hertzmark E, et al. Optical coherence tomography longitudinal evaluation of retinal nerve fiber layer thickness in glaucoma. Arch Ophthalmol. 2005; 123:464–470. PMID: 15824218.
Article18. Mwanza JC, Oakley JD, Budenz DL, Anderson DR. Cirrus Optical Coherence Tomography Normative Database Study Group. Ability of cirrus HD-OCT optic nerve head parameters to discriminate normal from glaucomatous eyes. Ophthalmology. 2011; 118:241–248.e1. PMID: 20920824.
Article19. Harwerth RS, Wheat JL, Fredette MJ, Anderson DR. Linking structure and function in glaucoma. Prog Retin Eye Res. 2010; 29:249–271. PMID: 20226873.
Article20. Leung CK, Chan WM, Yung WH, Ng AC, Woo J, Tsang MK, et al. Comparison of macular and peripapillary measurements for the detection of glaucoma: an optical coherence tomography study. Ophthalmology. 2005; 112:391–400. PMID: 15745764.21. Ojima T, Tanabe T, Hangai M, Yu S, Morishita S, Yoshimura N. Measurement of retinal nerve fiber layer thickness and macular volume for glaucoma detection using optical coherence tomography. Jpn J Ophthalmol. 2007; 51:197–203. PMID: 17554482.
Article22. Nakatani Y, Higashide T, Ohkubo S, Takeda H, Sugiyama K. Evaluation of macular thickness and peripapillary retinal nerve fiber layer thickness for detection of early glaucoma using spectral domain optical coherence tomography. J Glaucoma. 2011; 20:252–259. PMID: 20520570.
Article23. Wang M, Hood DC, Cho JS, Ghadiali Q, De Moraes CG, Zhang X, et al. Measurement of local retinal ganglion cell layer thickness in patients with glaucoma using frequency-domain optical coherence tomography. Arch Ophthalmol. 2009; 127:875–881. PMID: 19597108.
Article24. Lee JW, Morales E, Sharifipour F, Amini N, Yu F, Afifi AA, et al. The relationship between central visual field sensitivity and macular ganglion cell/inner plexiform layer thickness in glaucoma. Br J Ophthalmol. 2017; 101:1052–1058. PMID: 28077369.
Article25. Nakano N, Hangai M, Nakanishi H, Mori S, Nukada M, Kotera Y, et al. Macular ganglion cell layer imaging in preperimetric glaucoma with speckle noise-reduced spectral domain optical coherence tomography. Ophthalmology. 2011; 118:2414–2426. PMID: 21924499.
Article26. Hood DC, Anderson SC, Wall M, Raza AS, Kardon RH. A test of a linear model of glaucomatous structure-function loss reveals sources of variability in retinal nerve fiber and visual field measurements. Invest Ophthalmol Vis Sci. 2009; 50:4254–4266. PMID: 19443710.
Article27. Hood DC, Raza AS, de Moraes CG, Liebmann JM, Ritch R. Glaucomatous damage of the macula. Prog Retin Eye Res. 2013; 32:1–21. PMID: 22995953.
Article28. Hood DC, Wang DL, Raza AS, de Moraes CG, Liebmann JM, Ritch R. The locations of circumpapillary glaucomatous defects seen on frequency-domain OCT scans. Invest Ophthalmol Vis Sci. 2013; 54:7338–7343. PMID: 24135758.
Article29. Elbendary AM, Mohamed Helal R. Discriminating ability of spectral domain optical coherence tomography in different stages of glaucoma. Saudi J Ophthalmol. 2013; 27:19–24. PMID: 23964182.
Article30. Nouri-Mahdavi K, Nowroozizadeh S, Nassiri N, Cirineo N, Knipping S, Giaconi J, et al. Macular ganglion cell/inner plexiform layer measurements by spectral domain optical coherence tomography for detection of early glaucoma and comparison to retinal nerve fiber layer measurements. Am J Ophthalmol. 2013; 156:1297–1307.e2. PMID: 24075422.
Article
- Full Text Links
-
- Actions
-
Cited
- CITED
-
- Close
- Share
-
- Similar articles
-
- Diagnostic Ability of Macular Ganglion Cell Layer Measurements in Glaucoma Using Swept Source Optical Coherence Tomography
- The Structure-function Relationships between Two Different Optical Coherence Tomography in Patients with High Myopic Glaucoma
- Retinal Nerve Fiber Layer Thickness Measurement Comparison Using Spectral Domain and Swept Source Optical Coherence Tomography
- Comparison of Image Quality between Swept-Source and Spectral-Domain Optical Coherence Tomography According to Ocular Media Opacity
- Clinical Usefulness of Spectral-Domain Optical Coherence Tomography in Glaucoma and NAION
