Assessment of Fluid Shifts of Body Compartments using Both Bioimpedance Analysis and Blood Volume Monitoring
- Affiliations
-
- 1Department of Internal Medicine, College of Medicine, Chung-Ang University, Seoul, Korea. intmdoh@hanmail.net
- 2Kang Dialysis Center, Seoul, Korea.
- KMID: 2157786
- DOI: http://doi.org/10.3346/jkms.2006.21.1.75
Abstract
- Fluid shifts are commonplace in chronic hemodialysis patients during the intra- and interdialytic periods. In this study, we evaluated fluid shifts of body compartments using both bioimpedance spectroscopy and blood volume monitoring from the start to the end of hemodialysis. 24 stable hemodialysis patients were included on the study. Relative change of blood volume was progressively reduced from the start to the end of hemodialysis (1 hr, -7.22+/-3.23%; 2 hr, -9.78+/-4.69%; 3 hr, -12.88+/-5.65%; 4 hr, -15.41+/-6.54%, respectively). Mean % reduction of intracellular fluid was not significantly different to that of extracellular fluid at the end of hemodialysis (delta ICF, -6.58+/-5.34% vs. delta ECF, -7.07+/-5.12%). Mean % fluid reduction of arms, legs and trunk was -11.98+/-6.76%, -6.43+/-4.37% and -7.47+/-4.56%, respectively at the end of hemodialysis. There were 3 characteristic patterns in blood-volume change. Similar amounts of fluid were removed from the extracellular and intracellular compartments during hemodialysis, with the arms showing the greatest loss in terms of body segments. The pattern of blood volume change measured by blood volume monitoring may be useful for more accurate determination of dry-weight and for correcting volume status in hemodialysis patients.
MeSH Terms
Figure
-

Fig. 1 Time course differences of blood volume, ICF, ECF. Relative change of blood volume is significantly reduced from the start to the end of hemodialysis (1 hr, -7.22±3.23%; 2 hr, -9.78±4.69%; 3 hr, -12.88±5.65%; 4 hr, -15.41±6.54%, respectively). Extracellualr fluid is predominantly reduced compared to intracellular fluid until 3 hr of hemodialysis (ΔECF, -6.37±5.88% vs. ΔICF, -3.34±2.83%,). After 3 hr of hemodialysis session, reduction of intracellular fluid becomes steep. Mean % reduction of ICF is equal to that of ECF at the end of hemodialysis (ΔICF, -6.58±5.34% vs. ΔECF, -7.07±5.12%). ICF, intracellular fluid; ECF, extracellular fluid.
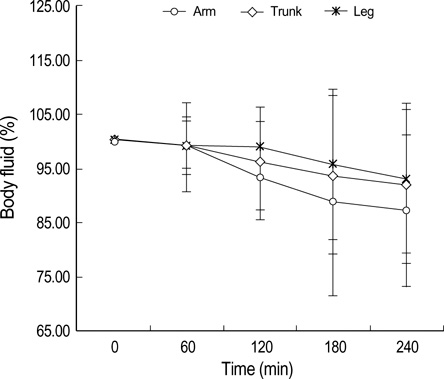
Fig. 2 Time course differences of body compartments. The fluid of arm, leg and trunk is significantly and progressively decreased from the start to the end of hemodialysis. % fluid reduction of arms, legs and trunk is -11.98±6.76%, -6.43±4.37% and -7.47±4.56%, respectively at the end of hemodialysis. The fluid reduction of arms is the greatest.
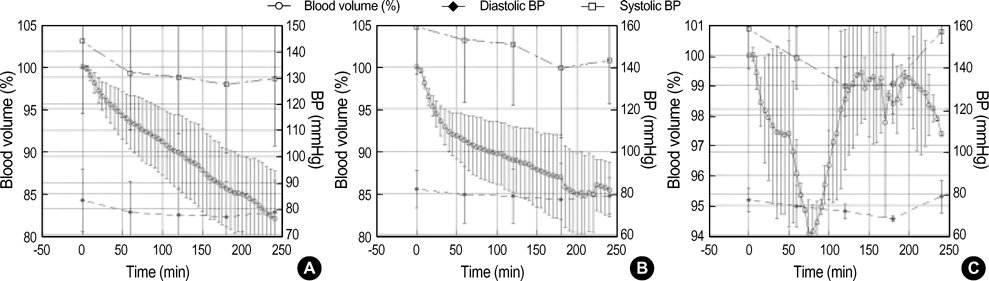
Fig. 3 Three patterns in reduction of blood volume. (A) Type 1 is "continuous and linear reduction type". (B) Type 2 is "curvilinear reduction type". (C) Type 3 is "early reduction and plasma refilling type".
Cited by 1 articles
-
Association Between Changes in Bioelectrical Impedance Analysis (BIA) Parameter and the Clinical Outcomes in Patients With Acute Heart Failure
Kyu-Sun Lee, Jae-hyoung Kim, Jeehoon Kang, Hyun-Jai Cho, Hae-Young Lee
J Korean Med Sci. 2023;38(35):e276. doi: 10.3346/jkms.2023.38.e276.
Reference
-
1. Henderson LW. Symptomatic hypotension during hemodialysis. Kidney Int. 1980. 17:571–576.
Article2. Jack QJ, Ravindra LM. Assessment of dry weight in hemodialysis: An overview. J Am Soc Nephrol. 1999. 10:392–403.3. Ishibe S, Peixoto AJ. Methods of assessment of volume status and intercompartmental fluid shifts in hemodialysis patients: implications in clinical practice. Semin Dial. 2004. 17:37–43.
Article4. Kouw PM, Kooman JP, Cheriex EC, Olthof CG, de Vries PM, Leunissen KM. Assessment of postdialysis dry weight: a comparison of techniques. J Am Soc Nephrol. 1993. 4:98–104.
Article5. Lauster F, Gerzer R, Weil J, Fulle HJ, Schiffl H. Assessment of dry body weight in hemodialysis patients by the biochemical marker cGMP. Nephrol Dial Transplant. 1990. 5:356–361.6. Franz M, Pohanka E, Tribl B, Woloszczuk W, Horl WH. Living on chronic hemodialysis between dryness and fluid overload. Kidney Int Suppl. 1997. 59:Suppl 59. S39–S42.7. Moreno FL, Hagan AD, Holmen JR, Pryor TA, Strickland RD, Castle CH. Evaluation of size and dynamics of the inferior vena cava as an index of right-sided cardiac function. Am J Cardiol. 1984. 53:579–585.
Article8. Cheriex EC, Leunissen KM, Janssen JH, Mooy JM, van Hooff JP. Echography of the inferior vena cava is a simple and reliable tool for estimation of "dry weight" in hemodialysis patients. Nephrol Dial Transplant. 1989. 4:563–568.9. Katzarski KS, Nisell J, Randmaa I, Danielsson A, Freyschuss U, Bergstrom J. A critical evaluation of ultrasound measurement of inferior vena cava diameter in assessing dry weight in normotensive and hypertensive hemodialysis patients. Am J Kidney Dis. 1997. 30:459–465.
Article10. Fisch BJ, Spiegel DM. Assessment of excess fluid distribution in chronic hemodialysis patients using bioimpedance spectroscopy. Kidney Int. 1996. 49:1105–1109.
Article11. Zhu F, Schneditz D, Levin NW. Sum of segmental bioimpedance analysis during ultrafiltration and hemodialysis reduces sensitivity to changes in body position. Kidney Int. 1999. 56:692–699.
Article12. Zhu F, Schneditz D, Wang E, Martin K, Morris AT, Levin HW. Validation of changes in extracellular volume measured during hemodialysis using a segmental bioimpedance technique. ASAIO J. 1998. 44:M541–M545.
Article13. Cox-Reijven PL, Kooman JP, Soeters PB, Van der Sande FM, Leunissen KM. Role of bioimpedance spectroscopy in assessment of body water compartments in hemodialysis patients. Am J Kidney Dis. 2001. 38:832–838.
Article14. Diskin CJ, Stokes TJ, Dansby LM, Carter TB, Radcliff L, Thomas SG. Towards an understanding of oedema. BMJ. 1999. 318:1610–1613.
Article15. Shulman T, Heidenheim AP, Kianfar C, Shulman SM, Lindsay RM. Preserving central blood volume: changes in body fluid compartments during hemodialysis. ASAIO J. 2001. 47:615–618.
Article16. Chanchairujira T, Mehta RL. Assessing fluid change in hemodialysis: whole body versus sum of segmental bioimpedance spectroscopy. Kidney Int. 2001. 60:2337–2342.
Article17. Bedogni G, Malavolti M, Severi S, Mussi C, Fantuzzi AL, Battistini N. Accuracy of an eight point tactile-electrode impedance method in the assessment of total body water. Eur J Clin Nutr. 2002. 56:1143–1148.18. Zucchelli P, Santoro A. Dialysis-induced hypotension: A fresh look at pathophysiology. Blood Purif. 1993. 11:85–98.
Article19. Andrulli S, Colzani S, Mascia F, Lucchi L, Stipo L, Bigi MC, Crepaldi M, Redaelli B, Albertazzi A, Locatelli F. The role of blood volume reduction in the genesis of intradialytic hypotension. Am J Kidney Dis. 2002. 40:1244–1254.
Article20. Mitra S, Chamney P, Greenwood R, Farrington K. Linear decay of relative blood volume during ultrafiltration predicts hemodynamic instability. Am J Kidney Dis. 2002. 40:556–565.
Article
- Full Text Links
-
- Actions
-
Cited
- CITED
-
- Close
- Share
-
- Similar articles
-
- Estimation of Body Fluid Volume by Bioimpedance Spectroscopy in Patients with Hyponatremia
- Clinical usefulness of bioimpedance analysis for assessing volume status in patients receiving maintenance dialysis
- Measurement of Fluid Status Using Bioimpedance Methods in Korean Pediatric Patients on Hemodialysis
- Evaluation and Management of Volume Status: A Practical View
- Modelling the Expandable Body Fluid Space after I.V. Fluid Infusion
