Hepatic Hemangiomas: Spectrum of US Appearances on Gray-scale, Power Doppler, and Contrast-Enhanced US
- Affiliations
-
- 1Department of Radiology and the Institute of Radiation Medicine, Seoul National University College of Medicine, Seoul, Korea.
- KMID: 1378944
- DOI: http://doi.org/10.3348/kjr.2000.1.4.191
Abstract
- Because US plays a key role in the initial evaluation of hepatic hemangiomas,knowledge of the entire spectrum of US appearances of these tumors is impor-tant. Most hemangiomas have a distinctive US appearance, and even with those with atypical appearances on conventional gray-scale US, specific diagnoses can be made using pulse-inversion harmonic US with contrast agents. In this essay,we review the spectrum of US appearances of hepatic hemangiomas on conven-tional gray-scale, power Doppler, and pulse-inversion harmonic US with contrast agents.
Keyword
MeSH Terms
Figure
-
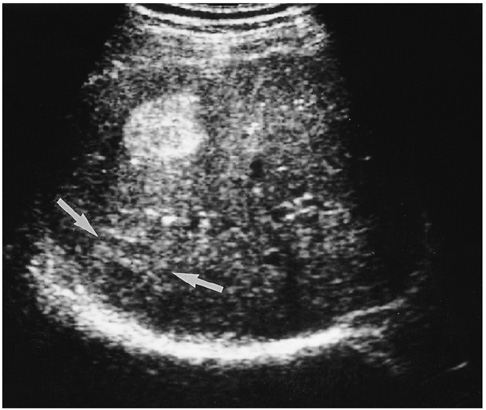
Fig. 1 A 36-year-old man with a hepatic hemangioma showing typical US features including uniform hyperechogenicity, well-defined margins and posterior sonic enhancement (arrows).

Fig. 2 A 46-year-old man with a hepatic hemangioma in the right lobe. Transverse US shows a well-defined large mass of heterogeneous echogenecity with hypoechoic foci. A thin echogenic rim seen around the tumor (arrowheads) suggests hepatic hemangioma.
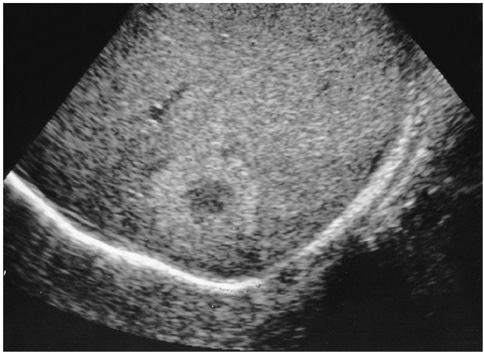
Fig. 3 A 42-year-old man with a hepatic hemangioma in the right lobe. Oblique sagittal US shows a well-defined hyperechoic lesion with a hypoechoic central portion.
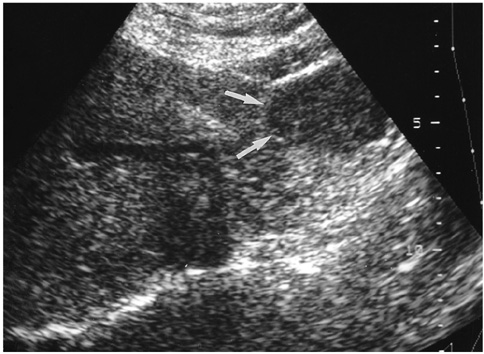
Fig. 4 A 60-year-old woman with a hepatic hemangioma in the left lobe. Transverse US demonstrates contour bulging; the mass is subtly hypoechoic (arrows) relative to normal liver parenchyma and lacks an echogenic border.

Fig. 5 A 66-year-old man with a diffuse hemangioma in the right lobe. A. Transverse US shows a large heterogeneous mass (arrows). The major portion of the lesion shows hyperechogenicity, especially in the periphery, and within it scattered hypoechoic foci are noted (arrowheads). Although the lesion abuts the right portal vein, there is no evidence of invasion of this vessel. B. Celiac angiogram shows diffuse enhancement with scattered foci of contrast material puddling.

Fig. 6 A 49-year-old man with a hepatic hemangioma in the left lobe. Sagittal US shows a small isoechoic mass detectable only by its echogenic border (arrows) and subtle contour bulging.
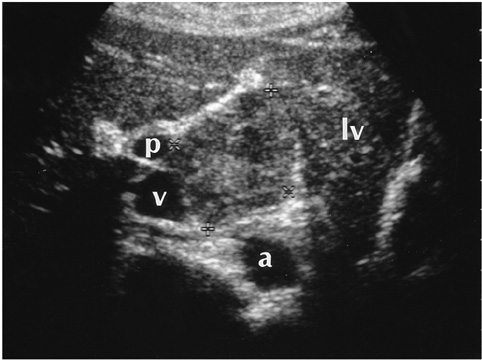
Fig. 7 A 34-year-old woman with an exophytic hepatic hemangioma in the caudate lobe. Transverse US shows a large square-shaped mass surrounded by the left lobe of the liver (lv), aorta (a), inferior vena cava (v), and right portal vein (p). The lesion shows heterogeneous echogenicity and has a multiple internal hypoechoic portion.
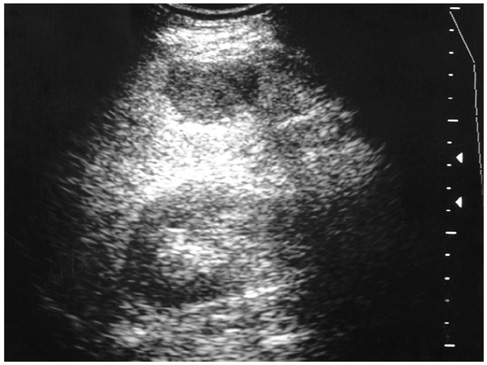
Fig. 8 A 51-year-old man with a hepatic hemangioma in the right lobe. Transverse US shows increased liver echogenicity, suggestive of diffuse fatty infiltration, and an atypical echo-poor hemangioma. There is no discernable echogenic border.
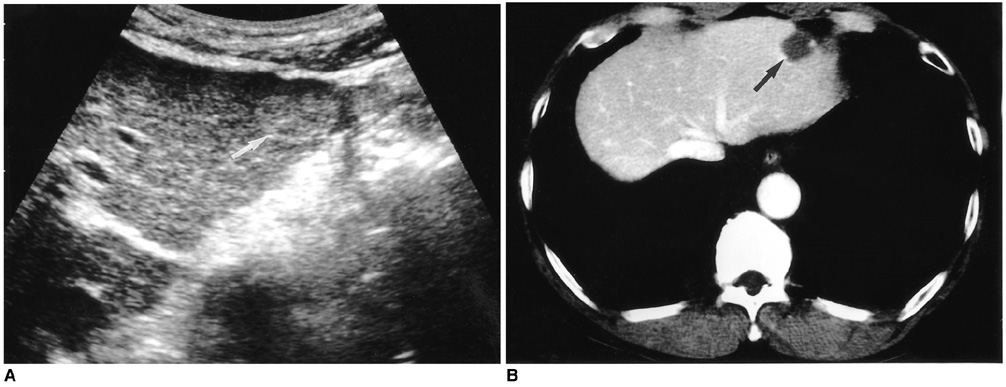
Fig. 9 A 51-year-old man with a hepatic hemangioma in the left lobe. A. Transverse US shows a slightly hyperchoic mass with a well-defined margin (arrow). B. Enhanced CT of the liver during the portal venous phase shows bright dot-like enhancement (arrow) in the periphery of the lesion.
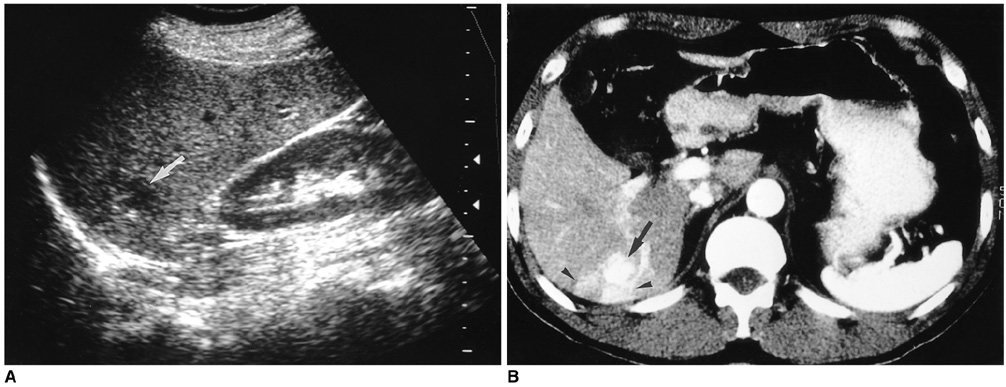
Fig. 10 A 55-year-old woman with a hepatic hemangioma in the right lobe. A. Sagittal US shows a well-defined hypoechoic mass (arrow). B. Enhanced CT scan of the liver obtained during the hepatic arterial phase shows diffuse rapid enhancement of the tumor (arrow) with peritumoral wedge-shaped parenchymal enhancement (arrowheads), suggesting associated arterioportal shunt.

Fig. 11 A 54-year-old woman with a hepatic hemangioma in the right lobe. A. Unenhanced power Doppler US shows a hypoechoic mass with an echogenic border (arrows). The lesion shows minimal power Doppler signal in its periphery (open arrow) and optimized parameters (a pulse repetition frequency of 1,000 Hz and a medium wall filter). B, C. Dynamic contrast-enhanced power Doppler US scans obtained 30 seconds (B) and 90 seconds (C) after the initiation of contrast injection show dot-like enhancement (small arrows) at the periphery of the mass. However, unlike centripetal fill-in enhancement, characteristic of hemangioma, the enhanced area revealed by power Doppler US is smaller 90 seconds after enhancement than at 30. Even with the use of microbubble agents, power Doppler US is, therefore, due to its insensitivity to slow flow, able to characterize hepatic hemangiomas to only a limited extent.
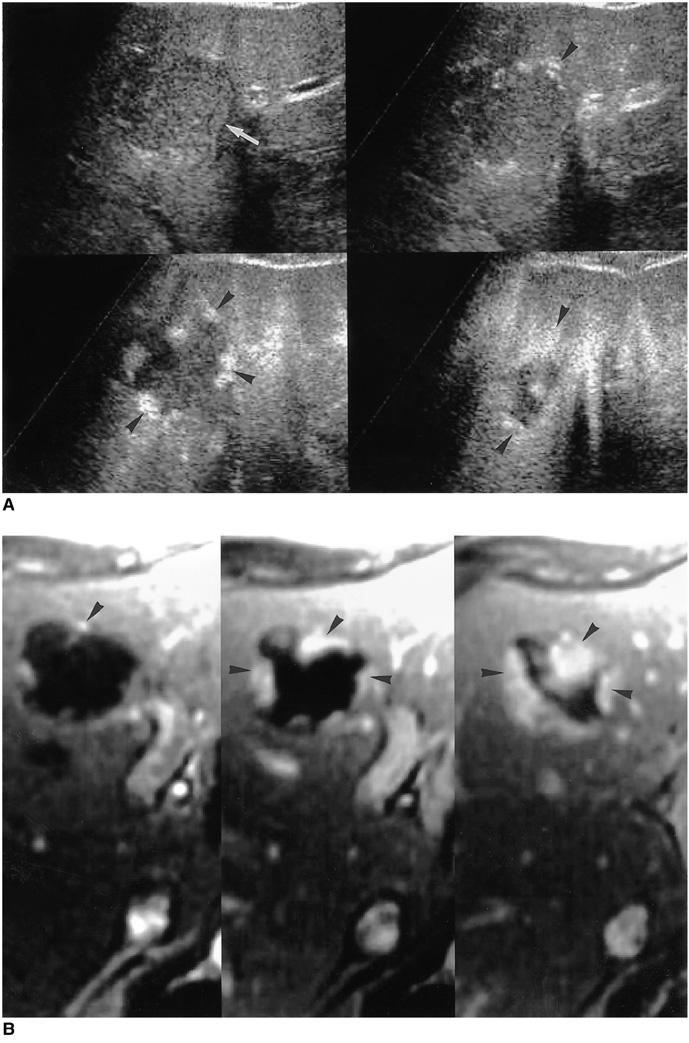
Fig. 12 A 52-year-old man with two hepatic hemangiomas in the left lobe. A. Pulse-inversion harmonic US scans obtained prior to contrast injection show a hypoechogenic hepatic hemangioma (arrow) in the medial segment of the left lobe. Serial contrast-enhanced US scans obtained 14, 62, and 139 seconds after injection show peripheral globular enhancement with progressive centripetal fill-in (arrowheads). B. Serial dynamic contrast-enhanced T1-weighted MR images obtained immediately, 60, and 180 seconds after the administration of gadolinium-DTPA depict early peripheral nodular and globular enhancement with progressive centripetal fill-in (arrowheads), characteristic of hepatic hemangiomas. The enhanced areas seen on MR images are nearly identical to those seen on serial contrast-enhanced pulse-inversion harmonic US scans.
Reference
-
1. Mirk P, Rubaltelli L, Bazzocchi M, et al. Ultrasonographic patterns in hepatic hemangiomas. J Clin Ultrasound. 1982. 10:373–378.2. Taboury J, Porcel A, Tubiana JM, Monnier JP. Cavernous hemangiomas of the liver studied by ultrasound: enhancement posterior to a hyperechoic mass as a sign of hypervascularity. Radiology. 1983. 149:781–785.3. Friedman AC, Frazier S, Hendrix TM, Ros PR. Friedman AC, Dachman AH, editors. Focal disease. Radiology of the liver, biliary tract and pancreas. 1994. St. Louis: Mosby;169–327.4. Gibney RG, Hendin AP, Cooperberg PL. Sonographically detected hepatic hemangiomas: absence of change over time. AJR. 1987. 149:953–957.5. Moody AR, Wilson SR. Atypical hepatic hemangioma: a suggestive sonographic morphology. Radiology. 1993. 188:413–417.6. Marsh JI, Gibney RG, Li DKB. Hepatic hemangioma in the presence of fatty infiltration: an atypical sonographic appearance. Gastrointest Radiol. 1989. 14:262–264.7. Chang J, Han K. Relation of internal echo patterns and hemodynamics by incremental dynamic CT in hepatic cavernous hemangioma. J Korean Radiol Soc. 1993. 29:775–782.8. Yu JS, Kim MJ, Kim KW, et al. Hepatic cavernous hemangioma: sonographic patterns and speed of contrast enhancement on multiphase dynamic MR imaging. AJR. 1998. 171:1021–1025.9. Kim TK, Choi BI, Han JK, Hong HS, Park SH, Moon SK. Hepatic tumors: contrast agent enhancement patterns with pulse-inversion harmonic US. Radiology. 2000. 216:411–417.10. Choi BI, Kim TK, Han JK, Chung JW, Park JH, Han MC. Power versus conventional color Doppler sonography: comparison in the depiction of vasculature in liver tumors. Radiology. 1996. 200:55–58.11. Young LK, Yang WT, Chan KW, Metreweli C. Hepatic hemangiomas: quantitative color power US angiography-facts and fallacies. Radiology. 1998. 207:51–57.12. Kim TK, Han JK, Kim AY, Park SJ, Choi BI. Signal from hepatic hemangiomas on power Doppler US: real or artefactual? Ultrasound in Med and Biol. 1999. 25:1055–1061.13. Lopez-Ben R, Robbin ML, Weber TM, Smith JK, Needleman L, Berland LL. Doppler sonographic enhancement of hepatic hemangiomas and hepatocellular carcinomas after perflenapent emulsion: preliminary study. J Ultrasound Med. 1999. 18:109–116.14. Kim AY, Choi BI, Kim TK, et al. Hepatocellular carcinoma: power Doppler US with a contrast agent-preliminary results. Radiology. 1998. 209:135–140.15. Kim TK, Han JK, Kim AY, Choi BI. Limitations of characterization of hepatic hemangiomas using a sonographic contrast agent (Levovist) and power Doppler ultrasonography. J Ultrasound Med. 1999. 18:737–743.
- Full Text Links
-
- Actions
-
Cited
- CITED
-
- Close
- Share
-
- Similar articles
-
- Diagnosis of Acute Appendicitis: Comparison between Gray Scale, Color Doppler and Power Doppler US
- Power Versus Color Doppler Sonography of Focal Hepatic Lesions
- The Use of Contrast-Enhanced Color Doppler Ultrasound in the Differentiation of Retinal Detachment from Vitreous Membrane
- Hepatic Hemangioma with Hypoechoic Halo Accompanied by Arterioportal Shunt
- Radiofrequency Ablation of Liver Cancer: Early Evaluation of Therapeutic Response with Contrast-Enhanced Ultrasonography
