Glaucoma Progression Detection by Retinal Nerve Fiber Layer Measurement Using Scanning Laser Polarimetry: Event and Trend Analysis
- Affiliations
-
- 1Department of Ophthalmology, Asan Medical Center, University of Ulsan College of Medicine, Seoul, Korea. sungeye@gmail.com
- 2Department of Clinical Epidemiology and Biostatistics, Asan Medical Center, University of Ulsan College of Medicine, Seoul, Korea.
- KMID: 1376122
- DOI: http://doi.org/10.3341/kjo.2012.26.3.174
Abstract
- PURPOSE
To evaluate the use of scanning laser polarimetry (SLP, GDx VCC) to measure the retinal nerve fiber layer (RNFL) thickness in order to evaluate the progression of glaucoma.
METHODS
Test-retest measurement variability was determined in 47 glaucomatous eyes. One eye each from 152 glaucomatous patients with at least 4 years of follow-up was enrolled. Visual field (VF) loss progression was determined by both event analysis (EA, Humphrey guided progression analysis) and trend analysis (TA, linear regression analysis of the visual field index). SLP progression was defined as a reduction of RNFL exceeding the predetermined repeatability coefficient in three consecutive exams, as compared to the baseline measure (EA). The slope of RNFL thickness change over time was determined by linear regression analysis (TA).
RESULTS
Twenty-two eyes (14.5%) progressed according to the VF EA, 16 (10.5%) by VF TA, 37 (24.3%) by SLP EA and 19 (12.5%) by SLP TA. Agreement between VF and SLP progression was poor in both EA and TA (VF EA vs. SLP EA, k = 0.110; VF TA vs. SLP TA, k = 0.129). The mean (+/-standard deviation) progression rate of RNFL thickness as measured by SLP TA did not significantly differ between VF EA progressors and non-progressors (-0.224 +/- 0.148 microm/yr vs. -0.218 +/- 0.151 microm/yr, p = 0.874). SLP TA and EA showed similar levels of sensitivity when VF progression was considered as the reference standard.
CONCLUSIONS
RNFL thickness as measurement by SLP was shown to be capable of detecting glaucoma progression. Both EA and TA of SLP showed poor agreement with VF outcomes in detecting glaucoma progression.
MeSH Terms
Figure
-
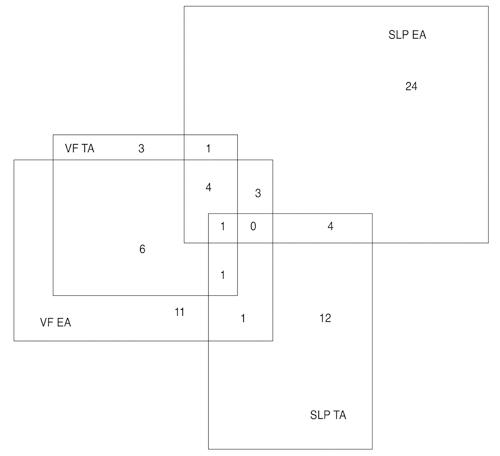
Fig. 1 Venn diagram showing agreement of glaucoma progression detection among the four tested methods (visual field [VF] event analysis [EA], VF trend analysis [TA], scanning laser polarimetry [SLP] EA, and SLP TA).

Fig. 2 Clinical example showing visual field (VF) data and scanning laser polarimetry (SLP) retinal nerve fiber layer (RNFL) information in a 54-year old woman with glaucomatous eyes. This patient was a 54-year old woman with open- angle glaucoma and had an inferior VF defect in the left eye at baseline (A). The SLP image showed a thinning of the RNFL where the average RNFL thickness was 40.71 µm (B). After 2 years of follow-up, the average RNFL thickness was significantly reduced to 30.7 µm, D), which corresponded with VF progression (C).
Reference
-
1. Quigley HA, Katz J, Derick RJ, et al. An evaluation of optic disc and nerve fiber layer examinations in monitoring progression of early glaucoma damage. Ophthalmology. 1992. 99:19–28.2. Sommer A, Katz J, Quigley HA, et al. Clinically detectable nerve fiber atrophy precedes the onset of glaucomatous field loss. Arch Ophthalmol. 1991. 109:77–83.3. Zeyen TG, Caprioli J. Progression of disc and field damage in early glaucoma. Arch Ophthalmol. 1993. 111:62–65.4. Chauhan BC, McCormick TA, Nicolela MT, LeBlanc RP. Optic disc and visual field changes in a prospective longitudinal study of patients with glaucoma: comparison of scanning laser tomography with conventional perimetry and optic disc photography. Arch Ophthalmol. 2001. 119:1492–1499.5. Fayers T, Strouthidis NG, Garway-Heath DF. Monitoring glaucomatous progression using a novel Heidelberg retina tomograph event analysis. Ophthalmology. 2007. 114:1973–1980.6. Medeiros FA, Zangwill LM, Alencar LM, et al. Detection of glaucoma progression with stratus OCT retinal nerve fiber layer, optic nerve head, and macular thickness measurements. Invest Ophthalmol Vis Sci. 2009. 50:5741–5748.7. Leung CK, Cheung CY, Weinreb RN, et al. Evaluation of retinal nerve fiber layer progression in glaucoma: a study on optical coherence tomography guided progression analysis. Invest Ophthalmol Vis Sci. 2010. 51:217–222.8. Lee EJ, Kim TW, Park KH, et al. Ability of Stratus OCT to detect progressive retinal nerve fiber layer atrophy in glaucoma. Invest Ophthalmol Vis Sci. 2009. 50:662–668.9. Sehi M, Greenfield DS. Assessment of retinal nerve fiber layer using optical coherence tomography and scanning laser polarimetry in progressive glaucomatous optic neuropathy. Am J Ophthalmol. 2006. 142:1056–1059.10. Wollstein G, Schuman JS, Price LL, et al. Optical coherence tomography longitudinal evaluation of retinal nerve fiber layer thickness in glaucoma. Arch Ophthalmol. 2005. 123:464–470.11. Medeiros FA, Alencar LM, Zangwill LM, et al. The Relationship between intraocular pressure and progressive retinal nerve fiber layer loss in glaucoma. Ophthalmology. 2009. 116:1125–1133.e1-3.12. Medeiros FA, Alencar LM, Zangwill LM, et al. Detection of progressive retinal nerve fiber layer loss in glaucoma using scanning laser polarimetry with variable corneal compensation. Invest Ophthalmol Vis Sci. 2009. 50:1675–1681.13. Alencar LM, Zangwill LM, Weinreb RN, et al. Agreement for detecting glaucoma progression with the GDx guided progression analysis, automated perimetry, and optic disc photography. Ophthalmology. 2010. 117:462–470.14. Grewal DS, Sehi M, Greenfield DS. Detecting glaucomatous progression using GDx with variable and enhanced corneal compensation using guided progression analysis. Br J Ophthalmol. 2011. 95:502–508.15. Lleo-Perez A, Ortuno-Soto A, Rahhal MS, et al. Intraobserver reproducibility of retinal nerve fiber layer measurements using scanning laser polarimetry and optical coherence tomography in normal and ocular hypertensive subjects. Eur J Ophthalmol. 2004. 14:523–530.16. Iacono P, Da Pozzo S, Fuser M, et al. Intersession reproducibility of retinal nerve fiber layer thickness measurements by GDx-VCC in healthy and glaucomatous eyes. Ophthalmologica. 2006. 220:266–271.17. Medeiros FA, Doshi R, Zangwill LM, et al. Long-term variability of GDx VCC retinal nerve fiber layer thickness measurements. J Glaucoma. 2007. 16:277–281.18. Leung CK, Cheung CY, Lin D, et al. Longitudinal variability of optic disc and retinal nerve fiber layer measurements. Invest Ophthalmol Vis Sci. 2008. 49:4886–4892.19. Mai TA, Lemij HG. Longitudinal measurement variability of corneal birefringence and retinal nerve fiber layer thickness in scanning laser polarimetry with variable corneal compensation. Arch Ophthalmol. 2008. 126:1359–1364.20. Kook MS, Cho HS, Seong M, Choi J. Scanning laser polarimetry using variable corneal compensation in the detection of glaucoma with localized visual field defects. Ophthalmology. 2005. 112:1970–1978.21. Choi J, Cho HS, Lee CH, Kook MS. Scanning laser polarimetry with variable corneal compensation in the area of apparently normal hemifield in eyes with normal-tension glaucoma. Ophthalmology. 2006. 113:1954–1960.22. Asaoka R, Strouthidis NG, Kappou V, et al. HRT-3 Moorfields reference plane: effect on rim area repeatability and identification of progression. Br J Ophthalmol. 2009. 93:1510–1513.23. Leske MC, Heijl A, Hussein M, et al. Factors for glaucoma progression and the effect of treatment: the early manifest glaucoma trial. Arch Ophthalmol. 2003. 121:48–56.
- Full Text Links
-
- Actions
-
Cited
- CITED
-
- Close
- Share
-
- Similar articles
-
- Biometry of Retinal Nerve Fiber Layer Thickness by NFA
- The Relationship between the Duration of IOP Elevation during LASIK and Nerve Fiber Layer Thickness Measured by GDx(R)
- Influence of Diabetes Mellitus on the Retinal Ne rve Fiber Layer Thickness Measurement by Nerve Fiber Analyzer
- Differentiating Patients with Glaucoma from Glaucoma Suspects by Retinal Nerve Fiber Layer Assessment Using Nerve Fiber Analyzer
- Influence of Lens Opacity on Nerve Fiber Layer Analysis in Glaucomatous and Normal Eyes
