Comparison of Usual Interstitial Pneumonia and Nonspecific Interstitial Pneumonia: Quantification of Disease Severity and Discrimination between Two Diseases on HRCT Using a Texture-Based Automated System
- Affiliations
-
- 1Department of Radiology and Research Institute of Radiology, University of Ulsan College of Medicine, Asan Medical Center, Seoul 138-736, Korea. joonbeom.seo@gmail.com
- 2Department of Radiology, East-West Neo Medical Center of Kyung Hee University, Seoul 134-727, Korea.
- 3Department of Digital Media, The Catholic University of Korea, Seoul 150-101, Korea.
- 4Division of Pulmonary and Critical Care Medicine, Department of Internal Medicine, Asan Medical Center, Seoul 138-736, Korea.
- KMID: 1122327
- DOI: http://doi.org/10.3348/kjr.2011.12.3.297
Abstract
OBJECTIVE
To evaluate the usefulness of an automated system for quantification and discrimination of usual interstitial pneumonia (UIP) and nonspecific interstitial pneumonia (NSIP).
MATERIALS AND METHODS
An automated system to quantify six regional high-resolution CT (HRCT) patterns: normal, NL; ground-glass opacity, GGO; reticular opacity, RO; honeycombing, HC; emphysema, EMPH; and consolidation, CONS, was developed using texture and shape features. Fifty-four patients with pathologically proven UIP (n = 26) and pathologically proven NSIP (n = 28) were included as part of this study. Inter-observer agreement in measuring the extent of each HRCT pattern between the system and two thoracic radiologists were assessed in 26 randomly selected subsets using an interclass correlation coefficient (ICC). A linear regression analysis was used to assess the contribution of each disease pattern to the pulmonary function test parameters. The discriminating capacity of the system between UIP and NSIP was evaluated using a binomial logistic regression.
RESULTS
The overall ICC showed acceptable agreement among the system and the two radiologists (r = 0.895 for the abnormal lung volume fraction, 0.706 for the fibrosis fraction, 0.895 for NL, 0.625 for GGO, 0.626 for RO, 0.893 for HC, 0.800 for EMPH, and 0.430 for CONS). The volumes of NL, GGO, RO, and EMPH contribute to forced expiratory volume during one second (FEV1) (r = 0.72, beta values, 0.84, 0.34, 0.34 and 0.24, respectively) and forced vital capacity (FVC) (r = 0.76, beta values, 0.82, 0.28, 0.21 and 0.34, respectively). For diffusing capacity (DLco), the volumes of NL and HC were independent contributors in opposite directions (r = 0.65, beta values, 0.64, -0.21, respectively). The automated system can help discriminate between UIP and NSIP with an accuracy of 82%.
CONCLUSION
The automated quantification system of regional HRCT patterns can be useful in the assessment of disease severity and may provide reliable agreement with the radiologists' results. In addition, this system may be useful in differentiating between UIP and NSIP.
Keyword
MeSH Terms
Figure
-
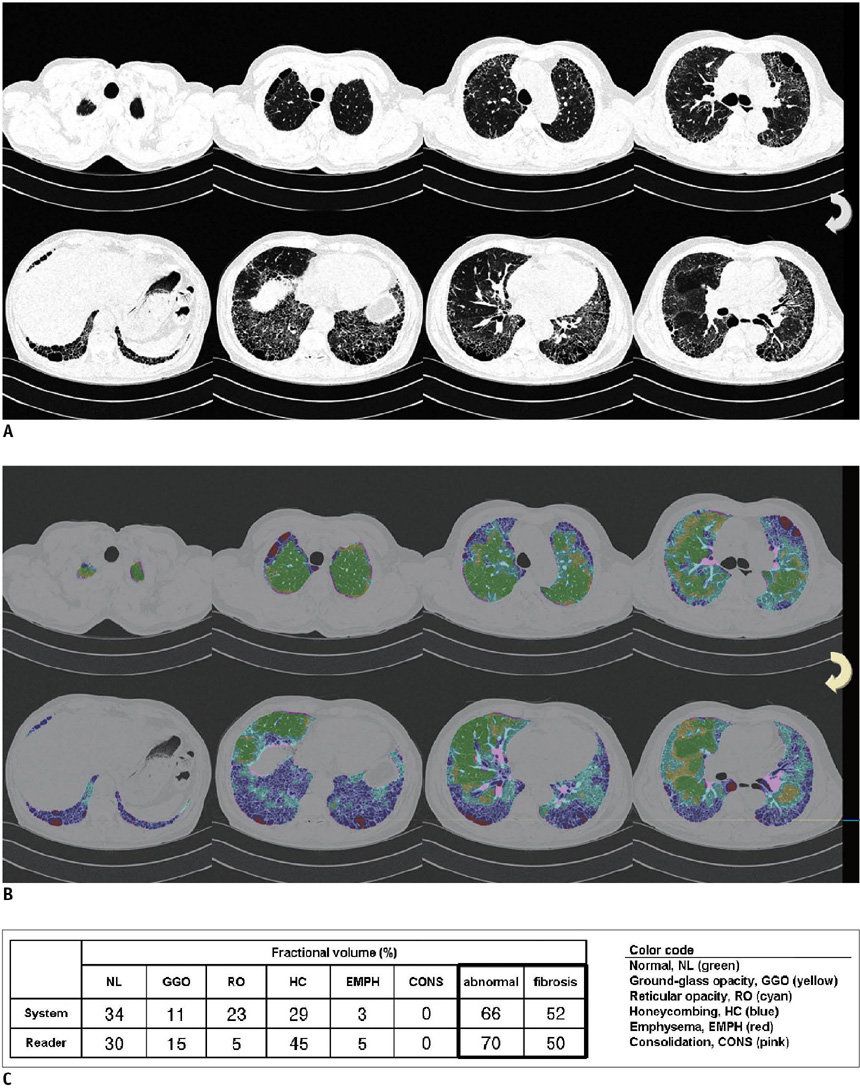
Fig. 1 50-year-old man who had pathologically proven usual interstitial pneumonia. A. CT images predominantly showed basal and peripheral honeycombing and reticular opacities. Reader 1 gave five-point rating scale as 4, thereby suggesting probable usual interstitial pneumonia. And reader 2 gave five-point rating scale as 3, thereby suggesting possible usual interstitial pneumonia. B. Automated system interpreted approximately one-half of lung volume as honeycombing and reticular opacities. Value of prob (event)* was 0.61, thus classifying CT images as usual interstitial pneumonia. Pathology also indicated usual interstitial pneumonia. C. System determined 66% of whole lung as abnormal, whereas radiologist regarded 70% as abnormal lung. Extent of fibrosis was 52% according to system, and 50% according to radiologist. Fractional volumes of six patterns were also very similar. *Logistic prediction equation was: ln(prob(event)/[1-prob(event)]) = 0.404 HC + 0.178 GGO + 0.181 RO - 0.010 HC × RO - 0.006 GGO × RO - 0.064 CONS × GGO - 4.347 where, prob(event) < 0.50 was nonspecific interstitial pneumonia and prob(event) ≥ 0.50 was usual interstitial pneumonia.

Fig. 2 55-year-old woman who had pathologically proven nonspecific interstitial pneumonia. A. CT images showed basal ground glass and reticular opacities with no areas of honeycombing. Reader 1 gave five-point rating scale as 2, thus suggesting probable nonspecific interstitial pneumonia. Reader 2 gave five-point rating scale as 1, thereby suggesting definite nonspecific interstitial pneumonia. B. System interpreted approximately one-half of lung volume as ground glass and reticular opacities. System also detected some areas of consolidation and honeycombing. Value of prob (event)* was < 0.01, thus classifying CT images as nonspecific interstitial pneumonia. Pathology also indicated nonspecific interstitial pneumonia. C. System determined 58% of whole lung as abnormal, whereas radiologist regarded 50% as abnormal lung. Extent of fibrosis was 26% according to system, and 20% according to radiologist. *Logistic prediction equation was: ln(prob(event)/[1-prob(event)]) = 0.404 HC + 0.178 GGO + 0.181 RO - 0.010 HC × RO - 0.006 GGO × RO - 0.064 CONS × GGO - 4.347 where, prob(event) < 0.50 was nonspecific interstitial pneumonia and prob(event) ≥ 0.50 was usual interstitial pneumonia.
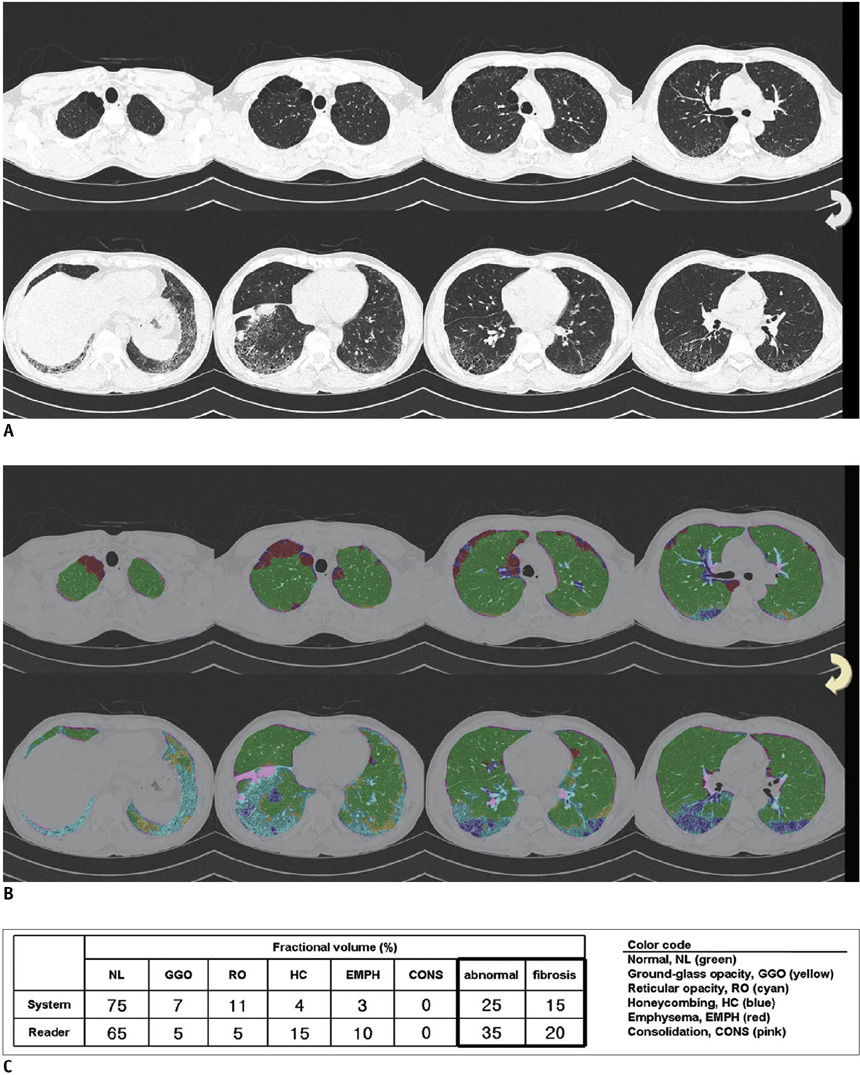
Fig. 3 47-year-old man who had pathologically proven nonspecific interstitial pneumonia. A. CT images predominantly showed basal and peripheral reticular opacities. There were also some areas of honeycombing and subpleural emphysema. Two readers gave five-point rating scale as 3, thus suggesting possible usual interstitial pneumonia. B. System interpreted more lung volume as ground glass and reticular opacities than did human reader. Honeycombing was less prominent in system's quantification. Value of prob (event)* was 0.35, thus classifying CT images as nonspecific interstitial pneumonia. Pathology also indicated nonspecific interstitial pneumonia. C. System determined that 25% of whole lung as abnormal, whereas radiologist regarded 35% as abnormal lung. Extent of fibrosis was 15% according to system, and 20% according to radiologist. *Logistic prediction equation was: ln(prob(event)/[1-prob(event)]) = 0.404 HC + 0.178 GGO + 0.181 RO - 0.010 HC × RO - 0.006 GGO × RO - 0.064 CONS × GGO - 4.347 where, prob(event) < 0.50 was nonspecific interstitial pneumonia and prob(event) ≥ 0.50 was usual interstitial pneumonia.
Cited by 1 articles
-
An Engineering View on Megatrends in Radiology: Digitization to Quantitative Tools of Medicine
Namkug Kim, Jaesoon Choi, Jaeyoun Yi, Seungwook Choi, Seyoun Park, Yongjun Chang, Joon Beom Seo
Korean J Radiol. 2013;14(2):139-153. doi: 10.3348/kjr.2013.14.2.139.
Reference
-
1. Muller NL. Clinical value of high-resolution CT in chronic diffuse lung disease. AJR Am J Roentgenol. 1991. 157:1163–1170.2. Nishimura K, Izumi T, Kitaichi M, Nagai S, Itoh H. The diagnostic accuracy of high-resolution computed tomography in diffuse infiltrative lung diseases. Chest. 1993. 104:1149–1155.3. Scatarige JC, Diette GB, Haponik EF, Merriman B, Fishman EK. Utility of high-resolution CT for management of diffuse lung disease: results of a survey of U.S. pulmonary physicians. Acad Radiol. 2003. 10:167–175.4. Gay SE, Kazerooni EA, Toews GB, Lynch JP 3rd, Gross BH, Cascade PN, et al. Idiopathic pulmonary fibrosis: predicting response to therapy and survival. Am J Respir Crit Care Med. 1998. 157:1063–1072.5. Park YS, Seo JB, Kim N, Chae EJ, Oh YM, Lee SD, et al. Texture-based quantification of pulmonary emphysema on high-resolution computed tomography: comparison with density-based quantification and correlation with pulmonary function test. Invest Radiol. 2008. 43:395–402.6. Padley SP, Hansell DM, Flower CD, Jennings P. Comparative accuracy of high resolution computed tomography and chest radiography in the diagnosis of chronic diffuse infiltrative lung disease. Clin Radiol. 1991. 44:222–226.7. Collins CD, Wells AU, Hansell DM, Morgan RA, MacSweeney JE, du Bois RM, et al. Observer variation in pattern type and extent of disease in fibrosing alveolitis on thin section computed tomography and chest radiography. Clin Radiol. 1994. 49:236–240.8. Remy-Jardin M, Remy J, Wallaert B, Bataille D, Hatron PY. Pulmonary involvement in progressive systemic sclerosis: sequential evaluation with CT, pulmonary function tests, and bronchoalveolar lavage. Radiology. 1993. 188:499–506.9. Copley SJ, Lee YC, Hansell DM, Sivakumaran P, Rubens MB, Newman Taylor AJ, et al. Asbestos-induced and smoking-related disease: apportioning pulmonary function deficit by using thin-section CT. Radiology. 2007. 242:258–266.10. Best AC, Lynch AM, Bozic CM, Miller D, Grunwald GK, Lynch DA. Quantitative CT indexes in idiopathic pulmonary fibrosis: relationship with physiologic impairment. Radiology. 2003. 228:407–414.11. Best AC, Meng J, Lynch AM, Bozic CM, Miller D, Grunwald GK, et al. Idiopathic pulmonary fibrosis: physiologic tests, quantitative CT indexes, and CT visual scores as predictors of mortality. Radiology. 2008. 246:935–940.12. Castellano G, Bonilha L, Li LM, Cendes F. Texture analysis of medical images. Clin Radiol. 2004. 59:1061–1069.13. Delorme S, Keller-Reichenbecher MA, Zuna I, Schlegel W, Van Kaick G. Usual interstitial pneumonia. Quantitative assessment of high-resolution computed tomography findings by computer-assisted texture-based image analysis. Invest Radiol. 1997. 32:566–574.14. Rodriguez LH, Vargas PF, Raff U, Lynch DA, Rojas GM, Moxley DM, et al. Automated discrimination and quantification of idiopathic pulmonary fibrosis from normal lung parenchyma using generalized fractal dimensions in high-resolution computed tomography images. Acad Radiol. 1995. 2:10–18.15. Zavaletta VA, Bartholmai BJ, Robb RA. High resolution multidetector CT-aided tissue analysis and quantification of lung fibrosis. Acad Radiol. 2007. 14:772–787.16. Park SO, Seo JB, Kim N, Park SH, Lee YK, Park BW, et al. Feasibility of automated quantification of regional disease patterns depicted on high-resolution computed tomography in patients with various diffuse lung diseases. Korean J Radiol. 2009. 10:455–463.17. Uppaluri R, Hoffman EA, Sonka M, Hunninghake GW, McLennan G. Interstitial lung disease: a quantitative study using the adaptive multiple feature method. Am J Respir Crit Care Med. 1999. 159:519–525.18. Xu Y, van Beek EJ, Hwanjo Y, Guo J, McLennan G, Hoffman EA. Computer-aided classification of interstitial lung diseases via MDCT: 3D adaptive multiple feature method (3D AMFM). Acad Radiol. 2006. 13:969–978.19. Kim N, Seo JB, Lee Y, Lee JG, Kim SS, Kang SH. Development of an automatic classification system for differentiation of obstructive lung disease using HRCT. J Digit Imaging. 2009. 22:136–148.20. Lee Y, Seo JB, Lee JG, Kim SS, Kim N, Kang SH. Performance testing of several classifiers for differentiating obstructive lung diseases based on texture analysis at high-resolution computerized tomography (HRCT). Comput Methods Programs Biomed. 2009. 93:206–215.21. American Thoracic Society. Standardization of Spirometry, 1994 Update. Am J Respir Crit Care Med. 1995. 152:1107–1136.22. American Thoracic Society. Single-breath carbon monoxide diffusing capacity (transfer factor). Recommendations for a standard technique--1995 update. Am J Respir Crit Care Med. 1995. 152:2185–2198.23. Mueller-Mang C, Grosse C, Schmid K, Stiebellehner L, Bankier AA. What every radiologist should know about idiopathic interstitial pneumonias. Radiographics. 2007. 27:595–615.24. Do KH, Lee JS, Colby TV, Kitaichi M, Kim DS. Nonspecific interstitial pneumonia versus usual interstitial pneumonia: differences in the density histogram of high-resolution CT. J Comput Assist Tomogr. 2005. 29:544–548.25. Akira M, Sakatani M, Ueda E. Idiopathic pulmonary fibrosis: progression of honeycombing at thin-section CT. Radiology. 1993. 189:687–691.26. Jeong YJ, Lee KS, Muller NL, Chung MP, Chung MJ, Han J, et al. Usual interstitial pneumonia and non-specific interstitial pneumonia: serial thin-section CT findings correlated with pulmonary function. Korean J Radiol. 2005. 6:143–152.27. American Thoracic Society/European Respiratory Society International Multidisciplinary Consensus Classification of the Idiopathic Interstitial Pneumonias. This joint statement of the American Thoracic Society (ATS), and the European Respiratory Society (ERS) was adopted by the ATS board of directors, June 2001 and by the ERS Executive Committee, June 2001. Am J Respir Crit Care Med. 2002. 165:277–304.28. King TE Jr, Schwarz MI, Brown K, Tooze JA, Colby TV, Waldron JA Jr, et al. Idiopathic pulmonary fibrosis: relationship between histopathologic features and mortality. Am J Respir Crit Care Med. 2001. 164:1025–1032.29. Travis WD, Matsui K, Moss J, Ferrans VJ. Idiopathic nonspecific interstitial pneumonia: prognostic significance of cellular and fibrosing patterns: survival comparison with usual interstitial pneumonia and desquamative interstitial pneumonia. Am J Surg Pathol. 2000. 24:19–33.30. Latsi PI, du Bois RM, Nicholson AG, Colby TV, Bisirtzoglou D, Nikolakopoulou A, et al. Fibrotic idiopathic interstitial pneumonia: the prognostic value of longitudinal functional trends. Am J Respir Crit Care Med. 2003. 168:531–537.31. Riha RL, Duhig EE, Clarke BE, Steele RH, Slaughter RE, Zimmerman PV. Survival of patients with biopsy-proven usual interstitial pneumonia and nonspecific interstitial pneumonia. Eur Respir J. 2002. 19:1114–1118.
- Full Text Links
-
- Actions
-
Cited
- CITED
-
- Close
- Share
-
- Similar articles
-
- Idiopathic Interstitial Pneumonias: Radiologic Findings
- A Case of Nonspecific Interstitial Pneumonia with Clinical Course of Rapid Aggravation
- Idiopathic interstitial pneumonias: clinical findings, pathogenesis, pathology and radiologic findings
- Clinical Year in Review of Interstitial Lung Diseases: Focused on Idiopathic Interstitial Pneumonia
- A Case of Nonspecific Interstitial Pneumonia Associated with Systemic Lupus Erythematosus
