Hypereosinophilic Syndrome : CT Findings in Patients with Hepatic Lobar or Segmental Involvement
- Affiliations
-
- 1Department of Radiology, Samsung Medical Center, Sungkyunkwan University School of Medicine, Seoul, Korea. jhlim@smc.samsung.co.kr
- KMID: 966480
- DOI: http://doi.org/10.3348/kjr.2000.1.2.98
Abstract
OBJECTIVE
The purpose of this study was to describe the CT findings of hepatic hypereosinophilic syndrome in which hepatic lobes or segments were involved. MATERIALS AND METHODS: Seven patients with hypereosinophilic syndrome with hepatic lobar or segmental involvement were included in our study. In all seven, diagnosis was based on liver biopsy and the results of corticosteroid treatment. CT findings were retrospectively reviewed by three radiologists, who reached a consensus. Biopsy specimens were examined, with special reference to portal and periportal inflammation. RESULTS: CT demonstrated well-defined, homogeneous or heterogeneous low attenuation with a straight margin limited to a hepatic lobe (n = 2), segments (n = 3), or subsegments (n = 2), particularly during the portal phase. Where there was subsegmental involvement, lesions were multiple, ovoid or wedge-shaped, and showed low attenuation. In two patients with lobar or segmental involvement, segmental portal vein narrowing was observed. Histopathologic examination dis-closed eosinophilic infiltration in the periportal area, sinusoids and central veins, as well as portal phlebitis. CONCLUSION: Hypereosinophilic syndrome may involve the presence of hepatic lobar, segmental, or subsegmental low-attenuated lesions, as seen on CT images. Their presence may be related to damage of the liver parenchyma and to portal phlebitis.
Keyword
MeSH Terms
Figure
-
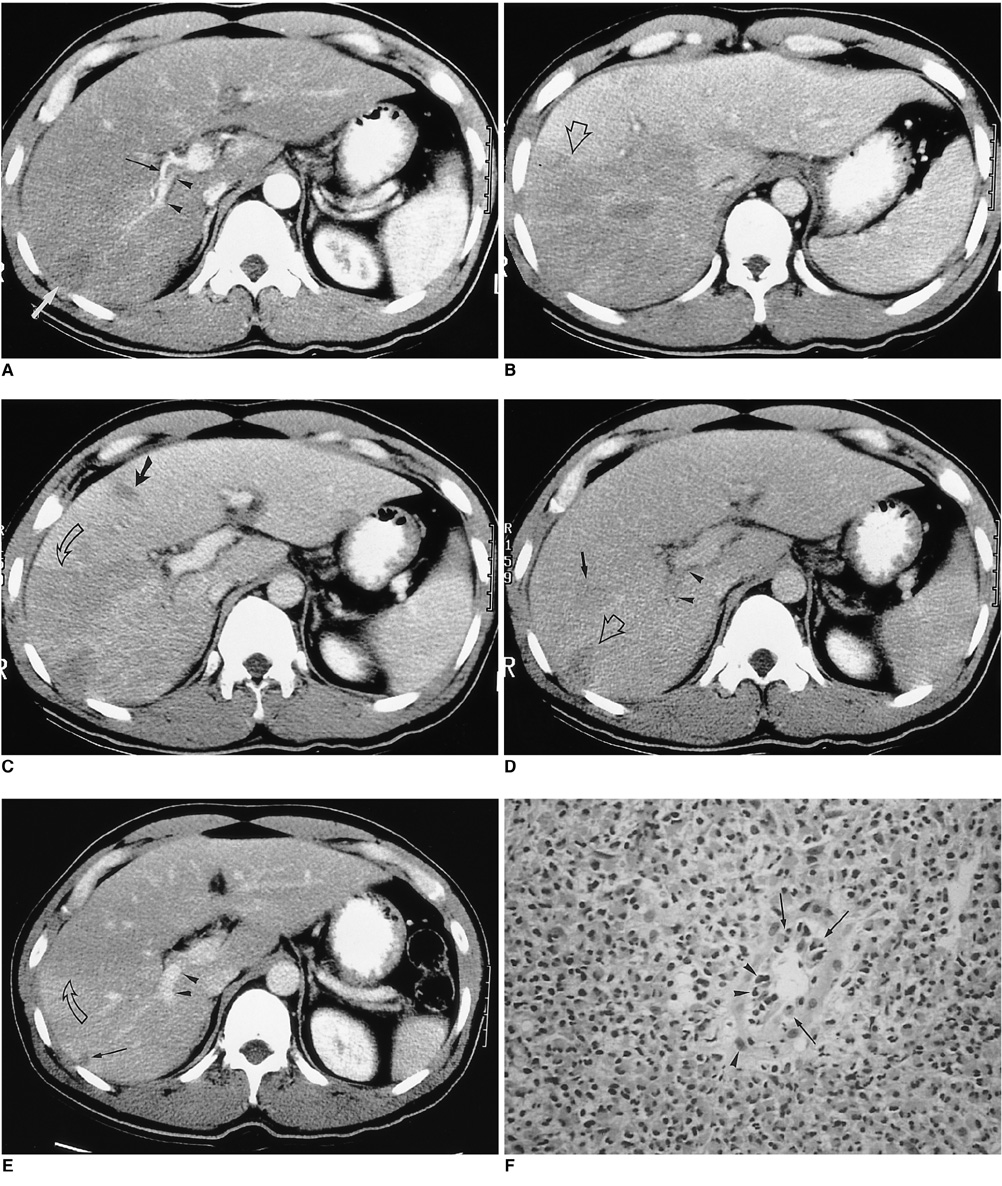
Fig. 1 A 37-year-old man (case 1) presented with right flank pain. Peripheral white blood cell count was 45,100/mm3, with 94% eosinophilia. A. Arterial phase CT scan shows a small, wedge-shaped low-attenuated lesion in the peripheral part of the posterior segment of the right hepatic lobe (white arrow). Attenuation of the right hepatic lobe is slightly lower than that of the left lobe. The diameter of the posterior branch of the portal vein (arrowheads) is less than 50% of normal. Note the right hepatic artery (black arrow). The liver is moderately enlarged. B. CT scan at 3.5 cm cephalad to A in the portal venous phase shows low attenuation at the right hepatic lobe, with slight heterogeneity. Note the sharp border between the lesion and normal parenchyma (open arrow). C. CT scan at the same level as A during the portal phase shows heterogeneous low attenuation in the right hepatic lobe, with a sharp straight border (open arrow). A small subsegmental low attenuated lesion was also seen in the medial segment of the left hepatic lobe (arrow). Note abrupt narrowing of the posterior branch of the right portal vein. D. CT scan during the equilibrium phase shows a small, wedge-shaped low attenuated lesion in the right hepatic lobe (the same area as in A, open arrow) and another area of faint low attenuation (arrow). Note the significantly narrow posterior branch of the right portal vein (arrowheads). E. Follow-up CT scan one month after corticosteroid treatment shows a subsegmental, faint zone of low-attenuation zone (open arrow) and a tiny subcapsular low attenuated lesion (arrow). Note the presence of normal portal venous branches in the posterior segment of the right hepatic lobe (arrowheads). F. Photomicrograph of needle biopsy specimen reveals severe infiltration of the periportal area by eosinophils and mononuclear cells, resulting in widening of this area and destruction of the hepatic cell cord architecture. Note infiltration of the wall of the portal venule by eosinophils (arrows) and mononuclear cells (arrowheads), resulting in thickening of the wall as well as distortion and narrowing of the lumen (H & E, × 400).

Fig. 2 A 17-year-old man (case 2) presented with swelling of the upper and lower extremities. White blood cell count was 34,700/mm3, with 72% eosinophilia. A, B. CT scan obtained conventionally, during the portal venous phase, shows peripheral low attenuation with an irregular, ragged margin along the subcapsular area of the right hepatic lobe. Note the two small splenic lesions (B) (arrows). The hepatic parenchyma adjacent to the low attenuated lesion is slightly higher in attenuation. The liver is moderately enlarged. Liver biopsy revealed severe infiltration of the periportal area and central veins by eosinophils, as well as hepatic parenchymal infarction (not shown).
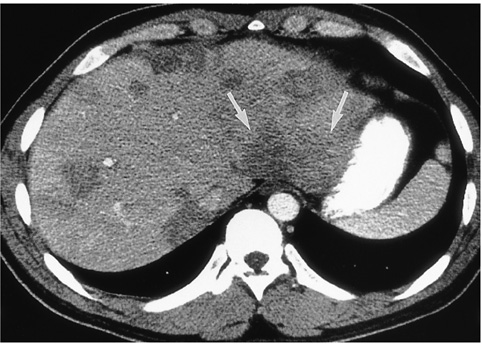
Fig. 3 A 27-year-old man (case 5) presented with epigastric discomfort. White blood cell count was 44,100/mm3, with 85% eosinophilia. CT scan obtained using a conventional technique shows multiple, well- or ill-defined, round, oval or wedge-shaped low-attenuated lesions of both lobes of the liver. Note the presence of a segmental lesion in the posterior part of the lateral segment of the left hepatic lobe (arrows). Liver biopsy revealed portal and periportal eosinophilic infiltration (not shown).
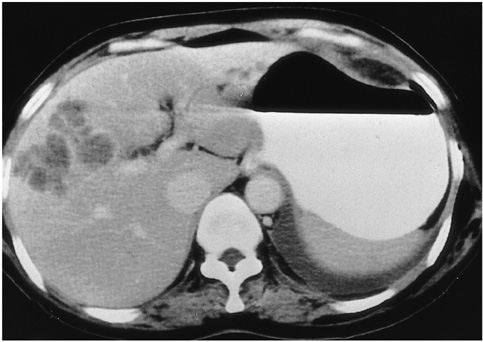
Fig. 4 A 50-year-old woman (case 3) presented with fever and chill. White blood cell count was 12,180/mm3, with 28% eosinophilia. CT scan obtained using a conventional technique shows multiseptated, lobulated, low-attenuated lesions with peripheral enhancement in the anterior segment of the right hepatic lobe. Biopsy disclosed periportal eosinophilic infiltration and eosinophilic abscess (not shown).
Reference
-
1. Hardy WR, Anderson RE. The hypereosinophilic syndrome. Ann Intern Med. 1968. 68:1220–1229.2. Fauci AS, Harley JB, Robert WC, Ferrans VJ, Gralnick HR, Bjornson BH. The idiopathic hypereosinophilic syndrome: clinical, pathophysiologic, and therapeutic considerations. Ann Intern Med. 1982. 97:78–92.3. Chusid MJ, Dale DC, West BC, Wolff SM. The hypereosinophilic syndrome: analysis of fourteen cases with review of the literature. Medicine. 1975. 54:1–27.4. Shiomi S, Kuroki T, Ueda T, Ikeoka N, Kobayashi K, Ochi H. Hypereosinophilic syndrome appearing as a focal defect on liver scan. Ann Nucl Med. 1991. 5:171–173.5. White WL, Wahner HW, Brown ML, James EM. Sequential liver imaging in the hypereosinophilic syndrome: discordant images with scintigraphy, ultrasound, and computed tomography. Clin Nucl Med. 1981. 6:75–77.6. Kim GB, Kwon JH, Kang DS. Hypereosinophilic syndrome: imaging findings in patients with hepatic involvement. AJR. 1993. 161:577–580.7. Lee WJ, Lim HK, Lim JH, Kim SH, Choi SH, Lee SJ. Foci of eosinophil-related necrosis in the liver: imaging findings and correlation with eosinophilia. AJR. 1999. 172:1255–1261.8. Cha SH, Park CM, Cha IH, et al. Hepatic involvement in hypereosinophilic syndrome: value of portal venous phase imaging. Abdom Imaging. 1998. 23:154–157.9. Kim KS, Lee M-K, Won YC, et al. Idiopathic hypereosinophilic syndrome involving the liver: CT features vs eosinophilia. J Korean Radiol Soc. 1997. 37:673–677.10. Nam KJ, Jung WJ, Choi J-C, et al. Hepatic involvement in hypereosinophilia: sonographic findings. J Ultrasound Med. 1999. 18:475–479.11. Foong A, Scholes JV, Gleich GJ, Kephart G, Holt PR. Eosinophil-induced chronic active hepatitis in the idiopathic hypereosinophilic syndrome. Hepatology. 1991. 13:1090–1094.12. Croffy BC, Kopelman RK, Kaplan M. Hypereosinophilic syndrome: association with chronic active hepatitis. Dig Dis Sci. 1988. 33:233–239.13. Itai Y, Moss AA, Goldberg HI. Transient hepatic attenuation difference of lobar or segmental distribution detected by dynamic computed tomography. Radiology. 1982. 144:835–839.14. Itai Y, Ohtomo K, Kokubo T, et al. Segmental intensity differences of the liver on MR imaging: a sign of intrahepatic portal flow stoppage. Radiology. 1988. 167:17–19.15. Nishikawa J, Itai Y, Tasaka A. Lobar attenuation differences of the liver on computed tomography. Radiology. 1981. 141:725–728.16. Itai Y, Murata S, Kurosaki Y. Straight border sign of the liver: spectrum of CT appearances and causes. RadioGraphics. 1995. 15:1089–1102.17. Itai Y, Matsui O. Blood flow and liver imaging. Radiology. 1997. 202:306–314.
- Full Text Links
-
- Actions
-
Cited
- CITED
-
- Close
- Share
-
- Similar articles
-
- A case of idiopathic hypereosinophilic syndrome presenting as only hepatic involvement
- Hypereosinophilic Syndrome with Hepatic Involvement in a Young Child
- A Case of Hypereosinophilic Syndrome with Hepatic and Gastrointestinal Involvement
- Pulmonary Involvement of Hypereosinophilic Syndrome: High-Resolution CT Findings in Three Patients
- Hypereosinophilic Syndrome with Hepatic Involvement: US, CT and MRI Findings
