Shift of Colorimetric Values in Ishihara Pseudoisochromatic Plates with Plate Aging
- Affiliations
-
- 1Department of Ophthalmology, Seoul National University Bundang Hospital, Seongnam, Korea. wrwee@snu.ac.kr
- 2Department of Ophthalmology, Seoul National University College of Medicine, Seoul, Korea.
- 3Seoul Artificial Eye Center, Seoul National University Hospital Clinical Research Institute, Seoul, Korea.
- KMID: 754414
- DOI: http://doi.org/10.3341/kjo.2005.19.2.145
Abstract
- PURPOSE
This study aimed to quantify the shift of colorimetric values in the Ishihara pseudoisochromatic test with aging of the plates. METHODS: Three sets of Ishihara pseudoisochromatic plates with different published dates (printed in 1971, 1983 and 2001) were tested. Positions matching 32 dots with 13 colors were chosen from each set and the colorimetric values with the CIELAB and HSB/HLS color systems were measured with a spectrophotometer. Lightness (L*), red-green (a*), blue-yellow (b*), chroma, red hue, yellow hue, and green hue values from each set were compared. RESULTS: L* and chroma values were significantly higher in the older versions. The a* values shifted to red (increased a*) and the b* values shifted to yellow (increased b*) with plate aging. CONCLUSIONS: Our results showed that the pseudoisochromatic plates had significant changes in color values and a directional shift with aging.
Keyword
MeSH Terms
Figure
-
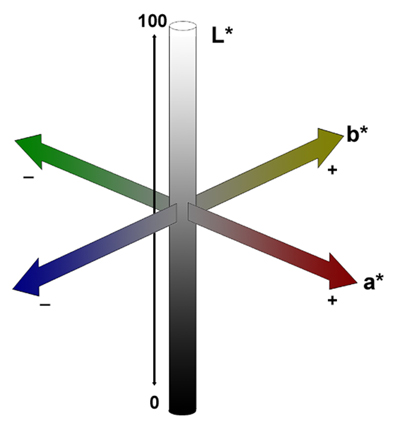
Fig. 1 Schematic diagram of the CIELab color model. The central vertical axis (L*) represents lightness with values ranging from 0 (black) to 100 (white). On the a-a' axis, positive values indicate amounts of red while negative values indicate amounts of green. On the b-b' axis, yellow shows positive values and blue shows negative values. For both axes, a zero value is neutral gray.
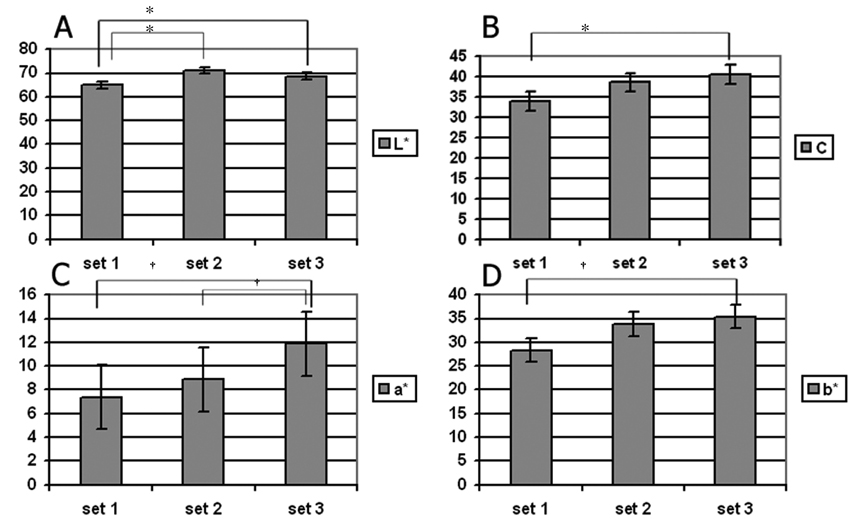
Fig. 2 Change of colorimetric values in the Ishihara pseudoisochromatic color test with different published dates. Sets 1, 2, and 3 were published in 2001, 1983, and 1971, respectively. Color dots were much brighter (A) and more saturated (B) in the older sets. In the CIELab color model, redness was increased on the red-green axis (C) and the colors were shifted toward yellow on the blue-yellow axis (D) in the older version (set 3) of the color test plates. *Analysis of variance, p<0.05, †Analysis of covariance, p<0.05
Reference
-
1. Birch J. Efficiency of the Ishihara test for identifying redgreen colour deficiency. Ophthalmic Physiol Opt. 1997. 17:403–408.2. Holland PM. Adult color vision screening. Comparison of stereoscopic vision tester slide with Ishihara plates. Arch Ophthalmol. 1972. 88:613–616.3. Hardy LH, Rand G, Rittler MC. The H-R-R polychromatic plates. I. A. test for the detection, classification, and estimation of the degree of defective color vision. AMA Arch Ophthalmol. 1954. 51:216–228.4. Smith VC, Pokorny J, Pass AS. Color-axis determination on the Farnsworth-Munsell 100-hue test. Am J Ophthalmol. 1985. 100:176–182.5. Seghi RR, Johnston WM, O'Brien WJ. Spectrophotometric analysis of color differences between porcelain systems. J Prosthet Dent. 1986. 56:35–40.6. Seghi RR, Johnston WM, O'Brien WJ. Performance assessment of colorimetric devices on dental porcelains. J Dent Res. 1989. 68:1755–1759.7. Hurvich LM, Jameson D. An opponent-process theory of color vision. Psychol Rev. 1957. 64:384–404.8. Honson VJ, Dain SJ. Performance of the standard pseudoisochromatic plate test. Am J Optom Physiol Opt. 1988. 65:561–570.9. Birch J. The design of diagnostic tests for defective colour vision. Br J Physiol Opt. 1976. 31:32–37.10. Kim MS, Lu WN, Lee K, et al. Seohan computerized hue test (1): the development of computerized color vision test and pilot study. J Korean Ophthalmol Soc. 2000. 41:205–214.11. Kim MS, Hwang JM, Wee WR, et al. Seohan computerized hue test (2): total error scores according to the age in normal subjects and total error scores and central cap in color defectives. J Korean Ophthalmol Soc. 2001. 42:453–458.12. Shin YJ, Choi SY, Park KH, et al. The classification of congenital color vision deficiency by SNU computerized color test. J Korean Ophthalmol Soc. 2004. 45:2099–2104.
- Full Text Links
-
- Actions
-
Cited
- CITED
-
- Close
- Share
-
- Similar articles
-
- Color test using the Hahn Pseudoisochromatic Plates
- A Review of Color Deficiency Among the Industrial Workers
- Evaluation of the Hahn's Pseudoisochromatic Plates
- Farnsworth-Munsell 100 Hue Test:in Detection of the Color Defective Subjects
- A Review of Color Deficiency Among the Applicants for Driver License
