Precision Medicine in Treatment: Based on Multiomics or Clinical Data
- Affiliations
-
- 1School of Biological Sciences, Seoul National University, Seoul, Korea
- 2SNU Bioinformatics Institute, Seoul, Korea
- KMID: 2550160
- DOI: http://doi.org/10.4093/jkd.2023.24.4.204
Abstract
- Huge amounts of global data (genomic, epigenomic, transcriptomic, proteomic, and metabolomic) generated from a broad spectrum of specimens collected from human patients have accumulated in public repositories, together with electronic health records and drug treatment information. Accordingly, there is a need for bioinformatic methods that can effectively extract useful information for precision medicine. Here, we present two precision medicine approaches using multiomics data and clinical big data, respectively.
Figure
-
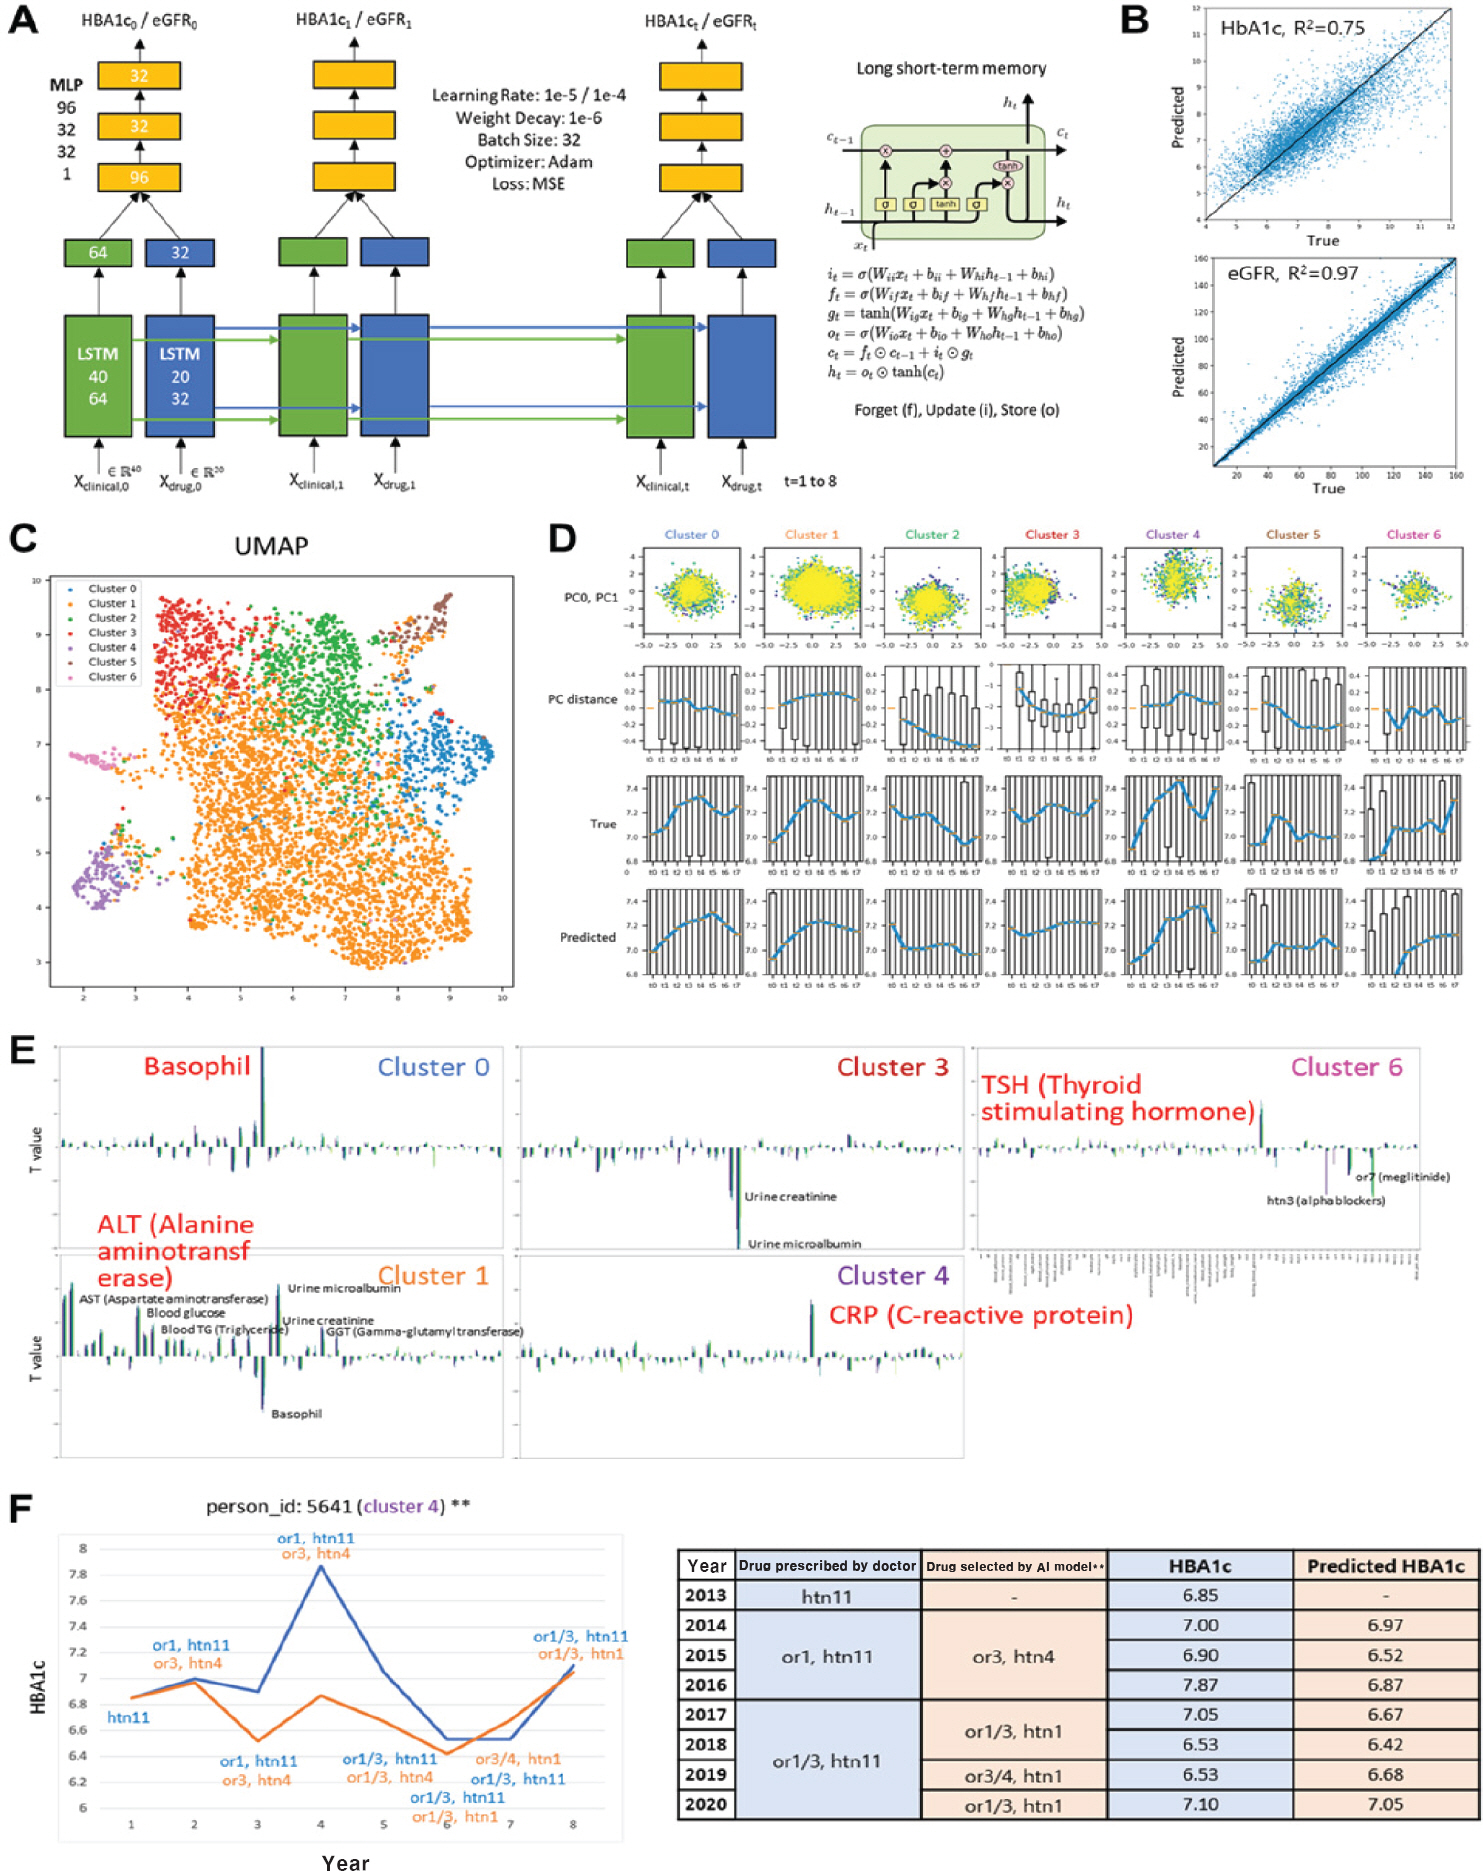
Fig. 1. RNN (recurrent neural network)-based deep learning model using time-course clinical data. (A) Deep learning model architecture. X i,j indicates clinical data measured or drug types (i) used at time j. Forty clinical variables and 20 drug types were used. The other numbers indicate the node numbers in the corresponding neural networks. (B) Prediction accuracy of the deep learning model. (C) Patient clustering using the embedded states in the 1st multilayer perceptron (MLP) layer. (D) Distribution of temporal profiles of the measured (True) and predicted glycated hemoglobin HbA1c (Predicted) in patients included in each cluster. Principal component analysis (PCA) plot and distance represent how the embedded state in the 1st MLP layer vary over time. Blue to yellow colors in PCA plot represent early to late time points, respectively. (E) Contribution of each clinical variables and drug types to each cluster. T values indicate positive and negative contributions to defining each cluster. Clinical variables highly contributing to individual clusters are indicated in red. (F) Actual measured (blue) and model predicted (orange) glycated hemoglobin changes over years and actual prescribed (blue) and model determined (orange) treatment regimens. eGFR, estimated glomerular filtration rate; LSTM, long short-term memory; UMAP, uniform manifold approximation and projection.

Fig. 2. Determination and characterization of subtypes of patients with early-onset gastric cancers through integrative clustering using mRNA and protein data (A-D). (A) mRNA, RNA1∼2. (B) Protein, Prot1∼4. (C) Phosphorylation, Phos1∼3. (D) N-glycosylation, Gly1∼3. For example, RNA1 was defined by upregulation of 919 genes (rna1). (E) Four subtypes (Sub1∼4) determined by integrated clustering of individual omics-based clusters. (F) Cellular pathways enriched by the mRNA (rna1∼2) or protein signatures (prot1∼4, phos1∼3, or gly1∼3) defining each subtype. Colors in the heat map indicate the enrichment significance, -log10(P value), and the pathways with P ≤ 0.05 were denoted in color (see the color bar). Adapted from the article of Mun et al. (Cancer Cell 2019;35:111-24.e10) [4] with original copyright holder's permission.

Fig. 3. Network models showing pathways defined by the interactions among the genes (rna2 for Sub2 and rna1 for Sub4) and proteins (prot1, phos3, and gly3 for Sub2 and prot2, phos1, and gly1 for Sub4; see Fig. 2E) predominantly upregulated in Sub2 (A) and Sub4 (B). Node colors and circled labels, respectively, represent upregulation of mRNA (node center), protein (node boundary), phosphorylation (circled P), and glycosylation (circled G) levels in each network. Adapted from the article of Mun et al. (Cancer Cell 2019;35:111-24.e10) [4] with original copyright holder's permission.
Reference
-
1.Mertins P., Mani DR., Ruggles KV., Gillette MA., Clauser KR., Wang P, et al. Proteogenomics connects somatic mutations to signalling in breast cancer. Nature. 2016. 534:55–62.2.Zhang B., Wang J., Wang X., Zhu J., Liu Q., Shi Z, et al. Proteogenomic characterization of human colon and rectal cancer. Nature. 2014. 513:382–7.3.Zhang H., Liu T., Zhang Z., Payne SH., Zhang B., McDer-mott JE, et al. Integrated proteogenomic characterization of human high-grade serous ovarian cancer. Cell. 2016. 166:755–65.4.Mun DG., Bhin J., Kim S., Kim H., Jung JH., Jung Y, et al. Proteogenomic characterization of human early-onset gastric cancer. Cancer Cell. 2019. 35:111–24.e10.5.Hyeon DY., Nam D., Han Y., Kim DK., Kim G., Kim D, et al. Proteogenomic landscape of human pancreatic ductal adenocarcinoma in an Asian population reveals tumor cell-enriched and immune-rich subtypes. Nat Cancer. 2023. 4:290–307.
- Full Text Links
-
- Actions
-
Cited
- CITED
-
- Close
- Share
-
- Similar articles
-
- Multiomics Approach to Acromegaly: Unveiling Translational Insights for Precision Medicine
- Knowledge-guided artificial intelligence technologies for decoding complex multiomics interactions in cells
- Correspondence to editorial on “Multiomics profiling of buffy coat and plasma unveils etiology-specific signatures in hepatocellular carcinoma”
- Applying Precision Medicine in Clinical Practice
- Systems Biology of Human Microbiome for the Prediction of Personal Glycaemic Response
