Healthc Inform Res.
2022 Jul;28(3):247-255. 10.4258/hir.2022.28.3.247.
Cancer Risk Score Prediction Based on a Single-Nucleotide Polymorphism Network
- Affiliations
-
- 1Department of Statistics, School of Computer Science, Bina Nusantara University, Jakarta, Indonesia
- 2Bioinformatics and Data Science Research Center, Bina Nusantara University, Jakarta, Indonesia
- 3Department of Computer Science, School of Computer Science, Bina Nusantara University, Jakarta, Indonesia
- 4Department of Computer Science, BINUS Graduate Program-Master of Computer Science Program, Bina Nusantara University, Jakarta, Indonesia
- KMID: 2532452
- DOI: http://doi.org/10.4258/hir.2022.28.3.247
Abstract
Objectives
Genome-wide association studies (GWAS) are performed to study the associations between genetic variants with respect to certain phenotypic traits such as cancer. However, the method that is commonly used in GWAS assumes that certain traits are solely affected by a single mutation. We propose a network analysis method, in which we generate association networks of single-nucleotide polymorphisms (SNPs) that can differentiate case and control groups. We hypothesize that certain phenotypic traits are attributable to mutations in groups of associated SNPs.
Methods
We propose a method based on a network analysis framework to study SNP-SNP interactions related to cancer incidence. We employed logistic regression to measure the significance of all SNP pairs from GWAS for the incidence of colorectal cancer and computed a cancer risk score based on the generated SNP networks.
Results
We demonstrated our method in a dataset from a case-control study of colorectal cancer in the South Sulawesi population. From the GWAS results, 20,094 pairs of 200 SNPs were created. We obtained one cluster containing four pairs of five SNPs that passed the filtering threshold based on their p-values. A locus on chromosome 12 (12:54410007) was found to be strongly connected to the four variants on chromosome 1. A polygenic risk score was computed from the five SNPs, and a significant difference in colorectal cancer risk was obtained between the case and control groups.
Conclusions
Our results demonstrate the applicability of our method to understand SNP-SNP interactions and compute risk scores for various types of cancer.
Figure
-
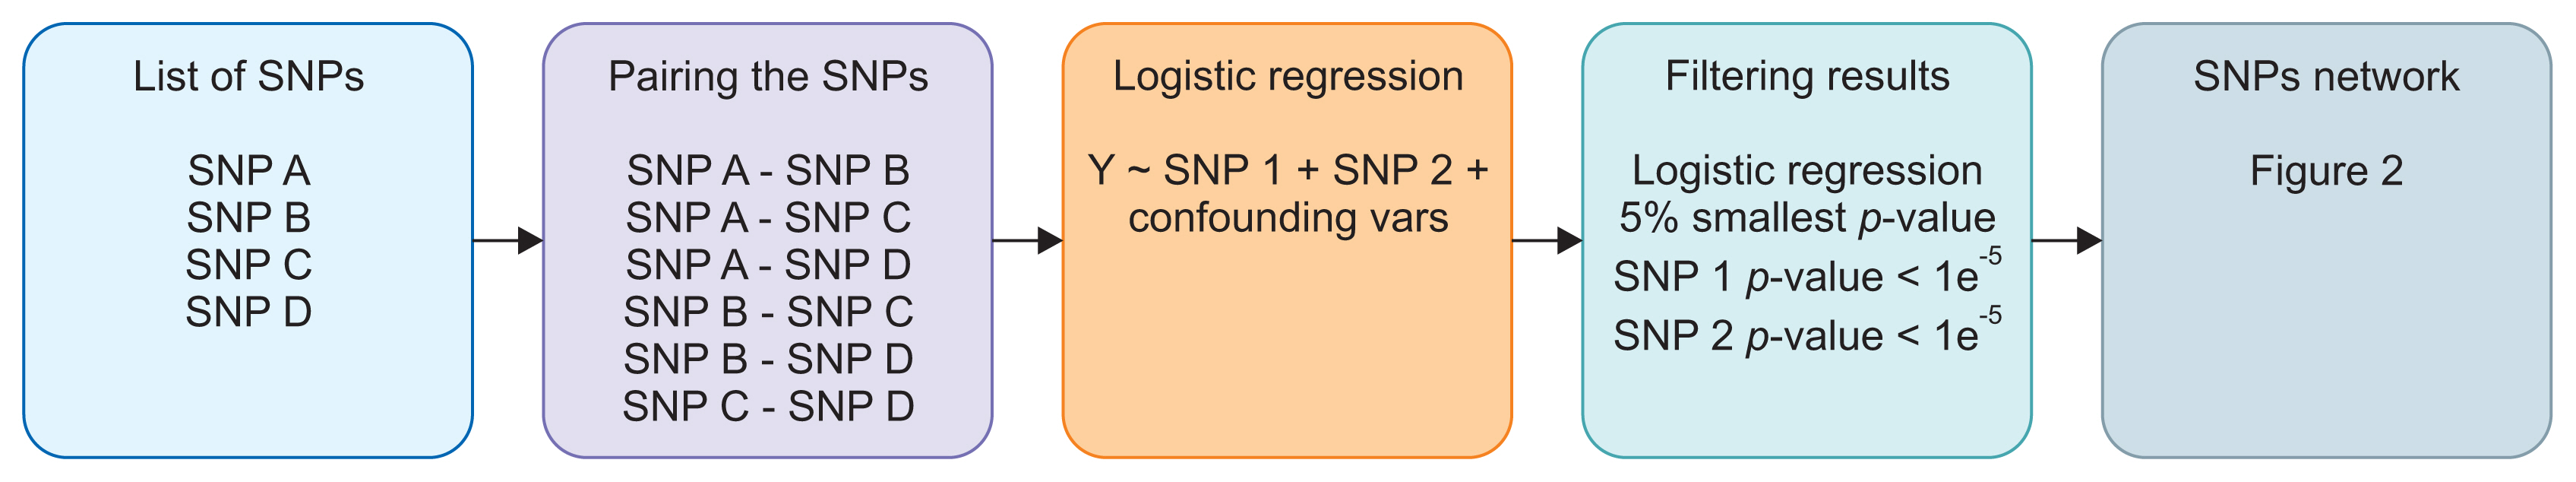
Figure 1 Network analysis workflow. SNP: single-nucleotide polymorphism.
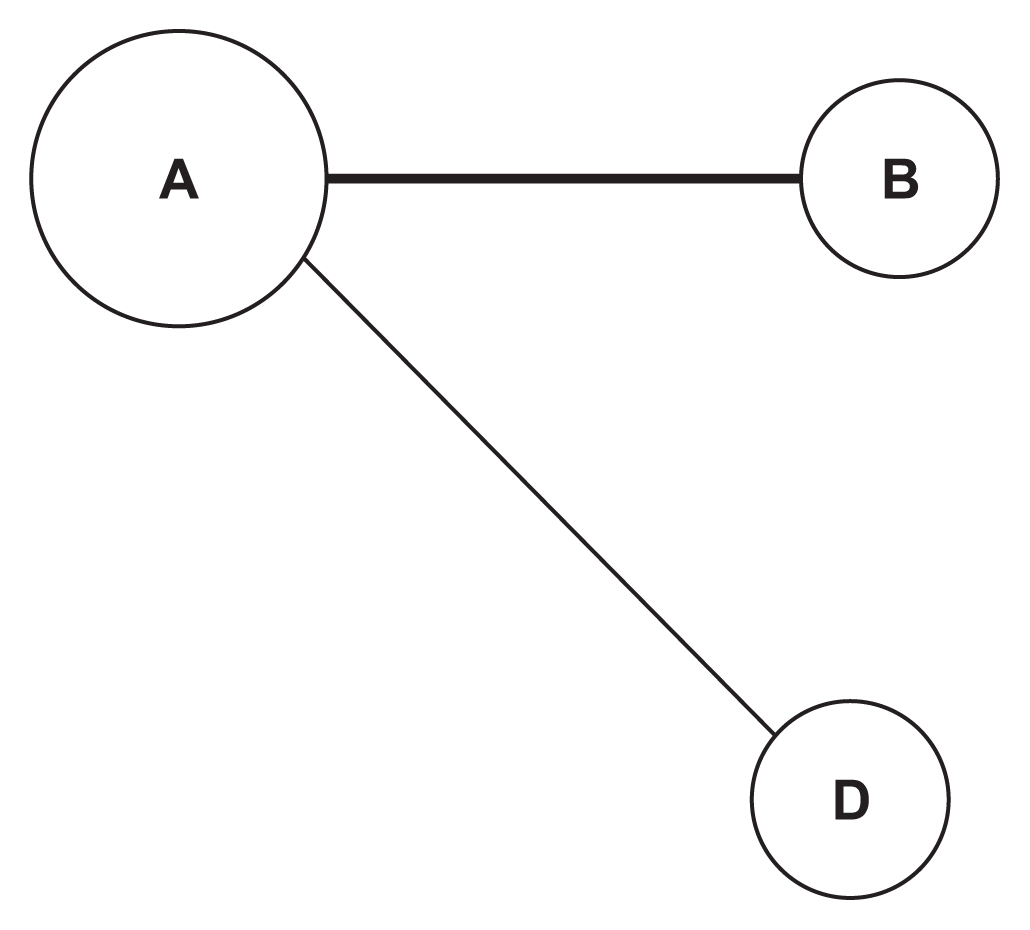
Figure 2 Example of a single-nucleotide polymorphism (SNP) network.

Figure 3 Normalized p-value distribution.

Figure 4 Generated single-nucleotide polymorphism (SNP) network with a 1 × 10⁻⁵ threshold.

Figure 5 Association plot for the 100-kb region flanking rs6686879 on chromosome 1.
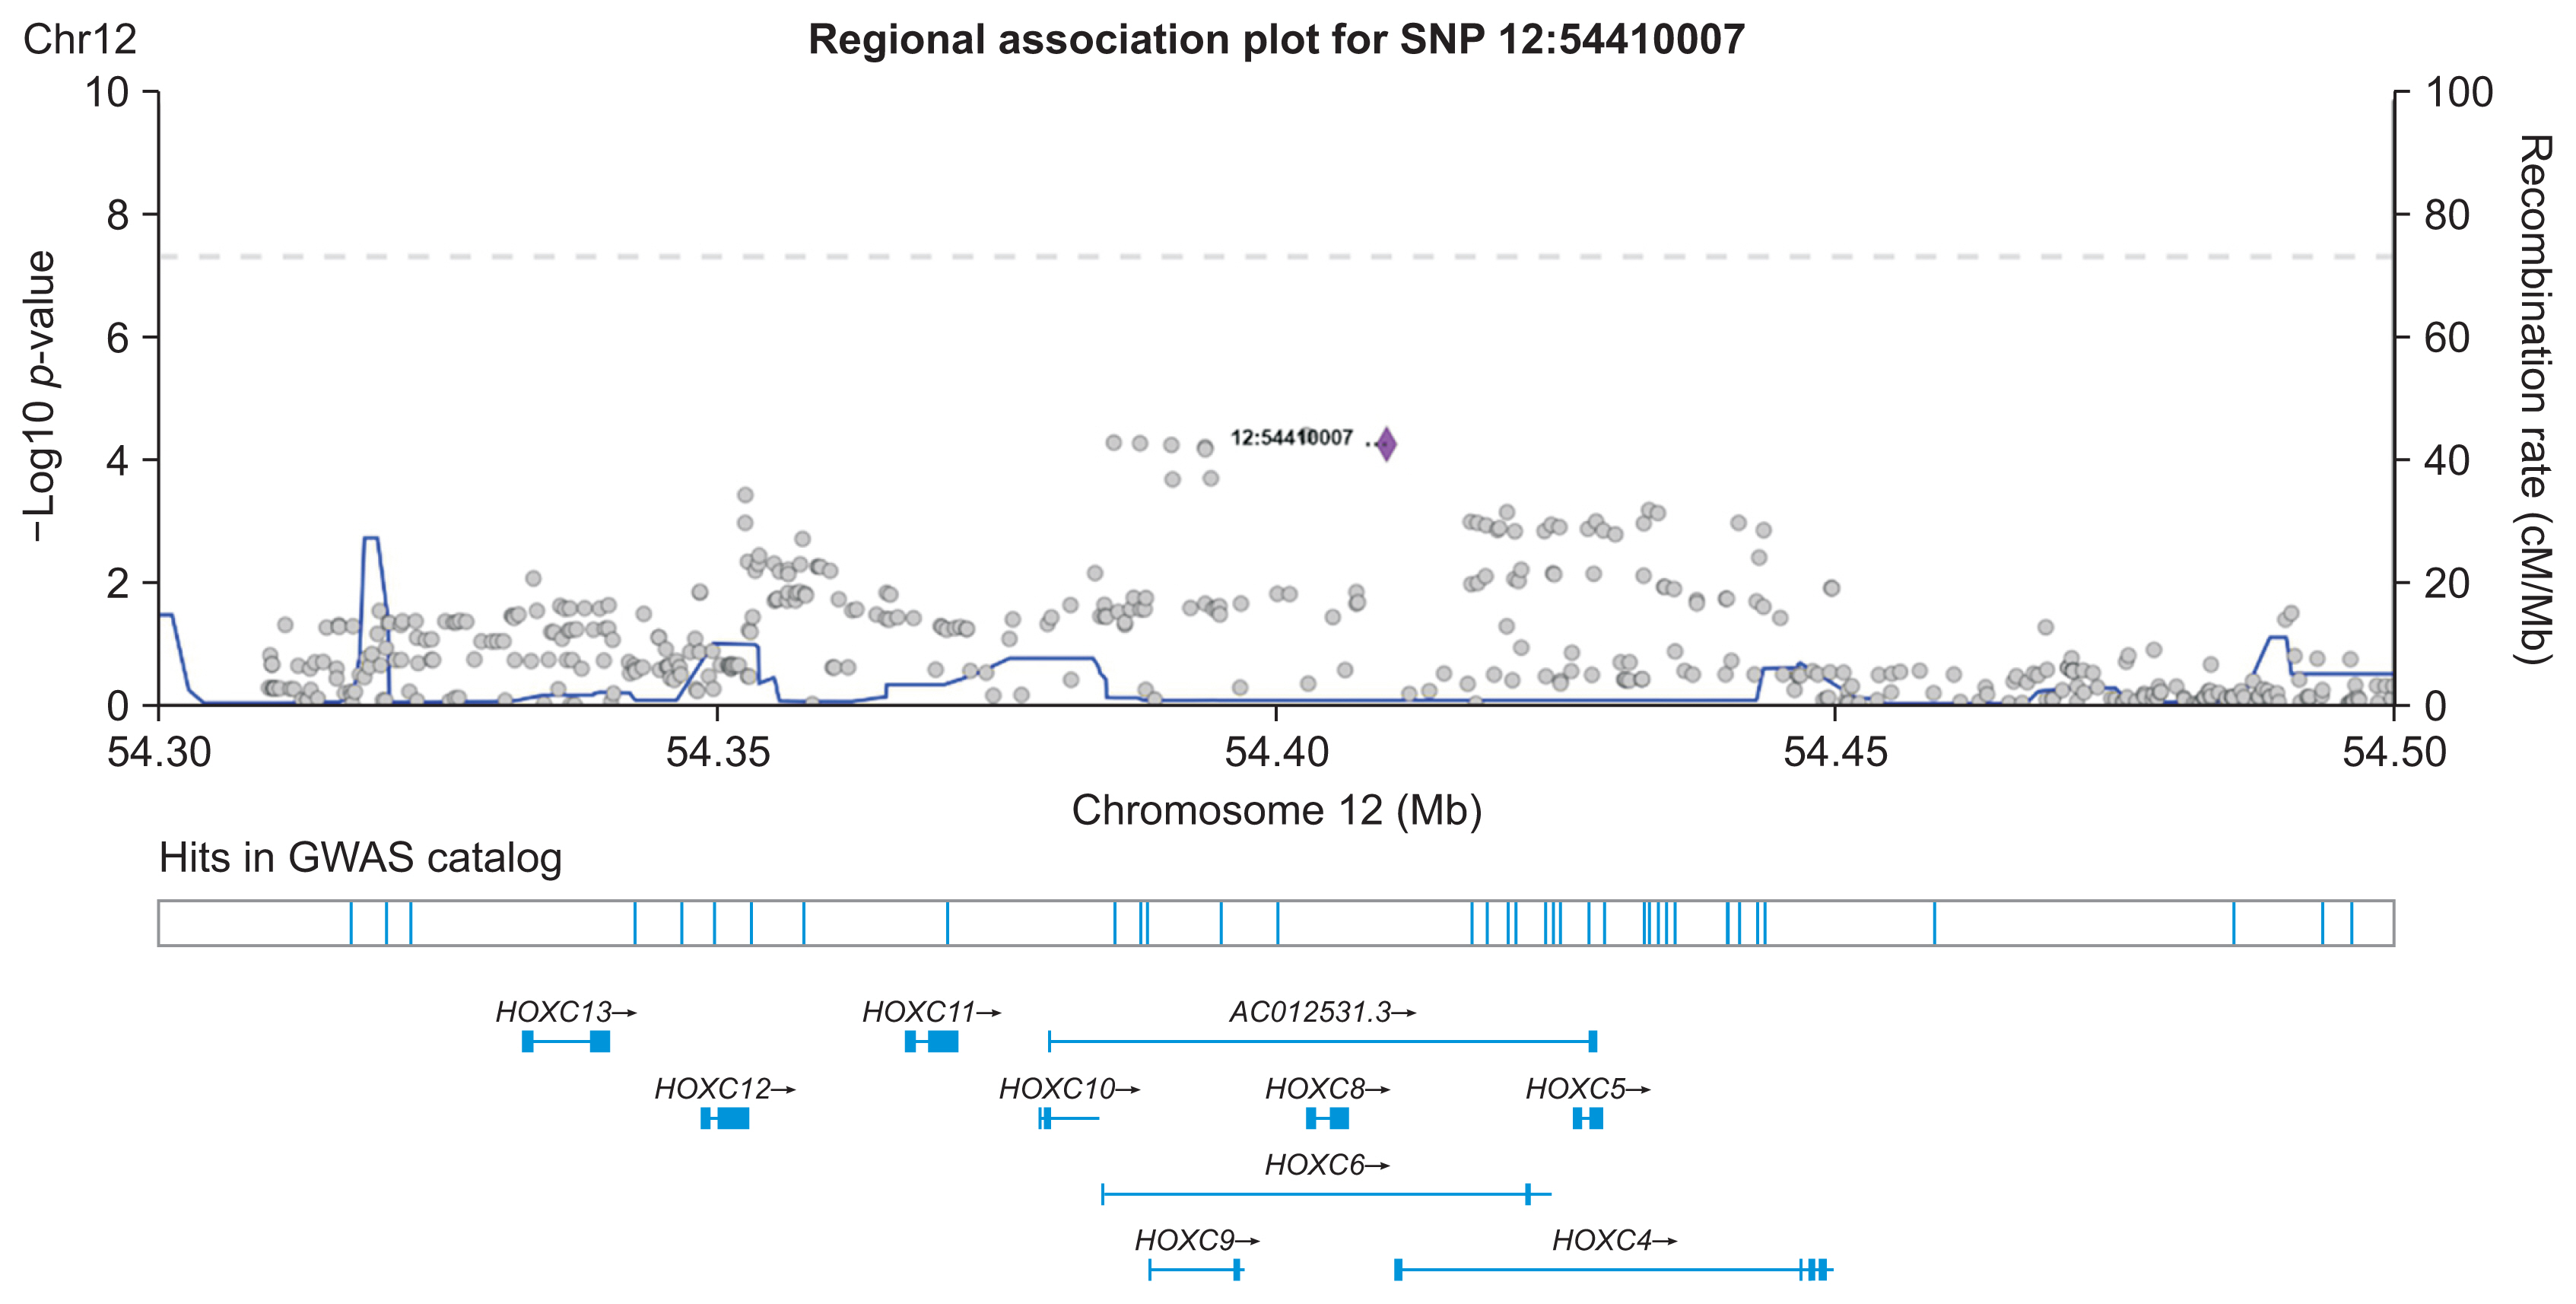
Figure 6 Association plot for the 100-kb region flanking 12:54410007 on chromosome 12.

Figure 7 Boxplots of the colorectal cancer risk score. (A) Network analysis risk score case and control groups (p-value threshold: 1 × 10⁻⁵). (B) Single-nucleotide polymorphisms (SNPs) with 5 lowest p-value risk score case and control groups.
Reference
-
References
1. World Health Organization. Fact sheet: cancer [Internet]. Geneva, Switzerland: World Health Organization;2022. [cited at 2022 Jul 6]. Available from: https://www.who.int/news-room/fact-sheets/detail/cancer.2. International Agency for Research on Cancer. Global Cancer Observatory: estimated number of new cases and deaths in 2020 [Internet]. Lyon, France: International Agency for Research on Cancer;c2022. [cited at 2022 Jul 6]. Available from: https://gco.iarc.fr/today/online-analysis-table?v=2020&mode=cancer&mode_population=continents&population=900&populations=900&key=asr&sex=0&cancer=39&type=1&statistic=5&prevalence=0&population_group=0&ages_group%5B%5D=0&ages_group%5B%5D=17&group_cancer=1&i.3. Miller KD, Nogueira L, Mariotto AB, Rowland JH, Yabroff KR, Alfano CM, et al. Cancer treatment and survivorship statistics, 2019. CA Cancer J Clin. 2019; 69(5):363–85. https://doi.org/10.3322/caac.21565.
Article4. Wattacheril J, Kramer JR, Richardson P, Havemann BD, Green LK, Le A, et al. Lagtimes in diagnosis and treatment of colorectal cancer: determinants and association with cancer stage and survival. Aliment Pharmacol Ther. 2008; 28(9):1166–74. https://doi.org/10.1111/j.1365-2036.2008.03826.x.
Article5. Wulfkuhle JD, Liotta LA, Petricoin EF. Proteomic applications for the early detection of cancer. Nat Rev Cancer. 2003; 3(4):267–75. https://doi.org/10.1038/nrc1043.
Article6. Hecht SS. Tobacco carcinogens, their biomarkers and tobacco-induced cancer. Nat Rev Cancer. 2003; 3(10):733–44. https://doi.org/10.1038/nrc1190.
Article7. Rehm J, Shield KD, Weiderpass E. Alcohol consumption. A leading risk factor for cancer. Chem Biol Interact. 2020; 331:109280. https://doi.org/10.1016/j.cbi.2020.109280.
Article8. Key TJ, Schatzkin A, Willett WC, Allen NE, Spencer EA, Travis RC. Diet, nutrition and the prevention of cancer. Public Health Nutr. 2004; 7(1A):187–200. https://doi.org/10.1079/PHN2003588.
Article9. Lee IM. Physical activity and cancer prevention: data from epidemiologic studies. Med Sci Sports Exerc. 2003; 35(11):1823–7. https://doi.org/10.1249/01.mss.0000093620.27893.23.
Article10. Yusuf I, Pardamean B, Baurley JW, Budiarto A, Miskad UA, Lusikooy RE, et al. Genetic risk factors for colorectal cancer in multiethnic Indonesians. Sci Rep. 2021; 11(1):9988. https://doi.org/10.1038/s41598-021-88805-4.
Article11. Zuk O, Hechter E, Sunyaev SR, Lander ES. The mystery of missing heritability: genetic interactions create phantom heritability. Proc Natl Acad Sci U S A. 2012; 109(4):1193–8. https://doi.org/10.1073/pnas.1119675109.
Article12. Sapkota Y, Mackey JR, Lai R, Franco-Villalobos C, Lupichuk S, Robson PJ, et al. Assessing SNP-SNP interactions among DNA repair, modification and metabolism related pathway genes in breast cancer susceptibility. PLoS One. 2013; 8(6):e64896. https://doi.org/10.1371/journal.pone.0064896.
Article13. Lin HY, Amankwah EK, Tseng TS, Qu X, Chen DT, Park JY. SNP-SNP interaction network in angiogenesis genes associated with prostate cancer aggressiveness. PLoS One. 2013; 8(4):e59688. https://doi.org/10.1371/journal.pone.0059688.
Article14. Goodman J, Weare J. Ensemble samplers with affine invariance. Commun Appl Math Comput Sci. 2010; 5(1):65–80.
Article15. Jiao S, Hsu L, Berndt S, Bezieau S, Brenner H, Buchanan D, et al. Genome-wide search for gene-gene interactions in colorectal cancer. PLoS One. 2012; 7(12):e52535. https://doi.org/10.1371/journal.pone.0052535.
Article16. Loblich M, Pfaff-Rudiger S. Network analysis: a qualitative approach to empirical studies on communication policy. Int Commun Gaz. 2011; 73(7):630–47. https://doi.org/10.1177%2F1748048511417159.
Article17. Kontou PI, Pavlopoulou A, Dimou NL, Pavlopoulos GA, Bagos PG. Network analysis of genes and their association with diseases. Gene. 2016; 590(1):68–78. https://doi.org/10.1016/j.gene.2016.05.044.
Article18. Chang HH, McGeachie M. Phenotype prediction by integrative network analysis of SNP and gene expression microarrays. Annu Int Conf IEEE Eng Med Biol Soc. 2011; 2011:6849–52. https://doi.org/10.1109/IEMBS.2011.6091689.
Article19. Levine ME, Langfelder P, Horvath S. A weighted SNP correlation network method for estimating polygenic risk scores. Methods Mol Biol. 2017; 1613:277–90. https://doi.org/10.1007/978-1-4939-7027-8_10.
Article20. Joyner C, McMahan C, Baurley J, Pardamean B. A two-phase Bayesian methodology for the analysis of binary phenotypes in genome-wide association studies. Biom J. 2020; 62(1):191–201. https://doi.org/10.1002/bimj.201900050.
Article21. Amadeus S, Cenggoro TW, Budiarto A, Pardamean B. A design of polygenic risk model with deep learning for colorectal cancer in multiethnic Indonesians. Procedia Comput Sci. 2022. 1179:632–9. https://doi.org/10.1016/j.procs.2021.01.049.
Article22. Mahesworo B, Budiarto A, Pardamean B. Systematic evaluation of cross population polygenic risk score on colorectal cancer. Procedia Comput Sci. 2021; 179:344–51. https://doi.org/10.1016/j.procs.2021.01.015.
Article23. Baurley JW, Edlund CK, Pardamean CI, Conti DV, Bergen AW. Smokescreen: a targeted genotyping array for addiction research. BMC Genomics. 2016; 17:145. https://doi.org/10.1186/s12864-016-2495-7.
Article24. Raj A, Stephens M, Pritchard JK. fast STRUCTURE: variational inference of population structure in large SNP data sets. Genetics. 2014; 197(2):573–89. https://doi.org/10.1534/genetics.114.164350.
Article25. Pruim RJ, Welch RP, Sanna S, Teslovich TM, Chines PS, Gliedt TP, et al. LocusZoom: regional visualization of genome-wide association scan results. Bioinformatics. 2010; 26(18):2336–7. https://doi.org/10.1093/bioinformatics/btq419.
Article26. Ji M, Feng Q, He G, Yang L, Tang W, Lao X, et al. Silencing homeobox C6 inhibits colorectal cancer cell proliferation. Oncotarget. 2016; 7(20):29216–27. https://doi.org/10.18632%2Foncotarget.8703.
Article27. Li J, Zeng Z, Chen J, Liu X, Jiang X, Sun W, et al. Pathologic evolution-related Gene Analysis based on both single-cell and bulk transcriptomics in colorectal cancer. J Cancer. 2020; 11(23):6861–73. https://doi.org/10.7150/jca.49262.
Article28. Qi L, Ye C, Zhang D, Bai R, Zheng S, Hu W, et al. The effects of differentially-expressed homeobox family genes on the prognosis and HOXC6 on immune microenvironment orchestration in colorectal cancer. Front Immunol. 2021; 12:781221. https://doi.org/10.3389/fimmu.2021.781221.
Article29. Kafaie S, Chen Y, Hu T. A network approach to prioritizing susceptibility genes for genome-wide association studies. Genet Epidemiol. 2019; 43(5):477–91. https://doi.org/10.1002/gepi.22198.
Article30. Pandey A, Davis NA, White BC, Pajewski NM, Savitz J, Drevets WC, et al. Epistasis network centrality analysis yields pathway replication across two GWAS cohorts for bipolar disorder. Transl Psychiatry. 2012; 2(8):e154. https://doi.org/10.1038/tp.2012.80.
Article
- Full Text Links
-
- Actions
-
Cited
- CITED
-
- Close
- Share
-
- Similar articles
-
- Advantages of the single nucleotide polymorphism-based noninvasive prenatal test
- Genetic Polymorphism Predisposing to Differentiated Thyroid Cancer: A Review of Major Findings of the Genome-Wide Association Studies
- An Association of C/T Polymorphism in the TFF1 Gene and the Susceptibility to Gastric Cancer
- Relevance Epistasis Network of Gastritis for Intra-chromosomes in the Korea Associated Resource (KARE) Cohort Study
- Genetic association study of single nucleotide polymorphism in dentistry
