Quality Matters as Much as Quantity of Skeletal Muscle: Clinical Implications of Myosteatosis in Cardiometabolic Health
- Affiliations
-
- 1Subdivision of Endocrinology and Metabolism, Health Screening and Promotion Center, Asan Medical Center, Seoul, Korea
- 2Division of Endocrinology and Metabolism, Department of Internal Medicine, Soonchunhyang University Bucheon Hospital, Soonchunhyang University College of Medicine, Bucheon, Korea
- KMID: 2523485
- DOI: http://doi.org/10.3803/EnM.2021.1348
Abstract
- Although age-related changes in skeletal muscles are closely associated with decreases in muscle strength and functional decline, their associations with cardiometabolic diseases in the literature are inconsistent. Such inconsistency could be explained by the fact that muscle quality—which is closely associated with fatty infiltration of the muscle (i.e., myosteatosis)—is as important as muscle quantity in cardiometabolic health. However, muscle quality has been less explored compared with muscle mass. Moreover, the standard definition of myosteatosis and its assessment methods have not been established yet. Recently, some techniques using single axial computed tomography (CT) images have been introduced and utilized in many studies, as the mass and quality of abdominal muscles could be measured opportunistically on abdominal CT scans obtained during routine clinical care. Yet, the mechanisms by which myosteatosis affect metabolic and cardiovascular health remain largely unknown. In this review, we explore the recent advances in the assessment of myosteatosis and its changes associated with aging. We also review the recent literature on the clinical implication of myosteatosis by focusing on metabolic and cardiovascular diseases. Finally, we discuss the challenges and unanswered questions that need addressing to set myosteatosis as a therapeutic target for the prevention or treatment of cardiometabolic diseases.
Figure
-

Fig. 1. Three different adipose depots in skeletal muscle. (A) Skeletal muscle is made up of intramyocellular myofibrils, muscle fibers, and fascicles bound together by successively thicker connective tissue layers (i.e., endomysium, perimysium, and epimysium). (B) Skeletal muscle fat may be classified into intramyocellular (lipid droplets filling the cytoplasm between the myofibrils of elongated myocytes) and extramyocellular components. Adipocytes may infiltrate between muscle fibers (intramuscular fat) and fascicles (intermuscular fat) or exist around the epimysium as extramuscular fat depots of adipose tissue. Reprinted from Altajar et al. [5].

Fig. 2. Muscle quality map derived from abdominal computed tomography (CT) using an automated artificial intelligence software. The total abdominal muscle area (TAMA) includes all muscles on the selected axial images (i.e., psoas, paraspinal, transversus abdominis, rectus abdominis, quadratus lumborum, and internal and external obliques). The TAMA is segmented into three areas according to the CT density [16]: (1) inter and intramuscular adipose tissue area (IMAT; −190 to −30 Hounsfield unit [HU], yellow), (2) normal attenuation muscle area (NAMA; 30 to 150 HU, red), and (3) low attenuation muscle area (LAMA; −29 to 29 HU, sky blue). The skeletal muscle area (SMA, −29 to 150) refers to the combined area of NAMA and LAMA. Reprinted from Kim et al. [22], with permission from Elsevier.
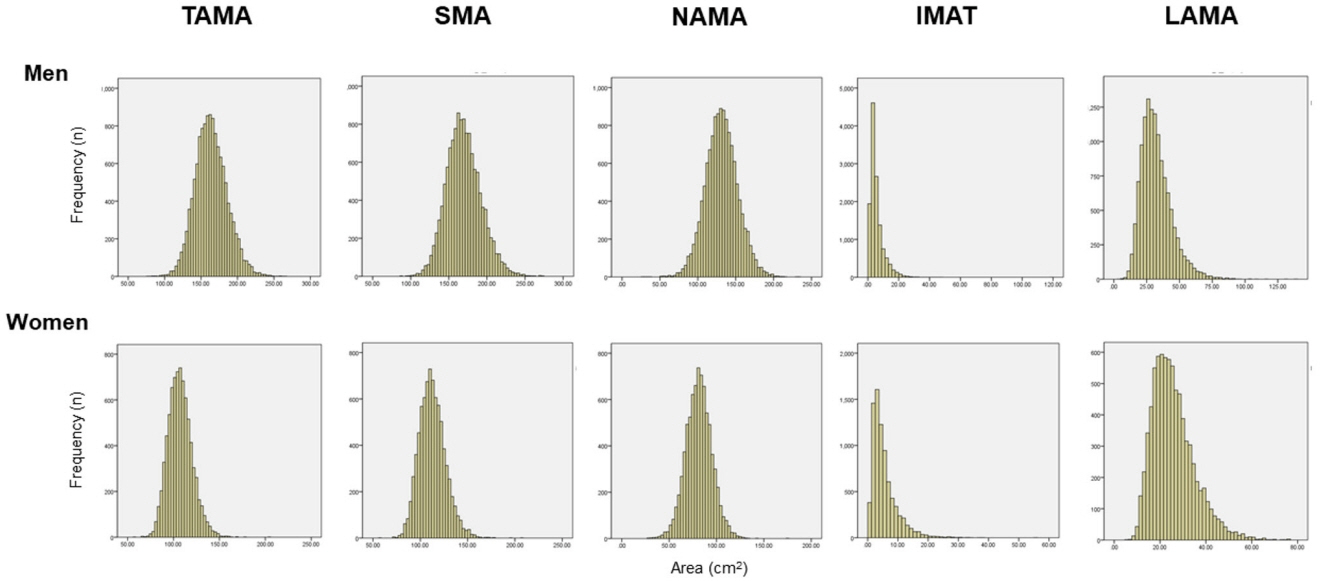
Fig. 3. Histogram of computed tomography measurements in a Korean population of general health check-up participants (n=12,697 men and 7,967 women, age 20 to 88 years). TAMA, total abdominal muscle area; SMA, skeletal muscle area; NAMA, normal attenuation muscle area; IMAT, inter and intramuscular adipose tissue area; LAMA, low attenuation muscle area.

Fig. 4. Distribution of computed tomography measurements according to sex and age group in a Korean population of general health check-up participants (n=12,697 men and 7,967 women, age 20 to 88 years) [22]. TAMA, total abdominal muscle area; SMA, skeletal muscle area; NAMA, normal attenuation muscle area; IMAT, inter and intramuscular adipose tissue area; LAMA, low attenuation muscle area.

Fig. 5. Box-plot distribution of the normal attenuation muscle area (NAMA)/total abdominal muscle area (TAMA) index according to age group in men (blue) and women (red). NAMA/TAMA index=(NAMA/TAMA)×100. Reprinted from Kim et al. [22], with permission from Elsevier.

Fig. 6. Prevalence of myosteatosis defined by T-scores (<–2) of normal attenuation muscle area (NAMA)/total abdominal muscle area (TAMA) index according to sex and age group in a Korean population of general health check-up participants (n=12,697 men and 7,967 women, age 20 to 88 years). NAMA/TAMA index=(NAMA/TAMA)×100.
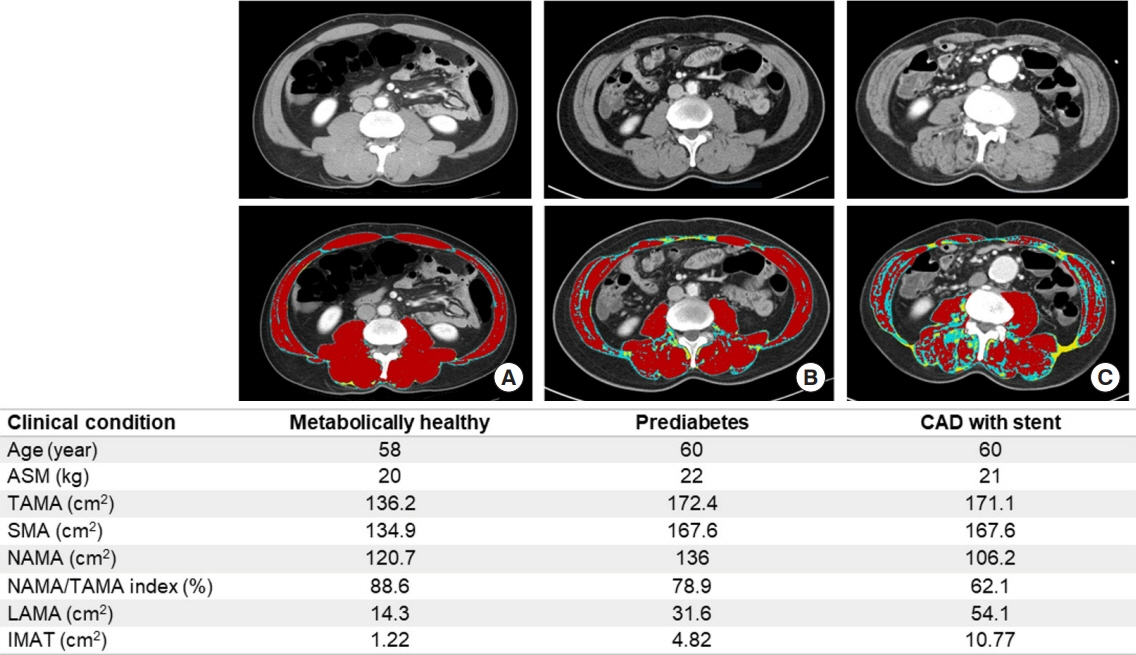
Fig. 7. Representative cases of similar age with different degrees of myosteatosis. Axial computed tomography scan images on L3 vertebral level from (A) a 58-year-old metabolically healthy man shows higher normal attenuation muscle area (NAMA; red)/total abdominal muscle area (TAMA) index and good quality muscles without myosteatosis, (B) a 60-year-old man with prediabetes shows lower NAMA/TAMA index and some fat infiltration of skeletal muscles, and (C) a 60-year-old man with coronary artery disease (CAD) having coronary stent shows lowest NAMA/TAMA index and more severe fat infiltration of skeletal muscles. ASM, appendicular skeletal muscle; SMA, skeletal muscle area; NAMA/TAMA index=(NAMA/TAMA)×100; LAMA, low attenuation muscle area (sky blue); IMAT, inter and intramuscular adipose tissue area (yellow).
Reference
-
1. Goodpaster BH, Park SW, Harris TB, Kritchevsky SB, Nevitt M, Schwartz AV, et al. The loss of skeletal muscle strength, mass, and quality in older adults: the health, aging and body composition study. J Gerontol A Biol Sci Med Sci. 2006; 61:1059–64.
Article2. Cruz-Jentoft AJ, Bahat G, Bauer J, Boirie Y, Bruyere O, Cederholm T, et al. Sarcopenia: revised European consensus on definition and diagnosis. Age Ageing. 2019; 48:16–31.
Article3. Beasley LE, Koster A, Newman AB, Javaid MK, Ferrucci L, Kritchevsky SB, et al. Inflammation and race and gender differences in computerized tomography-measured adipose depots. Obesity (Silver Spring). 2009; 17:1062–9.
Article4. Correa-de-Araujo R, Addison O, Miljkovic I, Goodpaster BH, Bergman BC, Clark RV, et al. Myosteatosis in the context of skeletal muscle function deficit: an Interdisciplinary Workshop at the National Institute on Aging. Front Physiol. 2020; 11:963.
Article5. Altajar S, Baffy G. Skeletal muscle dysfunction in the development and progression of nonalcoholic fatty liver disease. J Clin Transl Hepatol. 2020; 8:414–23.
Article6. Goodpaster BH, Kelley DE, Thaete FL, He J, Ross R. Skeletal muscle attenuation determined by computed tomography is associated with skeletal muscle lipid content. J Appl Physiol (1985). 2000; 89:104–10.
Article7. Amini B, Boyle SP, Boutin RD, Lenchik L. Approaches to assessment of muscle mass and myosteatosis on computed tomography: a systematic review. J Gerontol A Biol Sci Med Sci. 2019; 74:1671–8.
Article8. Aubrey J, Esfandiari N, Baracos VE, Buteau FA, Frenette J, Putman CT, et al. Measurement of skeletal muscle radiation attenuation and basis of its biological variation. Acta Physiol (Oxf). 2014; 210:489–97.
Article9. Aleixo GF, Shachar SS, Nyrop KA, Muss HB, Malpica L, Williams GR. Myosteatosis and prognosis in cancer: systematic review and meta-analysis. Crit Rev Oncol Hematol. 2020; 145:102839.
Article10. Hicks GE, Simonsick EM, Harris TB, Newman AB, Weiner DK, Nevitt MA, et al. Cross-sectional associations between trunk muscle composition, back pain, and physical function in the health, aging and body composition study. J Gerontol A Biol Sci Med Sci. 2005; 60:882–7.
Article11. Hicks GE, Simonsick EM, Harris TB, Newman AB, Weiner DK, Nevitt MA, et al. Trunk muscle composition as a predictor of reduced functional capacity in the health, aging and body composition study: the moderating role of back pain. J Gerontol A Biol Sci Med Sci. 2005; 60:1420–4.
Article12. Goodpaster BH, Krishnaswami S, Resnick H, Kelley DE, Haggerty C, Harris TB, et al. Association between regional adipose tissue distribution and both type 2 diabetes and impaired glucose tolerance in elderly men and women. Diabetes Care. 2003; 26:372–9.
Article13. Goodpaster BH, Thaete FL, Kelley DE. Thigh adipose tissue distribution is associated with insulin resistance in obesity and in type 2 diabetes mellitus. Am J Clin Nutr. 2000; 71:885–92.
Article14. Goodpaster BH, Carlson CL, Visser M, Kelley DE, Scherzinger A, Harris TB, et al. Attenuation of skeletal muscle and strength in the elderly: the Health ABC Study. J Appl Physiol (1985). 2001; 90:2157–65.
Article15. Larsen B, Bellettiere J, Allison M, McClelland RL, Miljkovic I, Vella CA, et al. Muscle area and density and risk of allcause mortality: the Multi-Ethnic Study of Atherosclerosis. Metabolism. 2020; 111:154321.
Article16. Addison O, Marcus RL, Lastayo PC, Ryan AS. Intermuscular fat: a review of the consequences and causes. Int J Endocrinol. 2014; 2014:309570.
Article17. Brooks N, Cloutier GJ, Cadena SM, Layne JE, Nelsen CA, Freed AM, et al. Resistance training and timed essential amino acids protect against the loss of muscle mass and strength during 28 days of bed rest and energy deficit. J Appl Physiol (1985). 2008; 105:241–8.
Article18. Reinders I, Murphy RA, Brouwer IA, Visser M, Launer L, Siggeirsdottir K, et al. Muscle quality and myosteatosis: novel associations with mortality risk: the Age, Gene/Environment Susceptibility (AGES)-Reykjavik Study. Am J Epidemiol. 2016; 183:53–60.19. Ryan AS, Harduarsingh-Permaul AS. Effects of weight loss and exercise on trunk muscle composition in older women. Clin Interv Aging. 2014; 9:395–402.
Article20. Terry JG, Shay CM, Schreiner PJ, Jacobs DR Jr, Sanchez OA, Reis JP, et al. Intermuscular adipose tissue and subclinical coronary artery calcification in midlife: the CARDIA Study (Coronary Artery Risk Development in Young Adults). Arterioscler Thromb Vasc Biol. 2017; 37:2370–8.21. Hausman GJ, Basu U, Du M, Fernyhough-Culver M, Dodson MV. Intermuscular and intramuscular adipose tissues: bad vs. good adipose tissues. Adipocyte. 2014; 3:242–55.
Article22. Kim HK, Kim KW, Kim EH, Lee MJ, Bae SJ, Ko Y, et al. Age-related changes in muscle quality and development of diagnostic cutoff points for myosteatosis in lumbar skeletal muscles measured by CT scan. Clin Nutr. 2021; 40:4022–8.
Article23. Tuttle LJ, Sinacore DR, Mueller MJ. Intermuscular adipose tissue is muscle specific and associated with poor functional performance. J Aging Res. 2012; 2012:172957.
Article24. Goodpaster BH, Thaete FL, Kelley DE. Composition of skeletal muscle evaluated with computed tomography. Ann N Y Acad Sci. 2000; 904:18–24.
Article25. Mourtzakis M, Prado CM, Lieffers JR, Reiman T, McCargar LJ, Baracos VE. A practical and precise approach to quantification of body composition in cancer patients using computed tomography images acquired during routine care. Appl Physiol Nutr Metab. 2008; 33:997–1006.
Article26. van Dijk DP, Bakens MJ, Coolsen MM, Rensen SS, van Dam RM, Bours MJ, et al. Low skeletal muscle radiation attenuation and visceral adiposity are associated with overall survival and surgical site infections in patients with pancreatic cancer. J Cachexia Sarcopenia Muscle. 2017; 8:317–26.
Article27. Maltais A, Almeras N, Lemieux I, Tremblay A, Bergeron J, Poirier P, et al. Trunk muscle quality assessed by computed tomography: association with adiposity indices and glucose tolerance in men. Metabolism. 2018; 85:205–12.
Article28. Cuff DJ, Meneilly GS, Martin A, Ignaszewski A, Tildesley HD, Frohlich JJ. Effective exercise modality to reduce insulin resistance in women with type 2 diabetes. Diabetes Care. 2003; 26:2977–82.
Article29. Tanaka M, Okada H, Hashimoto Y, Kumagai M, Nishimura H, Oda Y, et al. Relationship between metabolic syndrome and trunk muscle quality as well as quantity evaluated by computed tomography. Clin Nutr. 2020; 39:1818–25.
Article30. Derstine BA, Holcombe SA, Goulson RL, Ross BE, Wang NC, Sullivan JA, et al. Quantifying sarcopenia reference values using lumbar and thoracic muscle areas in a healthy population. J Nutr Health Aging. 2017; 21:180–5.
Article31. van Vugt JL, Coebergh van den Braak RR, Schippers HJ, Veen KM, Levolger S, de Bruin RW, et al. Contrast-enhancement influences skeletal muscle density, but not skeletal muscle mass, measurements on computed tomography. Clin Nutr. 2018; 37:1707–14.
Article32. Szczepaniak LS, Babcock EE, Schick F, Dobbins RL, Garg A, Burns DK, et al. Measurement of intracellular triglyceride stores by H spectroscopy: validation in vivo. Am J Physiol. 1999; 276:E977–89.
Article33. Jacob S, Machann J, Rett K, Brechtel K, Volk A, Renn W, et al. Association of increased intramyocellular lipid content with insulin resistance in lean nondiabetic offspring of type 2 diabetic subjects. Diabetes. 1999; 48:1113–9.
Article34. Larson-Meyer DE, Smith SR, Heilbronn LK, Kelley DE, Ravussin E, Newcomer BR, et al. Muscle-associated triglyceride measured by computed tomography and magnetic resonance spectroscopy. Obesity (Silver Spring). 2006; 14:73–87.
Article35. Miljkovic I, Kuipers AL, Cauley JA, Prasad T, Lee CG, Ensrud KE, et al. Greater skeletal muscle fat infiltration is associated with higher all-cause and cardiovascular mortality in older men. J Gerontol A Biol Sci Med Sci. 2015; 70:1133–40.
Article36. Miljkovic I, Kuipers AL, Cvejkus R, Bunker CH, Patrick AL, Gordon CL, et al. Myosteatosis increases with aging and is associated with incident diabetes in African ancestry men. Obesity (Silver Spring). 2016; 24:476–82.
Article37. Harris-Love MO, Avila NA, Adams B, Zhou J, Seamon B, Ismail C, et al. The comparative associations of ultrasound and computed tomography estimates of muscle quality with physical performance and metabolic parameters in older men. J Clin Med. 2018; 7:340.
Article38. Clark RV, Walker AC, O’Connor-Semmes RL, Leonard MS, Miller RR, Stimpson SA, et al. Total body skeletal muscle mass: estimation by creatine (methyl-d3) dilution in humans. J Appl Physiol (1985). 2014; 116:1605–13.39. Cawthon PM, Orwoll ES, Peters KE, Ensrud KE, Cauley JA, Kado DM, et al. Strong relation between muscle mass determined by d3-creatine dilution, physical performance, and incidence of falls and mobility limitations in a prospective cohort of older men. J Gerontol A Biol Sci Med Sci. 2019; 74:844–52.
Article40. Orwoll ES, Peters KE, Hellerstein M, Cummings SR, Evans WJ, Cawthon PM. The importance of muscle versus fat mass in sarcopenic obesity: a re-evaluation using D3-creatine muscle mass versus DXA lean mass measurements. J Gerontol A Biol Sci Med Sci. 2020; 75:1362–8.
Article41. Song MY, Ruts E, Kim J, Janumala I, Heymsfield S, Gallagher D. Sarcopenia and increased adipose tissue infiltration of muscle in elderly African American women. Am J Clin Nutr. 2004; 79:874–80.
Article42. Delmonico MJ, Harris TB, Visser M, Park SW, Conroy MB, Velasquez-Mieyer P, et al. Longitudinal study of muscle strength, quality, and adipose tissue infiltration. Am J Clin Nutr. 2009; 90:1579–85.
Article43. Srikanthan P, Karlamangla AS. Relative muscle mass is inversely associated with insulin resistance and prediabetes: findings from the third National Health and Nutrition Examination Survey. J Clin Endocrinol Metab. 2011; 96:2898–903.
Article44. Kim TN, Park MS, Yang SJ, Yoo HJ, Kang HJ, Song W, et al. Body size phenotypes and low muscle mass: the Korean sarcopenic obesity study (KSOS). J Clin Endocrinol Metab. 2013; 98:811–7.
Article45. Brochu M, Tchernof A, Dionne IJ, Sites CK, Eltabbakh GH, Sims EA, et al. What are the physical characteristics associated with a normal metabolic profile despite a high level of obesity in postmenopausal women? J Clin Endocrinol Metab. 2001; 86:1020–5.
Article46. Karelis AD, Faraj M, Bastard JP, St-Pierre DH, Brochu M, Prud’homme D, et al. The metabolically healthy but obese individual presents a favorable inflammation profile. J Clin Endocrinol Metab. 2005; 90:4145–50.
Article47. Peppa M, Koliaki C, Papaefstathiou A, Garoflos E, Katsilambros N, Raptis SA, et al. Body composition determinants of metabolic phenotypes of obesity in nonobese and obese postmenopausal women. Obesity (Silver Spring). 2013; 21:1807–14.
Article48. Camhi SM, Katzmarzyk PT. Differences in body composition between metabolically healthy obese and metabolically abnormal obese adults. Int J Obes (Lond). 2014; 38:1142–5.
Article49. Estrella ML, Pirzada A, Durazo-Arvizu RA, Cai J, Giachello AL, Espinoza Gacinto R, et al. Correlates of and body composition measures associated with metabolically healthy obesity phenotype in hispanic/latino women and men: the Hispanic Community Health Study/Study of Latinos (HCHS/SOL). J Obes. 2019; 2019:1251456.
Article50. Kim HK, Lee MJ, Kim EH, Bae SJ, Kim KW, Kim CH. Comparison of muscle mass and quality between metabolically healthy and unhealthy phenotypes. Obesity (Silver Spring). 2021; 29:1375–86.
Article51. Granados A, Gebremariam A, Gidding SS, Terry JG, Carr JJ, Steffen LM, et al. Association of abdominal muscle composition with prediabetes and diabetes: the CARDIA study. Diabetes Obes Metab. 2019; 21:267–75.
Article52. Larsen BA, Wassel CL, Kritchevsky SB, Strotmeyer ES, Criqui MH, Kanaya AM, et al. Association of muscle mass, area, and strength with incident diabetes in older adults: the Health ABC Study. J Clin Endocrinol Metab. 2016; 101:1847–55.
Article53. Kim EH, Kim HK, Lee MJ, Bae SJ, Kim KW, Choe J. Association between type 2 diabetes and skeletal muscle quality assessed by abdominal computed tomography scan. Diabetes Metab Res Rev. 2021; e3513.
Article54. Srikanthan P, Horwich TB, Tseng CH. Relation of muscle mass and fat mass to cardiovascular disease mortality. Am J Cardiol. 2016; 117:1355–60.
Article55. Ko BJ, Chang Y, Jung HS, Yun KE, Kim CW, Park HS, et al. Relationship between low relative muscle mass and coronary artery calcification in healthy adults. Arterioscler Thromb Vasc Biol. 2016; 36:1016–21.
Article56. Crawford MA, Criqui MH, Forbang N, Unkart JT, Allison MA, Larsen BA. Associations of abdominal muscle area and density with coronary artery calcium volume and density: the multi-ethnic study of atherosclerosis. Metabolism. 2020; 107:154230.
Article57. Lee MJ, Kim HK, Kim EH, Bae SJ, Kim KW, Kim MJ, et al. Association between muscle quality measured by abdominal computed tomography and subclinical coronary atherosclerosis. Arterioscler Thromb Vasc Biol. 2021; 41:e128–40.
Article58. Sam S, Mazzone T. Adipose tissue changes in obesity and the impact on metabolic function. Transl Res. 2014; 164:284–92.
Article59. Linge J, Ekstedt M, Dahlqvist Leinhard O. Adverse muscle composition is linked to poor functional performance and metabolic comorbidities in NAFLD. JHEP Rep. 2020; 3:100197.
Article60. Nachit M, Kwanten WJ, Thissen JP, Op De Beeck B, Van Gaal L, Vonghia L, et al. Muscle fat content is strongly associated with NASH: a longitudinal study in patients with morbid obesity. J Hepatol. 2021; 75:292–301.
Article61. Miljkovic N, Lim JY, Miljkovic I, Frontera WR. Aging of skeletal muscle fibers. Ann Rehabil Med. 2015; 39:155–62.
Article62. Katzman W, Cawthon P, Hicks GE, Vittinghoff E, Shepherd J, Cauley JA, et al. Association of spinal muscle composition and prevalence of hyperkyphosis in healthy community-dwelling older men and women. J Gerontol A Biol Sci Med Sci. 2012; 67:191–5.
Article63. Aleixo GF, Williams GR, Nyrop KA, Muss HB, Shachar SS. Muscle composition and outcomes in patients with breast cancer: meta-analysis and systematic review. Breast Cancer Res Treat. 2019; 177:569–79.
Article64. Kroenke CH, Prado CM, Meyerhardt JA, Weltzien EK, Xiao J, Cespedes Feliciano EM, et al. Muscle radiodensity and mortality in patients with colorectal cancer. Cancer. 2018; 124:3008–15.
Article65. Despres JP. Body fat distribution and risk of cardiovascular disease: an update. Circulation. 2012; 126:1301–13.66. Lowell BB, Shulman GI. Mitochondrial dysfunction and type 2 diabetes. Science. 2005; 307:384–7.
Article67. Roden M. Muscle triglycerides and mitochondrial function: possible mechanisms for the development of type 2 diabetes. Int J Obes (Lond). 2005; 29 Suppl 2:S111–5.
Article68. Petersen KF, Shulman GI. Etiology of insulin resistance. Am J Med. 2006; 119(5 Suppl 1):S10–6.
Article69. Timmers S, Schrauwen P, de Vogel J. Muscular diacylglycerol metabolism and insulin resistance. Physiol Behav. 2008; 94:242–51.
Article70. Rodeheffer MS. Tipping the scale: muscle versus fat. Nat Cell Biol. 2010; 12:102–4.
Article71. Joe AW, Yi L, Natarajan A, Le Grand F, So L, Wang J, et al. Muscle injury activates resident fibro/adipogenic progenitors that facilitate myogenesis. Nat Cell Biol. 2010; 12:153–63.
Article72. Mathes S, Fahrner A, Ghoshdastider U, Rudiger HA, Leunig M, Wolfrum C, et al. FGF-2-dependent signaling activated in aged human skeletal muscle promotes intramuscular adipogenesis. Proc Natl Acad Sci U S A. 2021; 118:e2021013118.
Article73. Vettor R, Milan G, Franzin C, Sanna M, De Coppi P, Rizzuto R, et al. The origin of intermuscular adipose tissue and its pathophysiologicalm implications. Am J Physiol Endocrinol Metab. 2009; 297:E987–98.74. Lee DE, Kehlenbrink S, Lee H, Hawkins M, Yudkin JS. Getting the message across: mechanisms of physiological cross talk by adipose tissue. Am J Physiol Endocrinol Metab. 2009; 296:E1210–29.
Article75. Hodge BA, Wen Y, Riley LA, Zhang X, England JH, Harfmann BD, et al. The endogenous molecular clock orchestrates the temporal separation of substrate metabolism in skeletal muscle. Skelet Muscle. 2015; 5:17.
Article76. Gutierrez-Monreal MA, Harmsen JF, Schrauwen P, Esser KA. Ticking for metabolic health: the skeletal-muscle clocks. Obesity (Silver Spring). 2020; 28 Suppl 1:S46–54.77. Ramirez-Velez R, Ezzatvar Y, Izquierdo M, Garcia-Hermoso A. Effect of exercise on myosteatosis in adults: a systematic review and meta-analysis. J Appl Physiol (1985). 2021; 130:245–55.
Article78. Murphy JC, McDaniel JL, Mora K, Villareal DT, Fontana L, Weiss EP. Preferential reductions in intermuscular and visceral adipose tissue with exercise-induced weight loss compared with calorie restriction. J Appl Physiol (1985). 2012; 112:79–85.
Article79. Ikenaga M, Yamada Y, Kose Y, Morimura K, Higaki Y, Kiyonaga A, et al. Effects of a 12-week, short-interval, intermittent, low-intensity, slow-jogging program on skeletal muscle, fat infiltration, and fitness in older adults: randomized controlled trial. Eur J Appl Physiol. 2017; 117:7–15.
Article80. Avila JJ, Gutierres JA, Sheehy ME, Lofgren IE, Delmonico MJ. Effect of moderate intensity resistance training during weight loss on body composition and physical performance in overweight older adults. Eur J Appl Physiol. 2010; 109:517–25.
Article81. Goodpaster BH, Chomentowski P, Ward BK, Rossi A, Glynn NW, Delmonico MJ, et al. Effects of physical activity on strength and skeletal muscle fat infiltration in older adults: a randomized controlled trial. J Appl Physiol (1985). 2008; 105:1498–503.
Article82. Shea MK, Nicklas BJ, Marsh AP, Houston DK, Miller GD, Isom S, et al. The effect of pioglitazone and resistance training on body composition in older men and women undergoing hypocaloric weight loss. Obesity (Silver Spring). 2011; 19:1636–46.
Article83. Becker C, Lord SR, Studenski SA, Warden SJ, Fielding RA, Recknor CP, et al. Myostatin antibody (LY2495655) in older weak fallers: a proof-of-concept, randomised, phase 2 trial. Lancet Diabetes Endocrinol. 2015; 3:948–57.
Article84. Ng Tang Fui M, Prendergast LA, Dupuis P, Raval M, Strauss BJ, Zajac JD, et al. Effects of testosterone treatment on body fat and lean mass in obese men on a hypocaloric diet: a randomised controlled trial. BMC Med. 2016; 14:153.
Article
- Full Text Links
-
- Actions
-
Cited
- CITED
-
- Close
- Share
-
- Similar articles
-
- Clinical impact of myosteatosis in liver transplant recipients
- Assessment of Muscle Quantity, Quality and Function
- Computed Tomography-Derived Myosteatosis and Metabolic Disorders
- Prognostic Value of Sarcopenia and Myosteatosis in Patients with Resectable Pancreatic Ductal Adenocarcinoma
- Prognostic Value of Artificial Intelligence-Driven, Computed Tomography-Based, Volumetric Assessment of the Volume and Density of Muscle in Patients With Colon Cancer
