Animal and Plant Protein Intake and Socioeconomic Status in Young and Middle-Aged Korean Adults
- Affiliations
-
- 1Department of Family Medicine, Seoul Paik Hospital, Inje University College of Medicine, Seoul, Korea
- KMID: 2503936
- DOI: http://doi.org/10.15384/kjhp.2020.20.2.70
Abstract
- Background
Dietary intake is affected by socioeconomic status (SES). The aim of this study is to assess adequacy of protein intake, and to investigate the association between SES, in terms of household income and educational attainment, and protein intake according to the protein source i.e., plant or animal protein, in a nationally representative sample of young and middle-aged Korean adults.
Methods
We used cross-sectional data from 1,404 Koreans, aged between 19 and 64, who had participated in the 2016-2018 Korea National Health and Nutrition Examination Survey. One day (24-hour) recall data was used to estimate the daily total of animal and plant protein intake. Household income quartiles and educational attainment were assessed by trained interviewers.
Results
The proportion of protein intake adequacy, based on the Korean recommended nutrient intake (RNI; 0.91 g/kg/day), was 66.5% (0.8) for males and 58.2% (0.8) for females. After adjustment, household income quartiles were positively associated with animal protein intake with a marginal significance both in males (P=0.051) and females (P=0.080) and showed a marginal negative association with plant protein intake in males (P=0.050) and a marginal positive association in females (P=0.074). Educational attainment was positively associated with total protein (P=0.001), animal protein (P=0.003), and plant protein intake (P=0.002), only in females.
Conclusions
One out of three young and middle-aged Korean adults showed protein intake inadequacy. Socioeconomic status, measured by household income and educational attainment, was associated with protein intake in young and middle-aged Korean adults and the associations were more marked in females.
Keyword
Figure
-
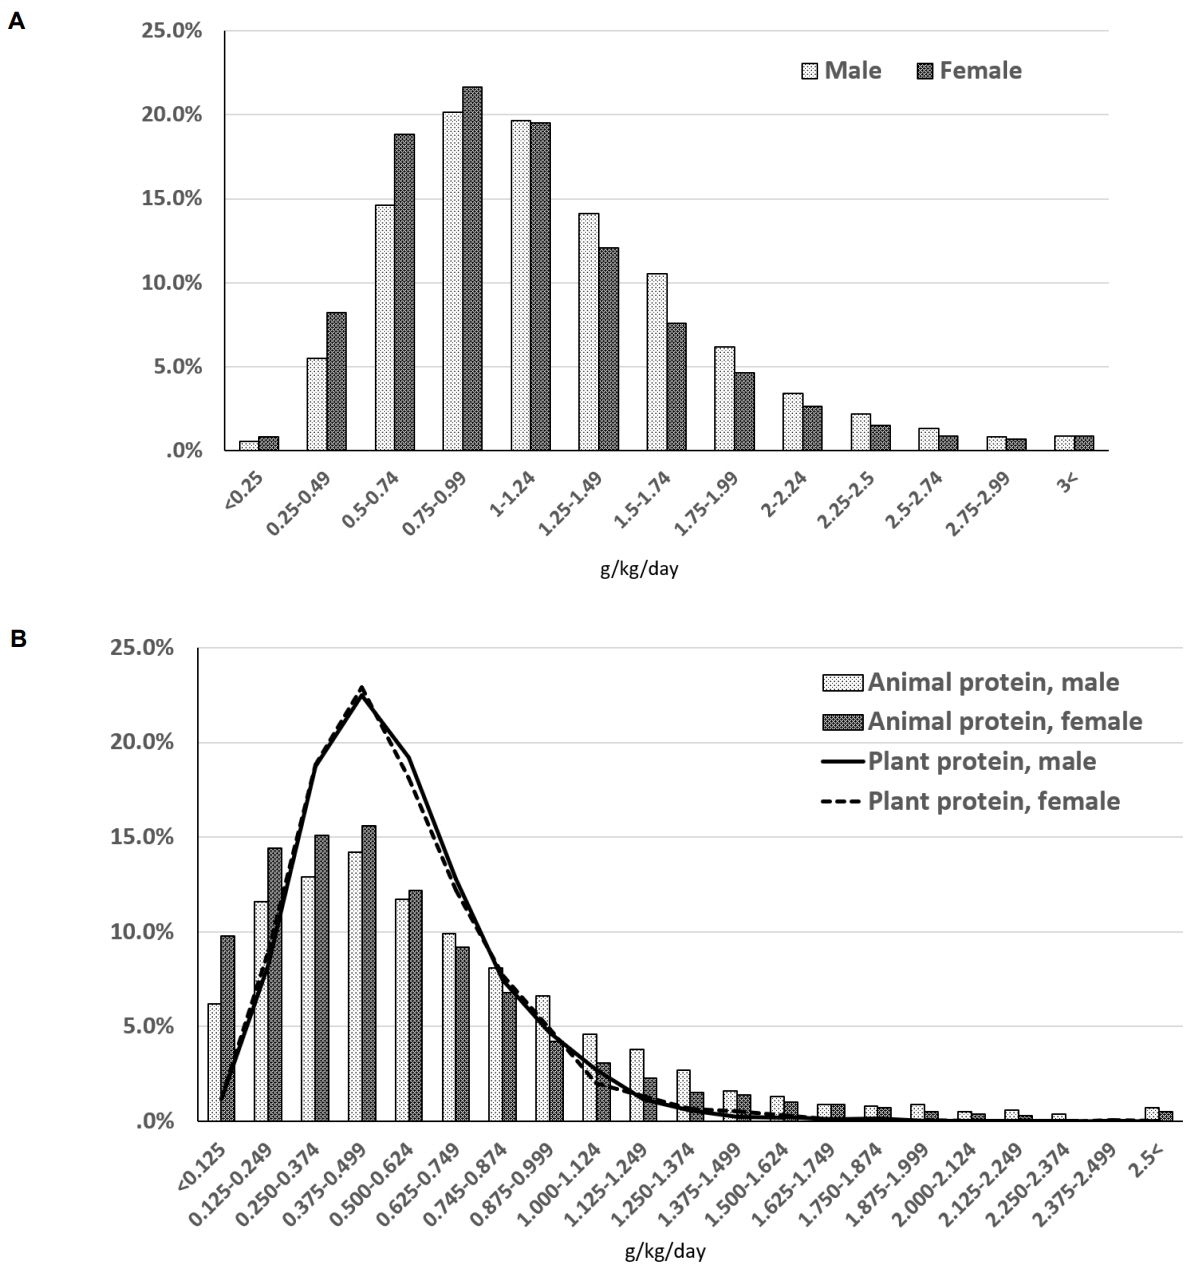
Fig. 1. Total animal and plant protein intake distribution of young and middle-aged Korean adults by sex. (A) Total protein, (B) animal and plant protein.

Fig. 2. (A) Male, (B) female. General linear modeling adjusted for age (continuous), current smoking status (yes or no), alcohol intake frequency per week (0, 1, and ≥2), locality of dwelling (rural or urban), marital status (married or single), having a job (yes or no), and total energy intake (kcal). Household income (lower, middle lower, middle upper, and upper) and educational attainment (≤9, 10-15, and ≥16) were adjusted each other.
Cited by 1 articles
-
Protein Intake by Korean Adults through Meals
Kyo Woon Kim, Hyun Ah Park, Young Gyu Cho, A Ra Bong
Korean J Health Promot. 2021;21(2):63-72. doi: 10.15384/kjhp.2021.21.2.63.
Reference
-
1. Si Hassen W, Castetbon K, Cardon P, Enaux C, Nicolaou M, Lien N, et al. Socioeconomic indicators are independently associated with nutrient intake in French adults: a DEDIPAC study. Nutrients. 2016; 8(3):158.
Article2. Livingstone KM, Olstad DL, Leech RM, Ball K, Meertens B, Potter J, et al. Socioeconomic inequities in diet quality and nutrient intakes among Australian adults: findings from a nationally representative cross-sectional study. Nutrients. 2017; 9(10):1092.
Article3. van Rossum CT, van de Mheen H, Witteman JC, Grobbee E, Mackenbach JP. Education and nutrient intake in Dutch elderly people. The Rotterdam Study. Eur J Clin Nutr. 2000; 54(2):159–65.
Article4. Mayén AL, Marques-Vidal P, Paccaud F, Bovet P, Stringhini S. Socioeconomic determinants of dietary patterns in low- and middle-income countries: a systematic review. Am J Clin Nutr. 2014; 100(6):1520–31.
Article5. Kwon DH, Park HA, Cho YG, Kim KW, Kim NH. Different associations of socioeconomic status on protein intake in the Korean elderly population: a cross-sectional analysis of the Korea National Health and Nutrition Examination Survey. Nutrients. 2019; 12(1):10.
Article6. Korea Centers for Disease Control and Prevention (KCDC). Korea Health Statistics 2018: Korea National Health and Nutrition Examination Survey (KNHANES VII-3) [Internet]. Cheongju: KCDC;2019. [Accessed Apr 6, 2020]. Available from: https://knhanes.cdc.go.kr/knhanes/main.do.7. Korea Nutriton Society. Dietary Rerefence Intakes for Koreans. 2015.8. Yanagi N, Hata A, Kondo K, Fujiwara T. Association between childhood socioeconomic status and fruit and vegetable intake among older Japanese: the JAGES 2010 study. Prev Med. 2018; 106:130–6.
Article9. Lee GS. Era of protein overconsumption - Males of 20s and 30s consume 1.8 times of required intake [Internet]. Seoul: Healthchosun.com;2015. [Accessed Apr 6, 2020]. Available from: http://health.chosun.com/site/data/html_dir/2015/03/10/2015031002682.html.10. Park HA. Adequacy of protein intake among Korean elderly: an analysis of the 2013-2014 Korea National Health and Nutrition Examination Survey Data. Korean J Fam Med. 2018; 39(2):130–4.
Article11. Song M, Fung TT, Hu FB, Willett WC, Longo VD, Chan AT, et al. Association of animal and plant protein intake with all-cause and cause-specific mortality. JAMA Intern Med. 2016; 176(10):1453–63.
Article12. Halkjaer J, Olsen A, Bjerregaard LJ, Deharveng G, Tjønneland A, Welch AA, et al. Intake of total, animal and plant proteins, and their food sources in 10 countries in the European Prospective Investigation into Cancer and Nutrition. Eur J Clin Nutr. 2009; 63 Suppl 4:S16–36.
Article13. Ryu HW. "Dose vegetarian diet cause any harm?"…Korean so ciety forcing to eat meat [Internet]. Seoul: Moneytoday;2019. [Accessed Apr 6, 2020]. Available from: https://news.mt.co.kr/mtview.php?no=2019040316142455144.14. Hernandez EM, Margolis R, Hummer RA. Educational and gender differences in health behavior changes after a gateway diagnosis. J Aging Health. 2018; 30(3):342–64.
Article15. Darmon N, Drewnowski A. Does social class predict diet quality? Am J Clin Nutr. 2008; 87(5):1107–17.
Article16. Liberatos P, Link BG, Kelsey JL. The measurement of social class in epidemiology. Epidemiol Rev. 1988; 10:87–121.
Article17. Daly MC, Duncan GJ, McDonough P, Williams DR. Optimal indicators of socioeconomic status for health research. Am J Public Health. 2002; 92(7):1151–7.
Article18. Galobardes B, Morabia A, Bernstein MS. Diet and socioeconomic position: does the use of different indicators matter? Int J Epidemiol. 2001; 30(2):334–40.
Article19. Alkerwi A, Vernier C, Sauvageot N, Crichton GE, Elias MF. Demographic and socioeconomic disparity in nutrition: application of a novel Correlated Component Regression approach. BMJ Open. 2015; 5(5):e006814.
Article20. Darmon N, Drewnowski A. Contribution of food prices and diet cost to socioeconomic disparities in diet quality and health: a systematic review and analysis. Nutr Rev. 2015; 73(10):643–60.
Article21. Krieger N, Chen JT, Selby JV. Comparing individual-based and household-based measures of social class to assess class inequalities in women's health: a methodological study of 684 US women. J Epidemiol Community Health. 1999; 53(10):612–23.
Article22. Willett WC. Nutritional Epidemioloty. 3rd ed. Oxford: Oxford University Press;;2012.23. Park HA. Rate of missing socioeconomic factors in the 4th KNHANES. Korean J Fam Med. 2012; 33(6):406–9.
Article
- Full Text Links
-
- Actions
-
Cited
- CITED
-
- Close
- Share
-
- Similar articles
-
- Protein Intake by Korean Adults through Meals
- Regional differences in protein intake and protein sources of Korean older adults and their association with metabolic syndrome using the 2016–2019 Korea National Health and Nutrition Examination Surveys: a cross-sectional study
- Association between plant protein intake and grip strength in Koreans aged 50 years or older: Korea National Health and Nutrition Examination Survey 2016–2018
- Association between dietary protein intake and overweight and obesity among Korean children and adolescents: data from the 2014–2019 Korea National Health and Nutrition Examination Survey
- Nutrient Intake and Related Factors in Middle-Aged Urban Adults
