Spiral scanning imaging and quantitative calculation of the 3-dimensional screw-shaped bone-implant interface on micro-computed tomography
- Affiliations
-
- 1Dental Research Institute, Seoul National University School of Dentistry, Seoul, Korea.
- 2Department of Field Refurbishment, Optoscan, Seoul, Korea.
- 3Department of Prosthodontics, Seoul National University School of Dentistry, Seoul, Korea. pros53@snu.ac.kr
- KMID: 2465386
- DOI: http://doi.org/10.5051/jpis.2018.48.4.202
Abstract
- PURPOSE
Bone-to-implant contact (BIC) is difficult to measure on micro-computed tomography (CT) because of artifacts that hinder accurate differentiation of the bone and implant. This study presents an advanced algorithm for measuring BIC in micro-CT acquisitions using a spiral scanning technique, with improved differentiation of bone and implant materials.
METHODS
Five sandblasted, large-grit, acid-etched implants were used. Three implants were subjected to surface analysis, and 2 were inserted into a New Zealand white rabbit, with each tibia receiving 1 implant. The rabbit was sacrificed after 28 days. The en bloc specimens were subjected to spiral (SkyScan 1275, Bruker) and round (SkyScan 1172, SkyScan 1275) micro-CT scanning to evaluate differences in the images resulting from the different scanning techniques. The partial volume effect (PVE) was optimized as much as possible. BIC was measured with both round and spiral scanning on the SkyScan 1275, and the results were compared.
RESULTS
Compared with the round micro-CT scanning, the spiral scanning showed much clearer images. In addition, the PVE was optimized, which allowed accurate BIC measurements to be made. Round scanning on the SkyScan 1275 resulted in higher BIC measurements than spiral scanning on the same machine; however, the higher measurements on round scanning were confirmed to be false, and were found to be the result of artifacts in the void, rather than bone.
CONCLUSIONS
The results of this study indicate that spiral scanning can reduce metal artifacts, thereby allowing clear differentiation of bone and implant. Moreover, the PVE, which is a factor that inevitably hinders accurate BIC measurements, was optimized through an advanced algorithm.
Keyword
Figure
-
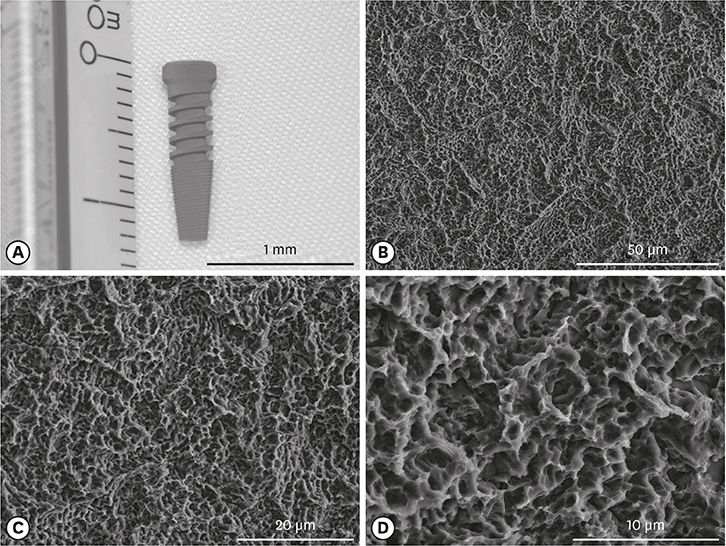
Figure 1 Design and surface characteristics of the specimen. (A) The design of the implant used in this study is shown. (B-D) These field emission scanning electron microscope images show the typical features of sandblasted, large-grit, acid-etched implant surfaces, which are rough with a honeycomb texture. The bars in (A-C), and (D) indicate lengths of 1.0 mm, 50.0 μm, 20.0 μm, and 10.0 μm, respectively.
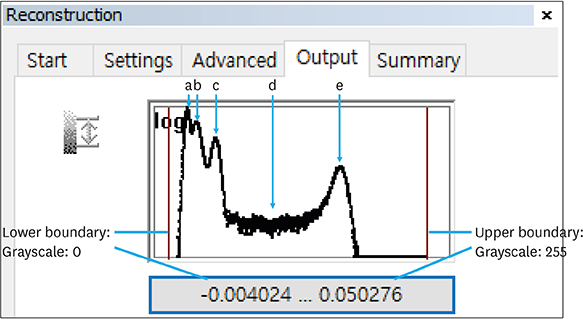
Figure 2 Contrast limit designation of the attenuation histogram. The left red line is the lower boundary, and the attenuation value of this line is set to 0. The right red line is the upper boundary, and the attenuation value of this line is set to 255. Each peak represents a dominant material in the histogram (a: air, b: soft tissue, c: bone, e: implant, d: partial volume effect). The placement of peaks is determined by the atomic number.

Figure 3 Sampling in the image process and partial volume averaging. Each voxel is assigned the mean gray value of its components, and the boundary pixels, which the object only partially occupies, do not have the same values as the circle or void, but instead have unique values. In (A), the real object area is πr2=1,962.5 µm2. In (B), with the thresholding limited to 255, the object area is 900 µm2. With thresholding ranges of 230–255, 200–255, and 40–255, the area becomes 1,300, 2,100, and 2,500 µm2, respectively. The values are approximated here.
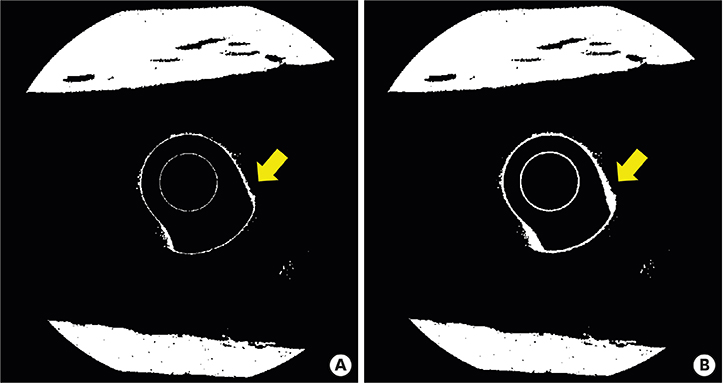
Figure 4 Thresholding for bone. The yellow arrow indicates the partial volume effect around the implant. (A) Contrast limit with a high degree of saturation. (B) Contrast limit with a low degree of saturation. While the bone region does not change, the partial volume region is thicker in (B).
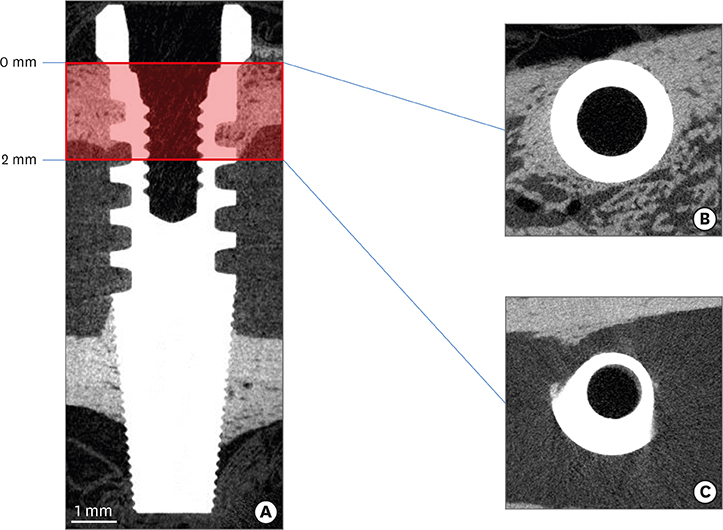
Figure 5 Height of interest. (A) The volume of interest height is designated by the red box. (B) The height begins from the point where the implant entirely interfaces with the bone. (C) The height ends where the implant no longer interfaces with bone.

Figure 6 Simplified schematic of the improved algorithm for measuring BIC in 2 dimensions. The optimized implant region includes not only the thresholded implant region, but also the partial volume region. The next layer of partial volume effect is the newly defined BIC layer. The ROI for the BIC layer is dilated 1 pixel from the optimized implant region (red shaded area, 7 pixel columns from the left). The ROI perimeter is the entire layer of the BIC layer, the interval demonstrated by the double-ended vertical black arrow. The intersection (BIC) perimeter is where the bone meets the BIC layer, the interval represented by the double-ended vertical blue arrow. The percent BIC is the ratio of the BIC perimeter and ROI perimeter. When the dilation radius of the ROI increases, the new BIC perimeter and percent BIC values of the different layers can be measured. BIC: bone-to-implant contact, ROI: region of interest, PVE: partial volume effect.
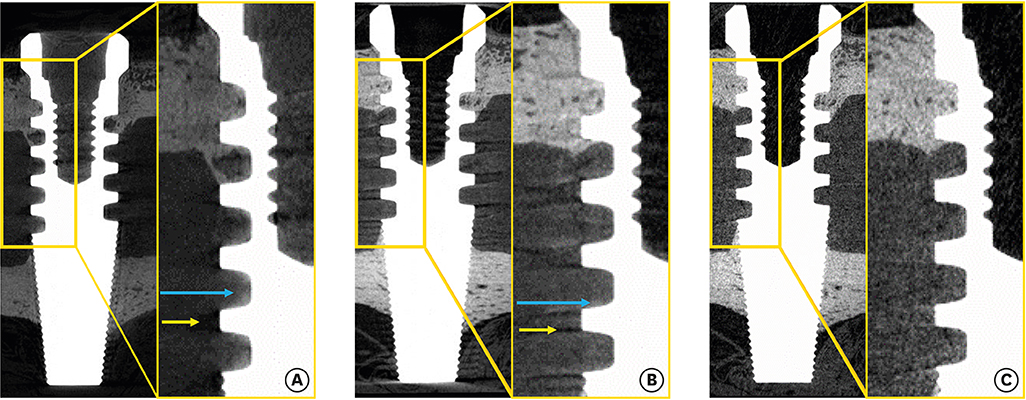
Figure 7 Comparison of coronal cross-section images. (A) Round scanning on SkyScan 1172. (B) Round scanning on SkyScan 1275. (C) Spiral scanning on SkyScan 1275. Blue arrow: halo, yellow arrow: shadow.

Figure 8 Artifacts depending on the scanning vectors. (A-C) Images taken from the round scan Skyscan 1275. Artifacts, including shadow (A), halo (B), and blur (C) are found. The shadow is darker than the neighbor pixels (A, orange arrow), while the halo is brighter than the neighbor pixels (B, blue arrow). The blur causes the imaged area to be processed as bone, which is eventually misinterpreted as bone contact (C, green arrows). (D-F) The thresholded images taken from the round scan show those artifacts more clearly. The shadow leaves black speckles that look like voids without bone, although actual bone exists (D, orange arrow). Conversely, the halo produces a false image of bone (E, blue arrow). The blur generates an incorrectly processed image with a thick white area that looks like bone (F, green arrows). (G-I) Images taken from spiral scan Skyscan 1275 are shown. The artifacts from the round scan are eliminated to disclose bone (G, orange arrowhead), just void (H, blue arrowhead), and no bone contact (I, green arrowheads). (J-L) The thresholded images from the spiral scan rectify those misinterpretations from the round scan: no void (J, orange arrowhead), no bone (K, blue arrowhead) and no bone contact (L, green arrowheads). The thin white line corresponds to the optimized partial volume effect pixels (red arrows), which were processed to be included as the implant in this study.

Figure 9 TPBIC in round and spiral scanning. The TPBIC on round scanning was higher than that on spiral scanning in all layers. TPBIC: total percent bone-to-implant contact, BIC: bone-to-implant contact.

Figure 10 Optimized views of the implant (gray) and BIC layer (red). (A) Round scanning. (B) Spiral scanning. BIC: bone-to-implant contact.
Cited by 1 articles
-
How do imaging protocols affect the assessment of root-end fillings?
Fernanda Ferrari Esteves Torres, Reinhilde Jacobs, Mostafa EzEldeen, Karla de Faria-Vasconcelos, Juliane Maria Guerreiro-Tanomaru, Bernardo Camargo dos Santos, Mário Tanomaru-Filho
Restor Dent Endod. 2021;47(1):e2. doi: 10.5395/rde.2022.47.e2.
Reference
-
1. Bernhardt R, Kuhlisch E, Schulz MC, Eckelt U, Stadlinger B. Comparison of bone-implant contact and bone-implant volume between 2D-histological sections and 3D-SRµCT slices. Eur Cell Mater. 2012; 23:237–247.
Article2. Bissinger O, Probst FA, Wolff KD, Jeschke A, Weitz J, Deppe H, et al. Comparative 3D micro-CT and 2D histomorphometry analysis of dental implant osseointegration in the maxilla of minipigs. J Clin Periodontol. 2017; 44:418–427.
Article3. Jimbo R, Coelho PG, Vandeweghe S, Schwartz-Filho HO, Hayashi M, Ono D, et al. Histological and three-dimensional evaluation of osseointegration to nanostructured calcium phosphate-coated implants. Acta Biomater. 2011; 7:4229–4234.
Article4. Vandeweghe S, Coelho PG, Vanhove C, Wennerberg A, Jimbo R. Utilizing micro-computed tomography to evaluate bone structure surrounding dental implants: a comparison with histomorphometry. J Biomed Mater Res B Appl Biomater. 2013; 101:1259–1266.
Article5. Becker K, Stauber M, Schwarz F, Beißbarth T. Automated 3D-2D registration of X-ray microcomputed tomography with histological sections for dental implants in bone using chamfer matching and simulated annealing. Comput Med Imaging Graph. 2015; 44:62–68.
Article6. Bernhardt R, Scharnweber D, Müller B, Thurner P, Schliephake H, Wyss P, et al. Comparison of microfocus- and synchrotron X-ray tomography for the analysis of osteointegration around Ti6Al4V implants. Eur Cell Mater. 2004; 7:42–51.
Article7. Park YS, Yi KY, Lee IS, Jung YC. Correlation between microtomography and histomorphometry for assessment of implant osseointegration. Clin Oral Implants Res. 2005; 16:156–160.
Article8. Barrett JF, Keat N. Artifacts in CT: recognition and avoidance. Radiographics. 2004; 24:1679–1691.
Article9. Li JY, Pow EH, Zheng LW, Ma L, Kwong DL, Cheung LK. Quantitative analysis of titanium-induced artifacts and correlated factors during micro-CT scanning. Clin Oral Implants Res. 2014; 25:506–510.
Article10. Narra N, Antalainen AK, Zipprich H, Sándor GK, Wolff J. Microcomputed tomography-based assessment of retrieved dental implants. Int J Oral Maxillofac Implants. 2015; 30:308–314.
Article11. Kilkenny C, Browne WJ, Cuthill IC, Emerson M, Altman DG. Improving bioscience research reporting: the ARRIVE guidelines for reporting animal research. Osteoarthritis Cartilage. 2012; 20:256–260.
Article12. Salmon P. Micro-CT image analysis techniques for orthopedic applications: metal implant-to-bone contact surface and porosity of biomaterials. In : Leung KS, Qin L, Cheung WH, editors. A practical manual for musculoskeletal research. Singapore: World Scientific;2008. p. 583–603.13. Rebaudi A, Koller B, Laib A, Trisi P. Microcomputed tomographic analysis of the peri-implant bone. Int J Periodontics Restorative Dent. 2004; 24:316–325.
- Full Text Links
-
- Actions
-
Cited
- CITED
-
- Close
- Share
-
- Similar articles
-
- Torque and mechanical failure of orthodontic micro-implant influenced by implant design parameters
- Three-dimensional imaging modalities in endodontics
- Micro-computed tomography for assessing the internal and external voids of bulk-fill composite restorations: A technical report
- THREE DIMENSIONAL FINITE ELEMENT ANALYSIS ON THE MINMUM CONTACT FRACTION OF BONE-IMPLANT INTERFACE
- Bone height measurements of implant sites: Comparison of panoramic radiography and spiral computed tomography
