Signs in Neuroradiology: A Pictorial Review
- Affiliations
-
- 1Department of Radiology, Akdeniz University Faculty of Medicine, Antalya, Turkey. alpoztek@gmail.com
- KMID: 2427209
- DOI: http://doi.org/10.3348/kjr.2017.18.6.992
Abstract
- One of the major problems radiologists face in everyday practice is to decide the correct diagnosis, or at least narrow down the list of possibilities. In this context, indicative evidences (signs) are useful to recognize pathologies, and also to narrow the list of differential diagnoses. Despite classically being described for a single disease, or a closely related family of disorders, most indications are not restricted exclusively to their traditional definition. Therefore, using signs for prognosis requires knowledge of the mechanism of their appearance, and which pathologies they are observed in. In this study, we demonstrate some of the more common and useful neuroradiologic signs with relevant images, and discuss their use in differential diagnosis.
Keyword
MeSH Terms
Figure
-

Fig. 1 Black hole sign. On this MRI T1WI, areas that are hypointense with respect to normal appearing white matter, are socalled “black holes” (arrow). T1WI = T1-weighted images

Fig. 2 Caput medusa sign. Coronal postcontrast MRI images demonstrate tubular converging towards common point in left cerebellar hemisphere (arrow). This appearance is characteristic of venous angiomas.

Fig. 3 Cloverleaf skull sign. Coronal CT image of infant with thanatophoric dysplasia shows trilobular cranium that looks like cloverleaf.

Fig. 4 Coca-Cola bottle sign. T1WI images of patient with Graves' ophthalmopathy demonstrates extraocular muscles having shape similar to Coca-Cola bottle (arrow), due to relative sparing of tendinous areas.

Fig. 5 Cord sign. Sagittal T1WI shows loss of flow void in cerebral vein, therefore appearing as hyperintensity (arrow).

Fig. 6 Cotton wool sign. Transverse CT image of patient with Paget's disease shows cotton wool appearance.

Fig. 7 Dawson fingers. Sagittal MRI FLAIR image of patient with MS shows hyperintensities perpendicular to corpus callosum (arrows), socalled Dawson fingers. FLAIR = fluid attenuated inversion recovery, MS = multiple sclerosis
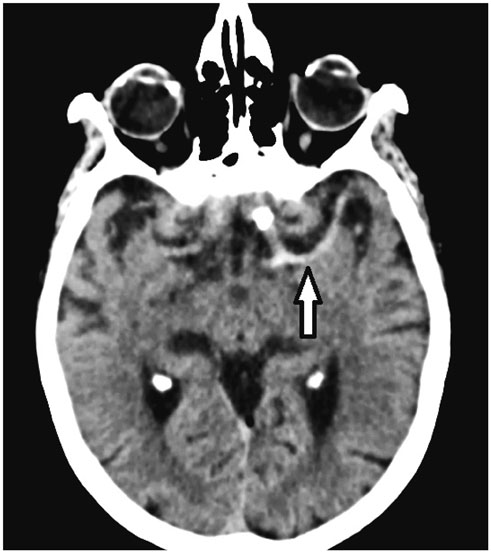
Fig. 8 Dense MCA sign. On transverse CT image, left MCA appears hyperdense due to thrombus (arrow). MCA = middle cerebral artery

Fig. 9 Dural tail. Transverse MRI image shows dural “tail” of lesion (arrow), classically considered feature of meningiomas.

Fig. 10 Eye of tiger sign. Coronal T2WI shows eye of tiger sign (arrows) in patient with Hallervorden-Spatz syndrome. T2WI = T2weighted images

Fig. 11 Figure of 8. Coronal T1WI of MRI shows pituitary macroadenoma resembling figure of 8 (or snowman) (arrow) due to indentation at diaphragma sellae.

Fig. 12 Ground-glass appearance. Coronal CT image demonstrates ground-glass appearance in right temporal bone (arrow). Patient had diagnosis of fibrous dysplasia.
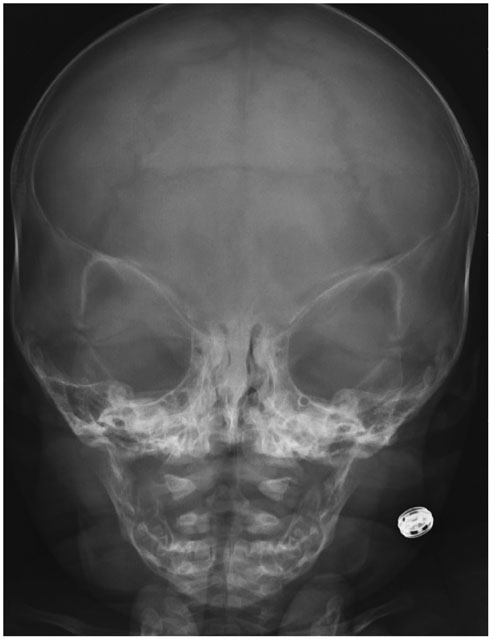
Fig. 13 Harlequin appearance. Head radiography shows uplifting of orbital roof with elevation of superolateral corner, so-called harlequin appearance.

Fig. 14 Horseshoe sign. In patient with MS, postcontrast MRI image demonstrates incomplete ring of enhancement, resembling horseshoe (arrow).

Fig. 15 Hot cross bun sign. T2WI shows cross shaped hyperintensity in pons (arrow). This patient had multiple system atrophy.

Fig. 16 Hot nose and empty skull. Tc99m-DTPA images show lack of activity inside cranium (“empty skull”) with increased activity in nasopharyngeal area due to increased flow via external carotid arteries (“hot nose”).

Fig. 17 Hummingbird sign. Mid-sagittal T1WI shows appearance similar to head and body of hummingbird (arrow), due to selective atrophy of tegmentum and relatively preserved pons.
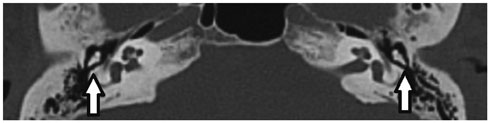
Fig. 18 Ice cream cone sign. Coronal CT image shows normal appearance of incus and malleus, resembling ice cream cone (arrows).

Fig. 19 Ivy sign. Transverse FLAIR images of patient with moyamoya disease, showing sulcal hyperintensities that cover brain like ivy (arrows).

Fig. 20 Lemon sign. In patient with Chiari II malformation, transverse view of fetal head during prenatal ultrasonographic examination shows bifrontal flattening, causing head to look like lemon.

Fig. 21 Molar tooth sign. Transverse T1WI of MRI demonstrates appearance resembling molar tooth with horizontal tubular structure originating from midbrain on both sides of midline (arrows). This was patient with Joubert syndrome.

Fig. 22 Onion bulb sign. Coronal T1WI of patient with diagnosis of Balo's concentric sclerosis, shows concentric isointense and hypointense rings that look like onion bulb (arrow).

Fig. 23 Popcorn sign. Transverse T1WI demonstrates well-defined lobulated lesion with central area of heterogeneous signal intensities (arrow). This appearance is typical for cavernous hemangiomas.

Fig. 24 Puff of smoke. Lateral digital subtraction angiography image of patient with moyamoya disease shows characteristic appearance of network of tiny intracranial collateral vessels resembling “puff of smoke.”

Fig. 25 Pulvinar sign. Pulvinar hyperintensities (arrows) on FLAIR images of patient with Fabry disease.

Fig. 26 Swirl sign. Transverse CT image demonstrates hypoattenuating areas in otherwise hyperdense epidural hematoma (arrow), corresponding to active hemorrhage.

Fig. 27 Target sign. Postcontrast transverse MRI image reveals target-like lesions (arrow) in patient with cerebral metastases of malignant melanoma.

Fig. 28 Tiger stripe pattern. Transverse FLAIR image shows alternating hyperintense and hypointense bands in tiger stripe pattern, in right cerebellar hemisphere (arrow).

Fig. 29 Tigroid pattern. Transverse T2WI shows hypointense lines in otherwise hyperintese periventricular white matter (arrows), characteristically seen in metachromatic leukodystrophy.

Fig. 30 White cerebellum sign Transverse CT image of infant shows “white cerebellum” that appears denser than cerebral parenchyma (arrow). This appearance has very poor prognosis.
Reference
-
1. Tam RC, Traboulsee A, Riddehough A, Li DK. Improving the clinical correlation of multiple sclerosis black hole volume change by paired-scan analysis. Neuroimage Clin. 2012; 1:29–36.2. Naismith RT, Xu J, Tutlam NT, Scully PT, Trinkaus K, Snyder AZ, et al. Increased diffusivity in acute multiple sclerosis lesions predicts risk of black hole. Neurology. 2010; 74:1694–1701.3. Saba PR. The caput medusae sign. Radiology. 1998; 207:599–600.4. Chen CP, Lin SP, Su YN, Huang JK, Wang W. A cloverleaf skull associated with Crouzon syndrome. Arch Dis Child Fetal Neonatal Ed. 2006; 91:F98.5. Bartalena L. Diagnosis and management of Graves disease: a global overview. Nat Rev Endocrinol. 2013; 9:724–734.6. Gonçalves AC, Gebrim EM, Monteiro ML. Imaging studies for diagnosing Graves’ orbitopathy and dysthyroid optic neuropathy. Clinics (Sao Paulo). 2012; 67:1327–1334.7. Nugent RA, Belkin RI, Neigel JM, Rootman J, Robertson WD, Spinelli J, et al. Graves orbitopathy: correlation of CT and clinical findings. Radiology. 1990; 177:675–682.8. Vijay RK. The cord sign. Radiology. 2006; 240:299–300.9. Lee EJ. The empty delta sign. Radiology. 2002; 224:788–789.10. Smith SE, Murphey MD, Motamedi K, Mulligan ME, Resnik CS, Gannon FH. From the archives of the AFIP. Radiologic spectrum of Paget disease of bone and its complications with pathologic correlation. Radiographics. 2002; 22:1191–1216.11. Matthews L, Marasco R, Jenkinson M, Küker W, Luppe S, Leite MI, et al. Distinction of seropositive NMO spectrum disorder and MS brain lesion distribution. Neurology. 2013; 80:1330–1337.12. Jensen-Kondering U, Riedel C, Jansen O. Hyperdense artery sign on computed tomography in acute ischemic stroke. World J Radiol. 2010; 2:354–357.13. Nakano S, Iseda T, Kawano H, Yoneyama T, Ikeda T, Wakisaka S. Correlation of early CT signs in the deep middle cerebral artery territories with angiographically confirmed site of arterial occlusion. AJNR Am J Neuroradiol. 2001; 22:654–659.14. Wallace EW. The dural tail sign. Radiology. 2004; 233:56–57.15. Bourekas EC, Wildenhain P, Lewin JS, Tarr RW, Dastur KJ, Raji MR, et al. The dural tail sign revisited. AJNR Am J Neuroradiol. 1995; 16:1514–1516.16. Detwiler PW, Henn JS, Porter RW, Lawton MT, White WL, Spetzler RF. Medulloblastoma presenting with tentorial “duraltail” sign: is the “dural-tail” sign specific for meningioma? Skull Base Surg. 1998; 8:233–236.17. Campero A, Ajler P, Martins C, Emmerich J, de Alencastro LF, Rhoton A Jr. Usefulness of the contralateral Omega sign for the topographic location of lesions in and around the central sulcus. Surg Neurol Int. 2011; 2:164.18. Suzuki K, Masawa N, Takatama M. Pathogenesis of état criblé in experimental hypertensive rats. J Stroke Cerebrovasc Dis. 2001; 10:106–112.19. Guillerman RP. The eye-of-the-tiger sign. Radiology. 2000; 217:895–896.20. Sabat SB, Deshmukh MP. Hallervorden Spatz disease. J Assoc Physicians India. 2006; 54:629.21. Han BK, Towbin RB, De Courten-Myers G, McLaurin RL, Ball WS Jr. Reversal sign on CT: effect of anoxic/ischemic cerebral injury in children. AJNR Am J Neuroradiol. 1989; 10:1191–1198.22. Brown EW, Megerian CA, McKenna MJ, Weber A. Fibrous dysplasia of the temporal bone: imaging findings. AJR Am J Roentgenol. 1995; 164:679–682.23. Chong VF, Khoo JB, Fan YF. Fibrous dysplasia involving the base of the skull. AJR Am J Roentgenol. 2002; 178:717–720.24. Benson ML, Oliverio PJ, Yue NC, Zinreich SJ. Primary craniosynostosis: imaging features. AJR Am J Roentgenol. 1996; 166:697–703.25. Osborn AG. Demyelinating and inflammatory diseases. In : Osborn AG, editor. Osborn's brain: imaging, pathology, and anatomy. 1st ed. Manitoba: Amirsys;2013. p. 405–442.26. Soares-Fernandes JP, Ribeiro M, Machado A. “Hot cross bun” sign in variant Creutzfeldt-Jakob disease. AJNR Am J Neuroradiol. 2009; 30:E37.27. Shrivastava A. The hot cross bun sign. Radiology. 2007; 245:606–607.28. Huang AH. The hot nose sign. Radiology. 2005; 235:216–217.29. Munari M, Zucchetta P, Carollo C, Gallo F, De Nardin M, Marzola MC, et al. Confirmatory tests in the diagnosis of brain death: comparison between SPECT and contrast angiography. Crit Care Med. 2005; 33:2068–2073.30. Itolikar SM, Salagre SB, Kalal CR. ‘Hummingbird sign,’ ‘penguin sign,’ and ‘Mickey mouse sign’ in progressive supranuclear palsy. J Assoc Physicians India. 2012; 60:52.31. Sonthalia N, Ray S. The hummingbird sign: a diagnostic clue for Steele-Richardson-Olszweski syndrome. BMJ Case Rep. 2012; 2012:bcr2012006263.32. Chavhan GB, Shroff MM. Twenty classic signs in neuroradiology: a pictorial essay. Indian J Radiol Imaging. 2009; 19:135–145.33. Meriot P, Veillon F, Garcia JF, Nonent M, Jezequel J, Bourjat P, et al. CT appearances of ossicular injuries. Radiographics. 1997; 17:1445–1454.34. Yoon HK, Shin HJ, Chang YW. “Ivy sign” in childhood moyamoya disease: depiction on FLAIR and contrast-enhanced T1-weighted MR images. Radiology. 2002; 223:384–389.35. Maeda M, Tsuchida C. “Ivy sign” on fluid-attenuated inversion-recovery images in childhood moyamoya disease. AJNR Am J Neuroradiol. 1999; 20:1836–1838.36. Thomas M. The lemon sign. Radiology. 2003; 228:206–207.37. McGraw P. The molar tooth sign. Radiology. 2003; 229:671–672.38. Pugash D, Oh T, Godwin K, Robinson AJ, Byrne A, Van Allen MI, et al. Sonographic ‘molar tooth’ sign in the diagnosis of Joubert syndrome. Ultrasound Obstet Gynecol. 2011; 38:598–602.39. Pisaneschi M, Kapoor G. Imaging the sella and parasellar region. Neuroimaging Clin N Am. 2005; 15:203–219.40. Hardy TA, Miller DH. Baló’s concentric sclerosis. Lancet Neurol. 2014; 13:740–746.41. Pohl D, Rostasy K, Krone B, Hanefeld F. Baló’s concentric sclerosis associated with primary human herpesvirus 6 infection. J Neurol Neurosurg Psychiatry. 2005; 76:1723–1725.42. Hegde AN, Mohan S, Lim CC. CNS cavernous haemangioma: “popcorn” in the brain and spinal cord. Clin Radiol. 2012; 67:380–388.43. Hegde A, Mohan S, Tan KK, Lim CC. Spinal cavernous malformations: magnetic resonance imaging and associated findings. Singapore Med J. 2012; 53:582–586.44. Ortiz-Neira CL. The puff of smoke sign. Radiology. 2008; 247:910–911.45. Burke GM, Burke AM, Sherma AK, Hurley MC, Batjer HH, Bendok BR. Moyamoya disease: a summary. Neurosurg Focus. 2009; 26:E11.46. Molloy S, O’Laoide R, Brett F, Farrell M. The “pulvinar” sign in variant Creutzfeldt-Jakob disease. AJR Am J Roentgenol. 2000; 175:555–556.47. Burlina AP, Manara R, Caillaud C, Laissy JP, Severino M, Klein I, et al. The pulvinar sign: frequency and clinical correlations in Fabry disease. J Neurol. 2008; 255:738–744.48. Krasnianski A, Schulz-Schaeffer WJ, Kallenberg K, Meissner B, Collie DA, Roeber S, et al. Clinical findings and diagnostic tests in the MV2 subtype of sporadic CJD. Brain. 2006; 129(Pt 9):2288–2296.49. Roche CJ, O’Keeffe DP, Lee WK, Duddalwar VA, Torreggiani WC, Curtis JM. Selections from the buffet of food signs in radiology. Radiographics. 2002; 22:1369–1384.50. Greenberg J, Cohen WA, Cooper PR. The “hyperacute” extraaxial intracranial hematoma: computed tomographic findings and clinical significance. Neurosurgery. 1985; 17:48–56.51. Al-Nakshabandi NA. The swirl sign. Radiology. 2001; 218:433.52. Nair P, Pal L, Jaiswal AK, Behari S. Lhermitte-Duclos disease associated with dysembryoplastic neuroepithelial tumor differentiation with characteristic magnetic resonance appearance of “tiger striping. ” World Neurosurg. 2011; 75:699–703.53. Moenninghoff C, Kraff O, Schlamann M, Ladd ME, Katsarava Z, Gizewski ER. Assessing a dysplastic cerebellar gangliocytoma (Lhermitte-Duclos disease) with 7T MR imaging. Korean J Radiol. 2010; 11:244–248.54. Douglas-Akinwande AC, Payner TD, Hattab EM. Medulloblastoma mimicking Lhermitte-Duclos disease on MRI and CT. Clin Neurol Neurosurg. 2009; 111:536–539.55. Cheon JE, Kim IO, Hwang YS, Kim KJ, Wang KC, Cho BK, et al. Leukodystrophy in children: a pictorial review of MR imaging features. Radiographics. 2002; 22:461–476.56. Onur MR, Senol U, Mihçi E, Lüleci E. Tigroid pattern on magnetic resonance imaging in Lowe syndrome. J Clin Neurosci. 2009; 16:112–114.57. Gonçalves FG, Barra FR, Matos VL, Jovem CL, Amaral LLF, del Carpio-O’Donovan R. Signs in neuroradiology: part 1. Radiol Bras. 2011; 44:123–128.
- Full Text Links
-
- Actions
-
Cited
- CITED
-
- Close
- Share
-
- Similar articles
-
- How to perform a functional assessment of the fetal heart: a pictorial review
- Pneumothorax, Pneumomediastinum and Pneumopericardium: A Pictorial Review
- Erratum: Susceptibility Vessel Sign in the ASTER Trial: Higher Recanalization Rate and More Favourable Clinical Outcome after First Line Stent Retriever Compared to Contact Aspiration
- Anesthetic Consideration for Neurointerventional Procedures
- Systemic Manifestations of Immunoglobulin G4-Related Disease: A Pictorial Essay
