Electrocardiogram Sampling Frequency Range Acceptable for Heart Rate Variability Analysis
- Affiliations
-
- 1Department of Emergency Medicine, Dong-A University Medical Center, Busan, Korea. advanced@lifesupport.pe.kr
- 2Department of Emergency Medicine, Dong-A University College of Medicine, Busan, Korea.
- 3Department of Emergency Medicine, Pusan National University Hospital, Busan, Korea.
- 4Department of Emergency Medicine, Graduate School, Kangwon National University School of Medicine, Chuncheon, Korea.
- KMID: 2418170
- DOI: http://doi.org/10.4258/hir.2018.24.3.198
Abstract
OBJECTIVES
Heart rate variability (HRV) has gained recognition as a noninvasive marker of autonomic activity. HRV is considered a promising tool in various clinical scenarios. The optimal electrocardiogram (ECG) sampling frequency required to ensure sufficient precision of R-R intervals for HRV analysis has not yet been determined. Here, we aimed to determine the acceptable ECG sampling frequency range by analyzing ECG signals from patients who visited an emergency department with the chief complaint of acute intoxication or overdose.
METHODS
The study included 83 adult patients who visited an emergency department with the chief complaint of acute poisoning. The original 1,000-Hz ECG signals were down-sampled to 500-, 250-, 100-, and 50-Hz sampling frequencies with linear interpolation. R-R interval data were analyzed for time-domain, frequency-domain, and nonlinear HRV parameters. Parameters derived from the data on down-sampled frequencies were compared with those derived from the data on 1,000-Hz signals, and Lin's concordance correlation coefficients were calculated.
RESULTS
Down-sampling to 500 or 250 Hz resulted in excellent concordance. Signals down-sampled to 100 Hz produced acceptable results for time-domain analysis and Poincaré plots, but not for frequency-domain analysis. Down-sampling to 50 Hz proved to be unacceptable for both time- and frequency-domain analyses. At 50 Hz, the root-mean-squared successive differences and the power of high frequency tended to have high values and random errors.
CONCLUSIONS
A 250-Hz sampling frequency would be acceptable for HRV analysis. When frequency-domain analysis is not required, a 100-Hz sampling frequency would also be acceptable.
Keyword
MeSH Terms
Figure
-
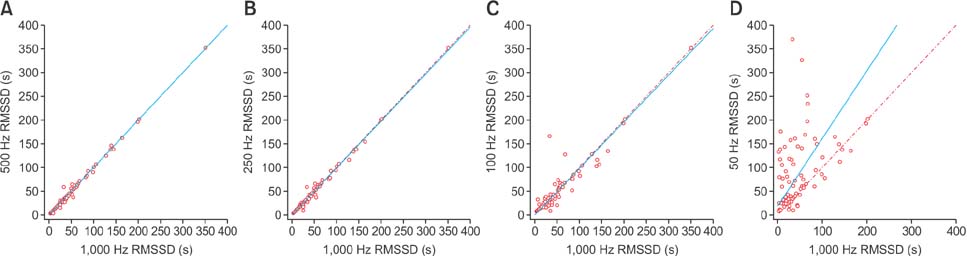
Figure 1 Scatterplot of the root-mean-squared successive differences (RMSSD) derived from down-sampled electrocardiography recordings in comparison with those from 1,000-Hz signals: (A) 500 Hz, (B) 250 Hz, (C) 100 Hz, and (D) 50 Hz. Lines of equity and regression lines are also displayed.
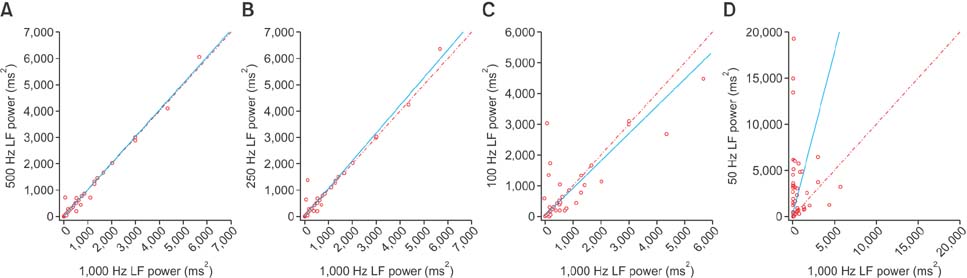
Figure 2 Scatterplot of the low-frequency (LF) power spectral density derived from down-sampled electrocardiography recordings in comparison with those from 1,000-Hz signals: (A) 500 Hz, (B) 250 Hz, (C) 100 Hz, and (D) 50 Hz. Lines of equity and regression lines are also displayed.
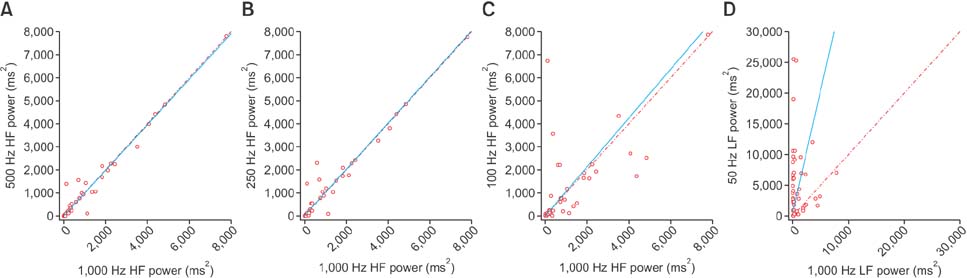
Figure 3 Scatterplot of the high-frequency (HF) power spectral density derived from down-sampled electrocardiography recordings in comparison with those from 1,000-Hz signals: (A) 500 Hz, (B) 250 Hz, (C) 100 Hz, and (D) 50 Hz. Lines of equity and regression lines are also displayed.

Figure 4 Bland-Altman plots of agreement between heart rate variability parameters from 100-Hz down-sampled signals and those from 1,000-Hz signals: (A) root-mean-squared successive differences (RMSSD), (B) proportion of NN50 to total number of R–R intervals (pNN50), (C) power of very low frequency (VLF), (D) power of low frequency (LF), (E) power of high frequency (HF), (F) Poincaré plot width, and (G) Poincaré plot length. Lines and values indicating 95% limits of agreement are presented.
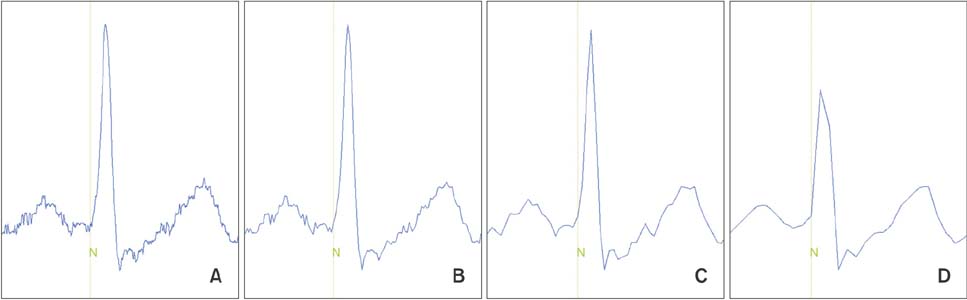
Figure 5 Electrocardiograms of single cardiac cycle and onset of QRS complexes detected by the gqrs command in Physio-Toolkit from various sampling frequencies. (A) 1,000 Hz, (B) 250 Hz, (C) 100 Hz, and (D) 50 Hz.
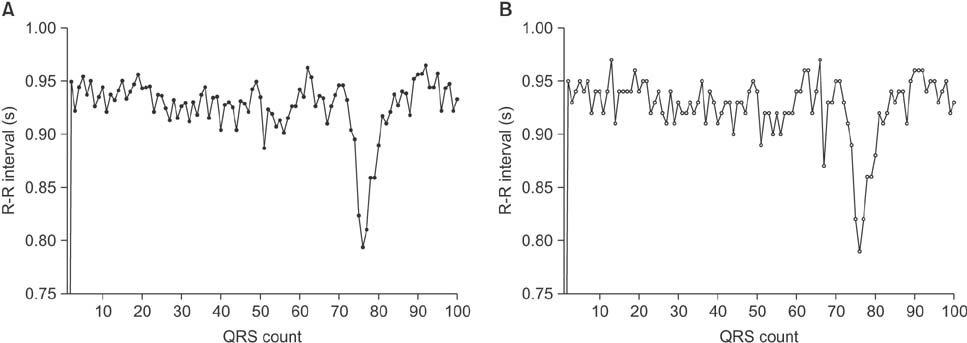
Figure 6 R–R interval series graph from electrocardiography recordings sampled at frequencies of (A) 1,000 Hz and (B) 50 Hz. Loss of detailed information of R–R intervals is noted.
Reference
-
1. Task Force of the European Society of Cardiology and the North American Society of Pacing and Electrophysiology. Heart rate variability: standards of measurement, physiological interpretation and clinical use. Circulation. 1996; 93(5):1043–1065.2. Proctor KG, Atapattu SA, Duncan RC. Heart rate variability index in trauma patients. J Trauma. 2007; 63(1):33–43.
Article3. Ong ME, Padmanabhan P, Chan YH, Lin Z, Overton J, Ward KR, et al. An observational, prospective study exploring the use of heart rate variability as a predictor of clinical outcomes in pre-hospital ambulance patients. Resuscitation. 2008; 78(3):289–297.
Article4. Liu T, Lin Z, Ong ME, Koh ZX, Pek PP, Yeo YK, et al. Manifold ranking based scoring system with its application to cardiac arrest prediction: a retrospective study in emergency department patients. Comput Biol Med. 2015; 67:74–82.
Article5. Dinleyici EC, Kilic Z, Sahin S, Tutuncu-Toker R, Eren M, Yargic ZA, et al. Heart rate variability in children with tricyclic antidepressant intoxication. Cardiol Res Pract. 2013; 2013:196506.
Article6. Jeong J, Kim Y. Heart rate variability analysis in acute poisoning by cholinesterase inhibitors. Signa Vitae. 2017; 13(2):33–40.
Article7. Bolanos M, Nazeran H, Haltiwanger E. Comparison of heart rate variability signal features derived from electrocardiography and photoplethysmography in healthy individuals. Conf Proc IEEE Eng Med Biol Soc. 2006; 1:4289–4294.
Article8. Ziemssen T, Gasch J, Ruediger H. Influence of ECG sampling frequency on spectral analysis of RR intervals and baroreflex sensitivity using the EUROBAVAR data set. J Clin Monit Comput. 2008; 22(2):159–168.
Article9. Mahdiani S, Jeyhani V, Peltokangas M, Vehkaoja A. Is 50 Hz high enough ECG sampling frequency for accurate HRV analysis? Conf Proc IEEE Eng Med Biol Soc. 2015; 2015:5948–5951.
Article10. Mohebbi M, Ghassemian H. Prediction of paroxysmal atrial fibrillation based on non-linear analysis and spectrum and bispectrum features of the heart rate variability signal. Comput Methods Programs Biomed. 2012; 105(1):40–49.
Article11. Goldberger AL, Amaral LA, Glass L, Hausdorff JM, Ivanov PC, Mark RG, et al. PhysioBank, PhysioToolkit, and PhysioNet: components of a new research resource for complex physiologic signals. Circulation. 2000; 101(23):E215–E220.12. Tarvainen MP, Niskanen JP, Lipponen JA, Ranta-Aho PO, Karjalainen PA. Kubios HRV: heart rate variability analysis software. Comput Methods Programs Biomed. 2014; 113(1):210–220.13. Lin LI. A concordance correlation coefficient to evaluate reproducibility. Biometrics. 1989; 45(1):255–268.
Article14. Lawrence I, Lin K. Assay validation using the concordance correlation coefficient. Biometrics. 1992; 48(2):599–604.
Article15. Ellis RJ, Zhu B, Koenig J, Thayer JF, Wang Y. A careful look at ECG sampling frequency and R-peak interpolation on short-term measures of heart rate variability. Physiol Meas. 2015; 36(9):1827–1852.
Article16. Brennan M, Palaniswami M, Kamen P. Poincaré plot interpretation using a physiological model of HRV based on a network of oscillators. Am J Physiol Heart Circ Physiol. 2002; 283(5):H1873–H1886.17. Bland JM, Altman DG. Statistical methods for assessing agreement between two methods of clinical measurement. Lancet. 1986; 1(8476):307–310.
Article18. Krouwer JS. Why Bland-Altman plots should use X, not (Y+X)/2 when X is a reference method. Stat Med. 2008; 27(5):778–780.19. Vest AN, Li Q, Liu C, Nemati S, Shah A, Clifford GD. Benchmarking heart rate variability toolboxes. J Electrocardiol. 2017; 50(6):744–747.
Article20. Llamedo M, Martinez JP. QRS detectors performance comparison in public databases. In : 2014 Computing in Cardiology Conference (CinC); 2014 Sep 7–10; Cambridge, MA. p. 357–360.
Article21. Martel ML, Klein LR, Lichtenheld AJ, Kerandi AM, Driver BE, Cole JB. Etiologies of altered mental status in patients with presumed ethanol intoxication. Am J Emerg Med. 2018; 36(6):1057–1059.
Article
- Full Text Links
-
- Actions
-
Cited
- CITED
-
- Close
- Share
-
- Similar articles
-
- Heart Rate Variability and the Efficacy of Biofeedback in Heroin Users with Depressive Symptoms
- Assessing Methods of Heart Rate Variability
- A Comparative Analysis of Heart Rate Variability of Electrocardiogram and Pulse-wave Using Time Series
- Determinants of Heart Rate Variability in General Korean Population
- Extraction of Parameters for the Depth of Anesthesia Using Frequency Analysis Method
