Korean J Ophthalmol.
2015 Jun;29(3):185-189. 10.3341/kjo.2015.29.3.185.
The Parameters of Pattern Visual Evoked Potential in the Severe Visual Loss Patients in Korean
- Affiliations
-
- 1Department of Ophthalmology, Kim's Eye Hospital, Seoul, Korea. ungsookim@kimeye.com
- 2Department of Ophthalmology, Konyang University College of Medicine, Daejeon, Korea.
- KMID: 2363757
- DOI: http://doi.org/10.3341/kjo.2015.29.3.185
Abstract
- PURPOSE
To compare the characteristics of the pattern visual evoked potential (PVEP) in patients with severe visual loss and normal controls, and to demonstrate the range of PVEP parameters in normal Koreans.
METHODS
The patients were divided into three groups according to visual acuity: group 1, ranging from no light perception to less than 0.02; group 2, ranging from 0.02 to 0.1; and group 3, ranging from 0.125 to 0.25. Group 4 was established as a healthy control group. The 95% confidence intervals (CIs) of the PVEP parameters were calculated for group 4. The PVEP parameters were compared among these four groups, and the amplitudes were evaluated with respect to the 95% CIs. We used the area under the curve to integrate the sensitivity and the specificity of the PVEP parameter quantitative values (7.01 to 9.57 microV and 6.75 to 10.11 microV).
RESULTS
A total of 101 eyes were investigated. The 95% CIs of the P100 and N135 amplitudes of group 4 were 7.01 to 9.57 microV and 6.75 to 10.11 microV, respectively. The amplitudes of P100 and N135 were significantly higher in group 4 (p < 0.001). The P100 and N135 amplitude were below the 95% CI in all group 1 patients. The area under the curve of the P100 amplitude was the highest (0.789).
CONCLUSIONS
No legally blind patient in the present study exhibited a value within the 95% CI of the controls. The P100 amplitude may be the best parameter for defining blindness in patients.
MeSH Terms
Figure
-
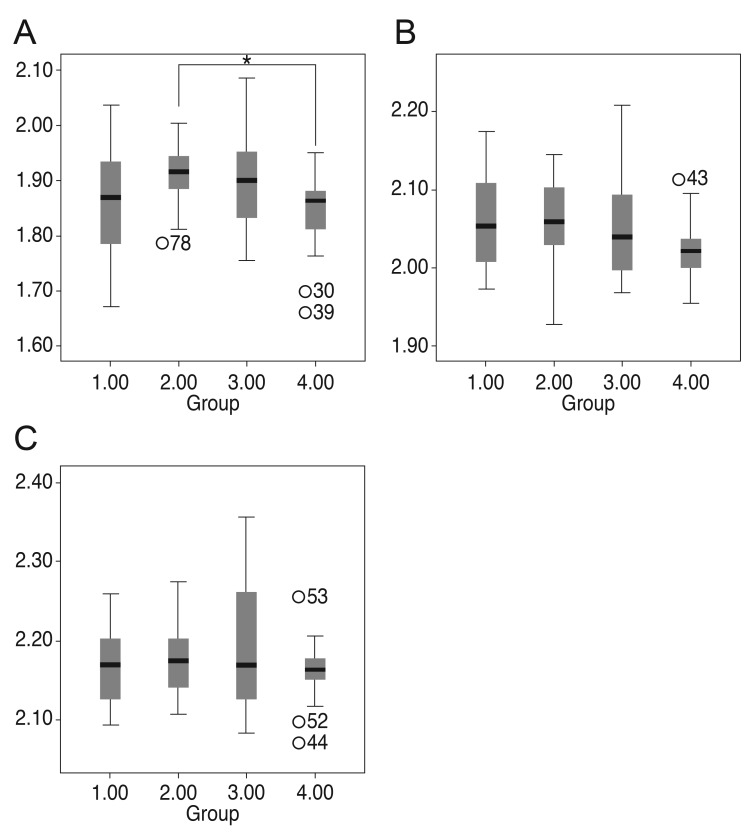
Fig. 1 The latencies of N75, P100, and N135 in the four groups. (A) N75 latency (p = 0.026, *post-hoc analysis, p = 0.044), (B) P100 latency (p = 0.039), and (C) N135 latency (p = 0.386).
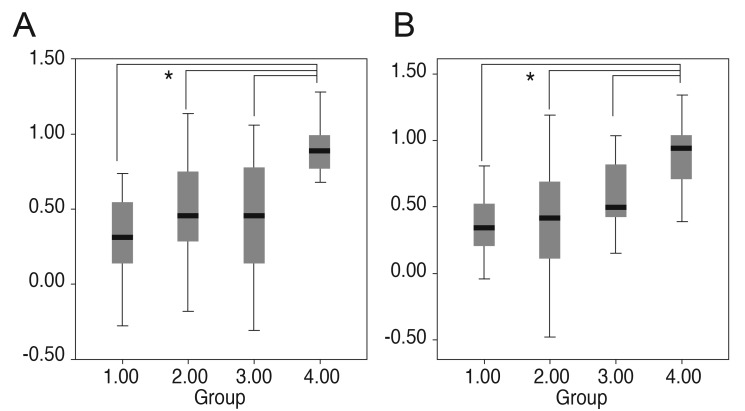
Fig. 2 The amplitudes of P100 and N135 in the four groups. (A) P100 latency (p < 0.001, *post-hoc analysis, group 4 vs. the other three groups, p < 0.001) and (B) N135 amplitude (p < 0.001, *posthoc analysis, group 4 vs. the other three groups, p < 0.001).
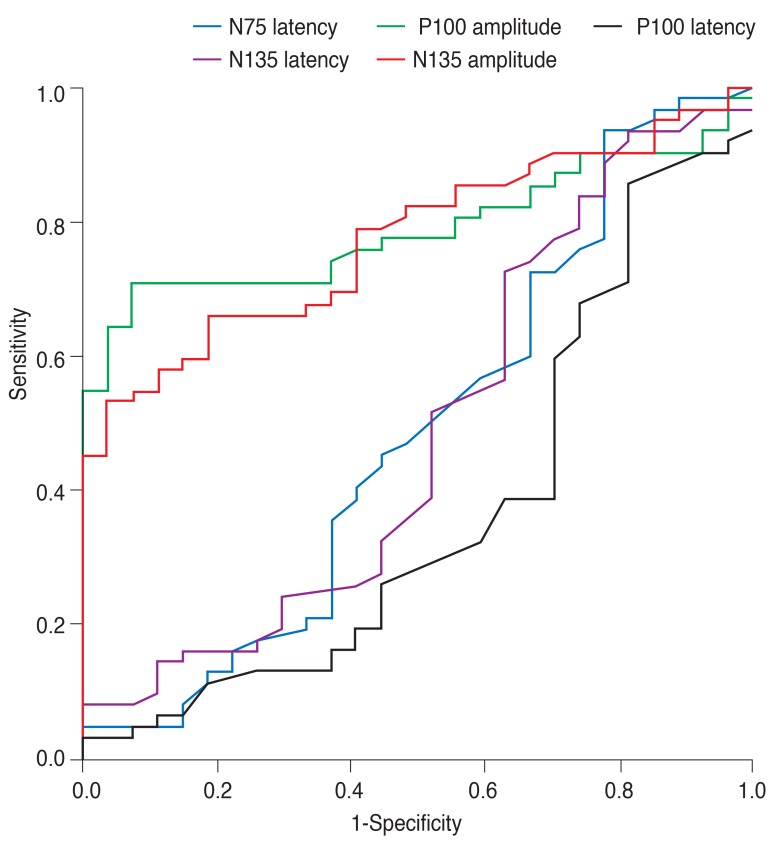
Fig. 3 The receiver operating characteristic curve of the parameters in group 1.
Reference
-
1. Bach M, Maurer JP, Wolf ME. Visual evoked potential-based acuity assessment in normal vision, artificially degraded vision, and in patients. Br J Ophthalmol. 2008; 92:396–403. PMID: 18303162.
Article2. Pararajasegaram R. VISION 2020-the right to sight: from strategies to action. Am J Ophthalmol. 1999; 128:359–360. PMID: 10511033.3. Gundogan FC, Sobaci G, Bayer A. Pattern visual evoked potentials in the assessment of visual acuity in malingering. Ophthalmology. 2007; 114:2332–2337. PMID: 17618689.
Article4. Odom JV, Bach M, Brigell M, et al. ISCEV standard for clinical visual evoked potentials (2009 update). Doc Ophthalmol. 2010; 120:111–119. PMID: 19826847.
Article5. Hyon JY, Yeo HE, Seo JM, et al. Objective measurement of distance visual acuity determined by computerized optokinetic nystagmus test. Invest Ophthalmol Vis Sci. 2010; 51:752–757. PMID: 19834033.
Article6. Arai M, Katsumi O, Paranhos FR, et al. Comparison of Snellen acuity and objective assessment using the spatial frequency sweep PVER. Graefes Arch Clin Exp Ophthalmol. 1997; 235:442–447. PMID: 9248841.
Article7. Ridder WH 3rd, Tong A, Floresca T. Reliability of acuities determined with the sweep visual evoked potential (sVEP). Doc Ophthalmol. 2012; 124:99–107. PMID: 22262233.
Article8. Kurtenbach A, Langrova H, Messias A, et al. A comparison of the performance of three visual evoked potential-based methods to estimate visual acuity. Doc Ophthalmol. 2013; 126:45–56. PMID: 23143759.
Article9. Towle VL, Harter MR. Objective determination of human visual acuity: pattern evoked potentials. Invest Ophthalmol Vis Sci. 1977; 16:1073–1076. PMID: 914482.10. Prager TC, Zou YL, Jensen CL, et al. Evaluation of methods for assessing visual function of infants. J AAPOS. 1999; 3:275–282. PMID: 10532572.
Article11. Pojda-Wilczek D. Retrospective analysis of pattern VEP results in different ocular and systemic diseases. Klin Oczna. 2010; 112:205–209. PMID: 21117363.12. Atilla H, Tekeli O, Ornek K, et al. Pattern electroretinography and visual evoked potentials in optic nerve diseases. J Clin Neurosci. 2006; 13:55–59. PMID: 16410198.
Article13. Holder GE. Electrophysiological assessment of optic nerve disease. Eye (Lond). 2004; 18:1133–1143. PMID: 15534599.
Article14. Weinstein GW, Odom JV, Cavender S. Visually evoked potentials and electroretinography in neurologic evaluation. Neurol Clin. 1991; 9:225–242. PMID: 1849226.
Article15. Heckenlively JR, Arden GB. Principles and practive of clinical electrophysiology of vision. 2nd ed. Cambrige: Massachusetts Institute of Technology;2006. p. 637–647.16. Perlman I, Segev E, Mazawi N, et al. Visual evoked cortical potential can be used to differentiate between uncorrected refractive error and macular disorders. Doc Ophthalmol. 2001; 102:41–62. PMID: 11475365.17. Kang MS, Kyung SE. Clinical features of ocular disabilities. J Korean Ophthalmol Soc. 2010; 51:95–105.
Article
- Full Text Links
-
- Actions
-
Cited
- CITED
-
- Close
- Share
-
- Similar articles
-
- The Effectiveness of Visual Evoked Potentials in Disability Evaluation
- The Effects of Intravenous Anesthetics on Visual Evoked Potentials in Cats
- Visual Evoked Potentials for Detecting Visual Pathway Abnormality
- A Case of Anterior Ischemic Optic Neuropathy
- Visual Evoked Potential Study in Amblyopia and Normal Groups
