A Study for Effective Gaze Fixation Induction Methods in PC-Based Visual Field Testing
- Affiliations
-
- 1Department of Industrial and Management Engineering, POSTECH, Pohang, Korea.
- 2Department of Creative IT Excellence Engineering, POSTECH, Pohang, Korea.
- 3Department of Ophthalmology, Kyung Hee University Hospital at Gangdong, Kyung Hee University College of Medicine, Seoul, Korea. kjh0614@khu.ac.kr
Abstract
- PURPOSE
The present study explored novel methods in visual field tests that actively induce the gaze of the examinee to the fixation target in the center vision and compared their effectiveness.
METHODS
Four gaze induction methods (dot-on, dot-off, number-on, and number-off) were prepared by combining 2 types of fixation targets (dot and number) and 2 conditions of sound presence (on and off). The gaze induction methods were implemented to a PC-based visual field testing system and the 24-2 visual field testing protocol was administered to 14 participants without glaucoma. The performance of the gaze induction method was evaluated in terms of fixation error rate, target detection rate, and subjective satisfaction (7-point scale, 1 for least satisfied and 7 for most satisfied).
RESULTS
The fixation error rates of dot-on (5.7%) and number-on (6.4%) were relatively lower than the other methods; the target detection rates of the induction methods were very high (95-96%) without significant differences, and the subjective satisfaction levels of dot-on (5.7) and number-on (5.4) were significantly higher than the other methods.
CONCLUSIONS
In the present study we determined number-on as the preferred effective gaze induction method compared to the conventional dot-off method when fixation error rates and subjective satisfaction were considered.
Keyword
Figure
-
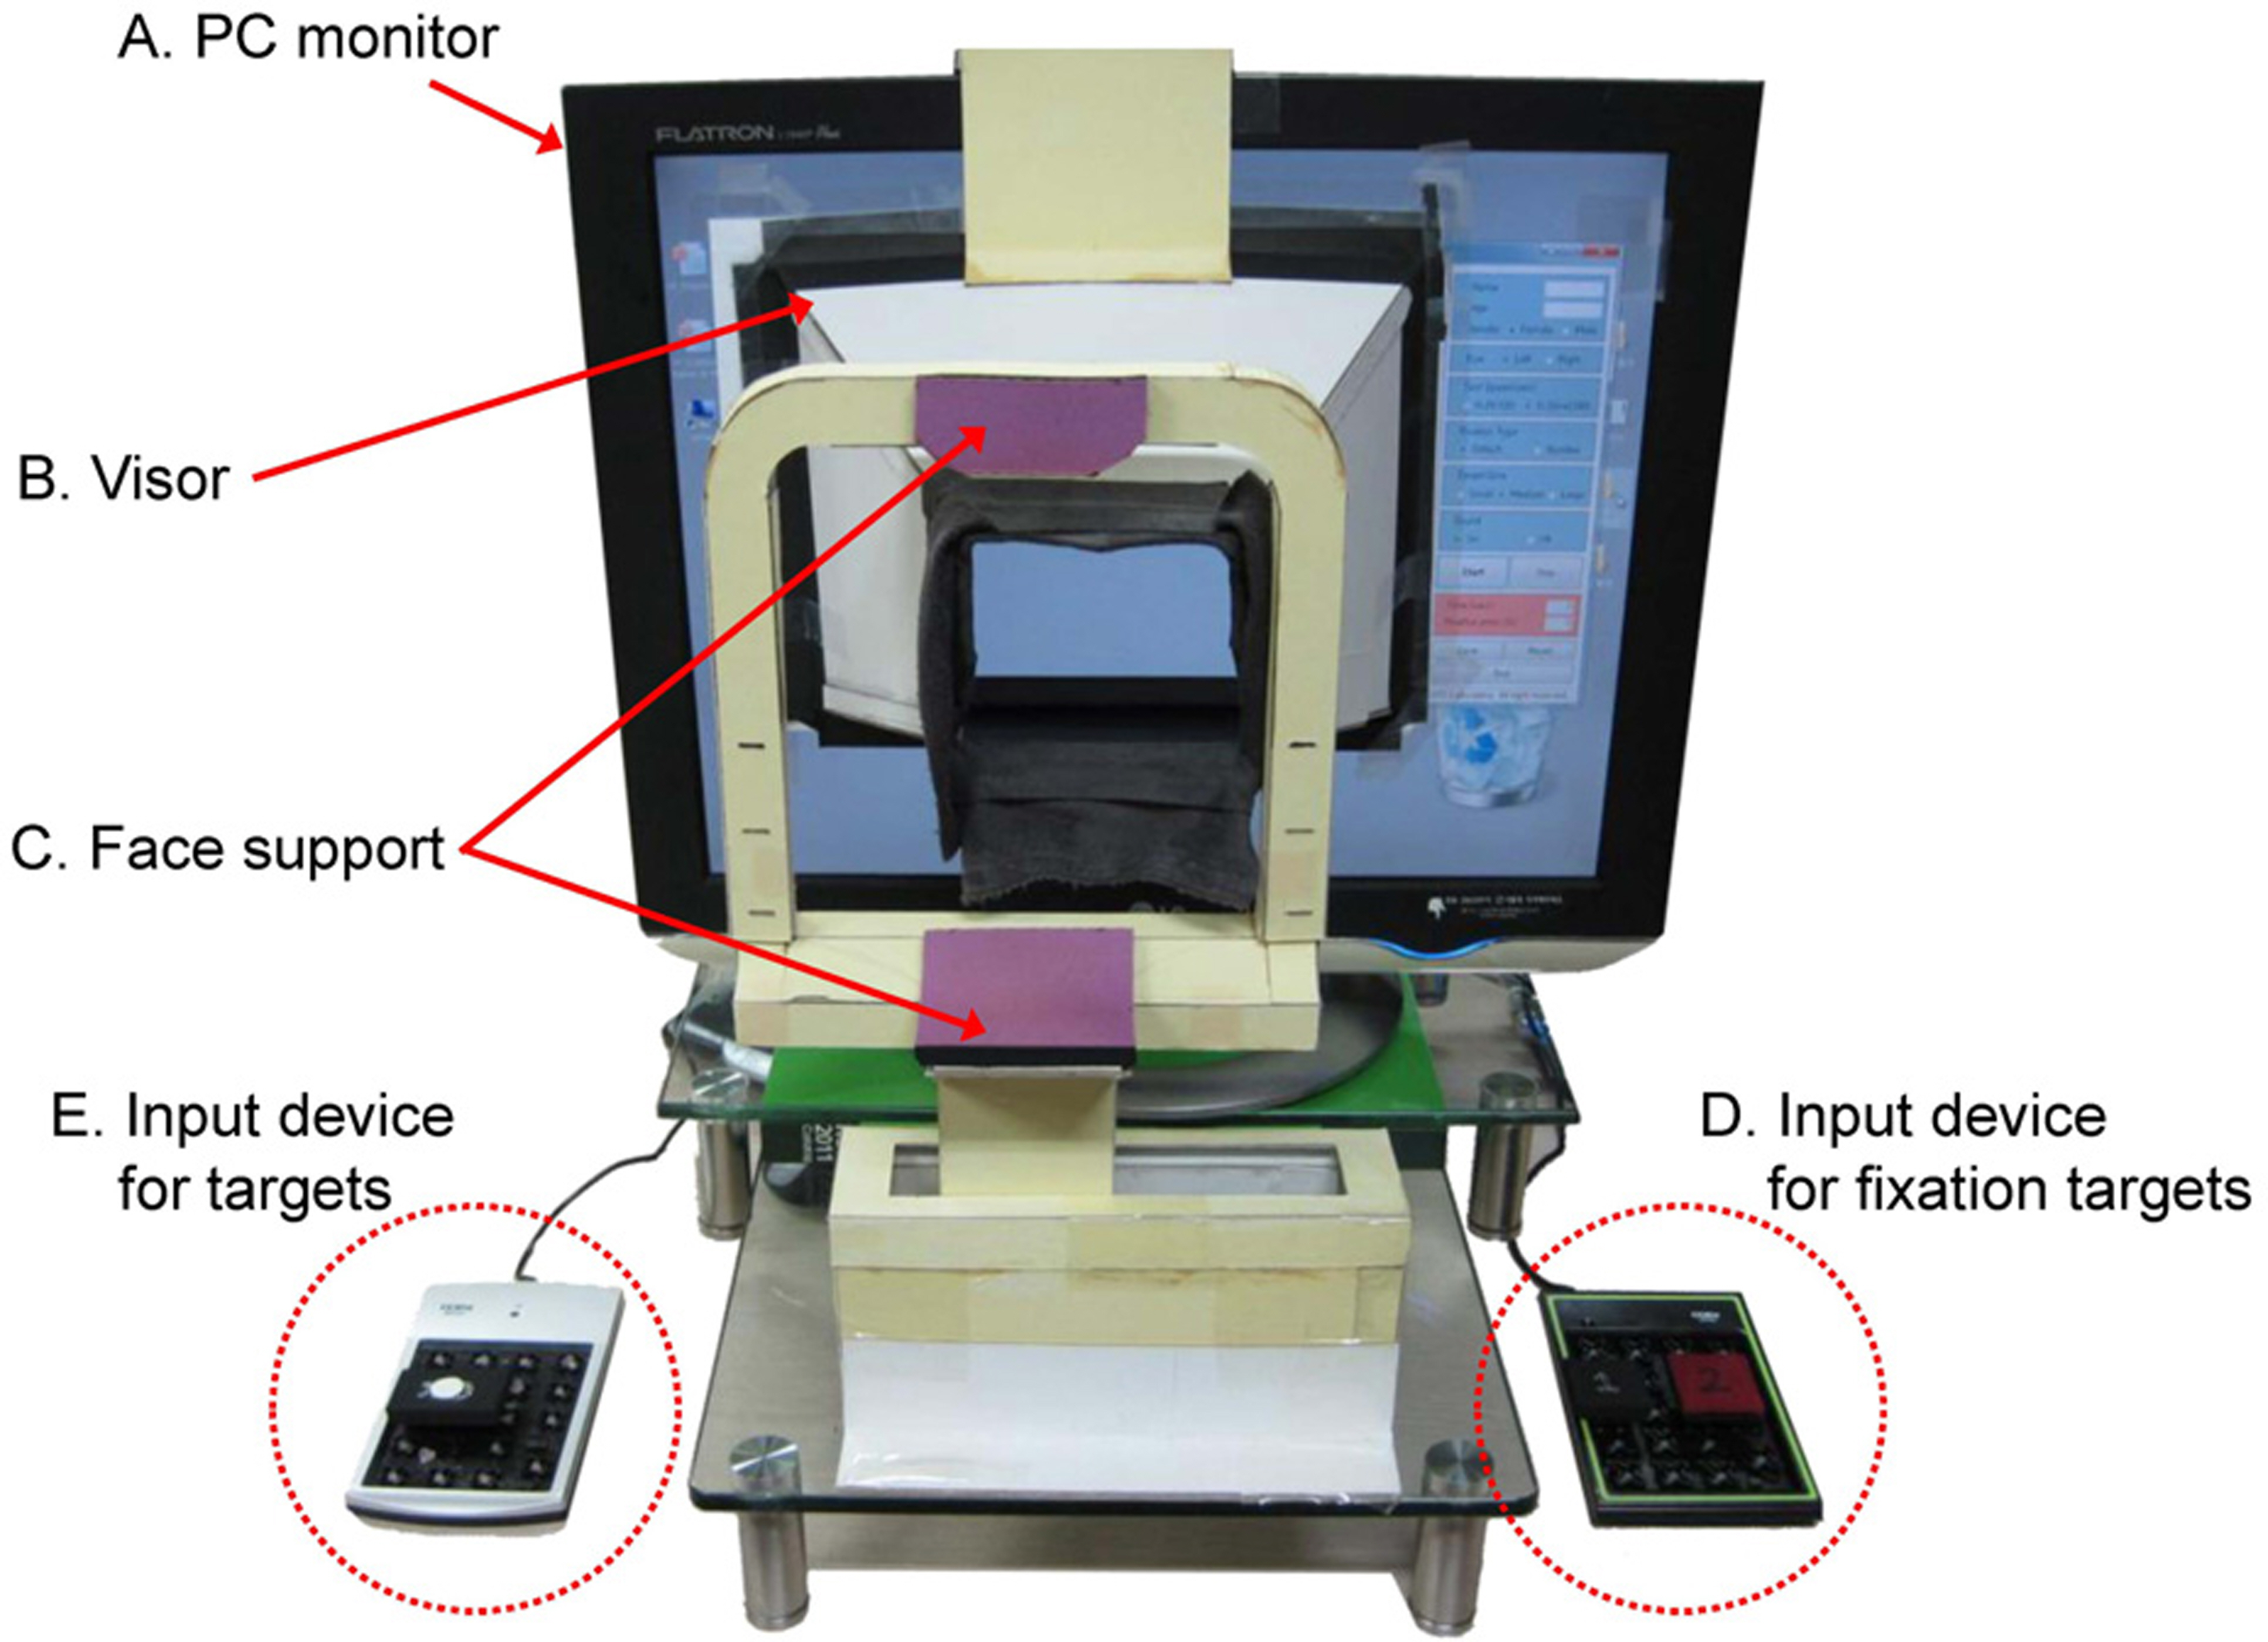
Figure 1. A prototype of PC-based visual field tester. (A) PC monitor (19 inch, Flatron L1940 plus, LG Electronics, Korea; pixel pitch = 0.294 mm) for presenting targets for testing a visual field. (B) visor for shielding outside lights, helping con-centration during test, selecting an eye to be tested and main-taining the distance between the eye and the monitor. (C) face support for maintaining the position of the eye and supporting comfortable posture. (D) input device for fixation target (1 or 2) confirmation. (E) input device for target detection.
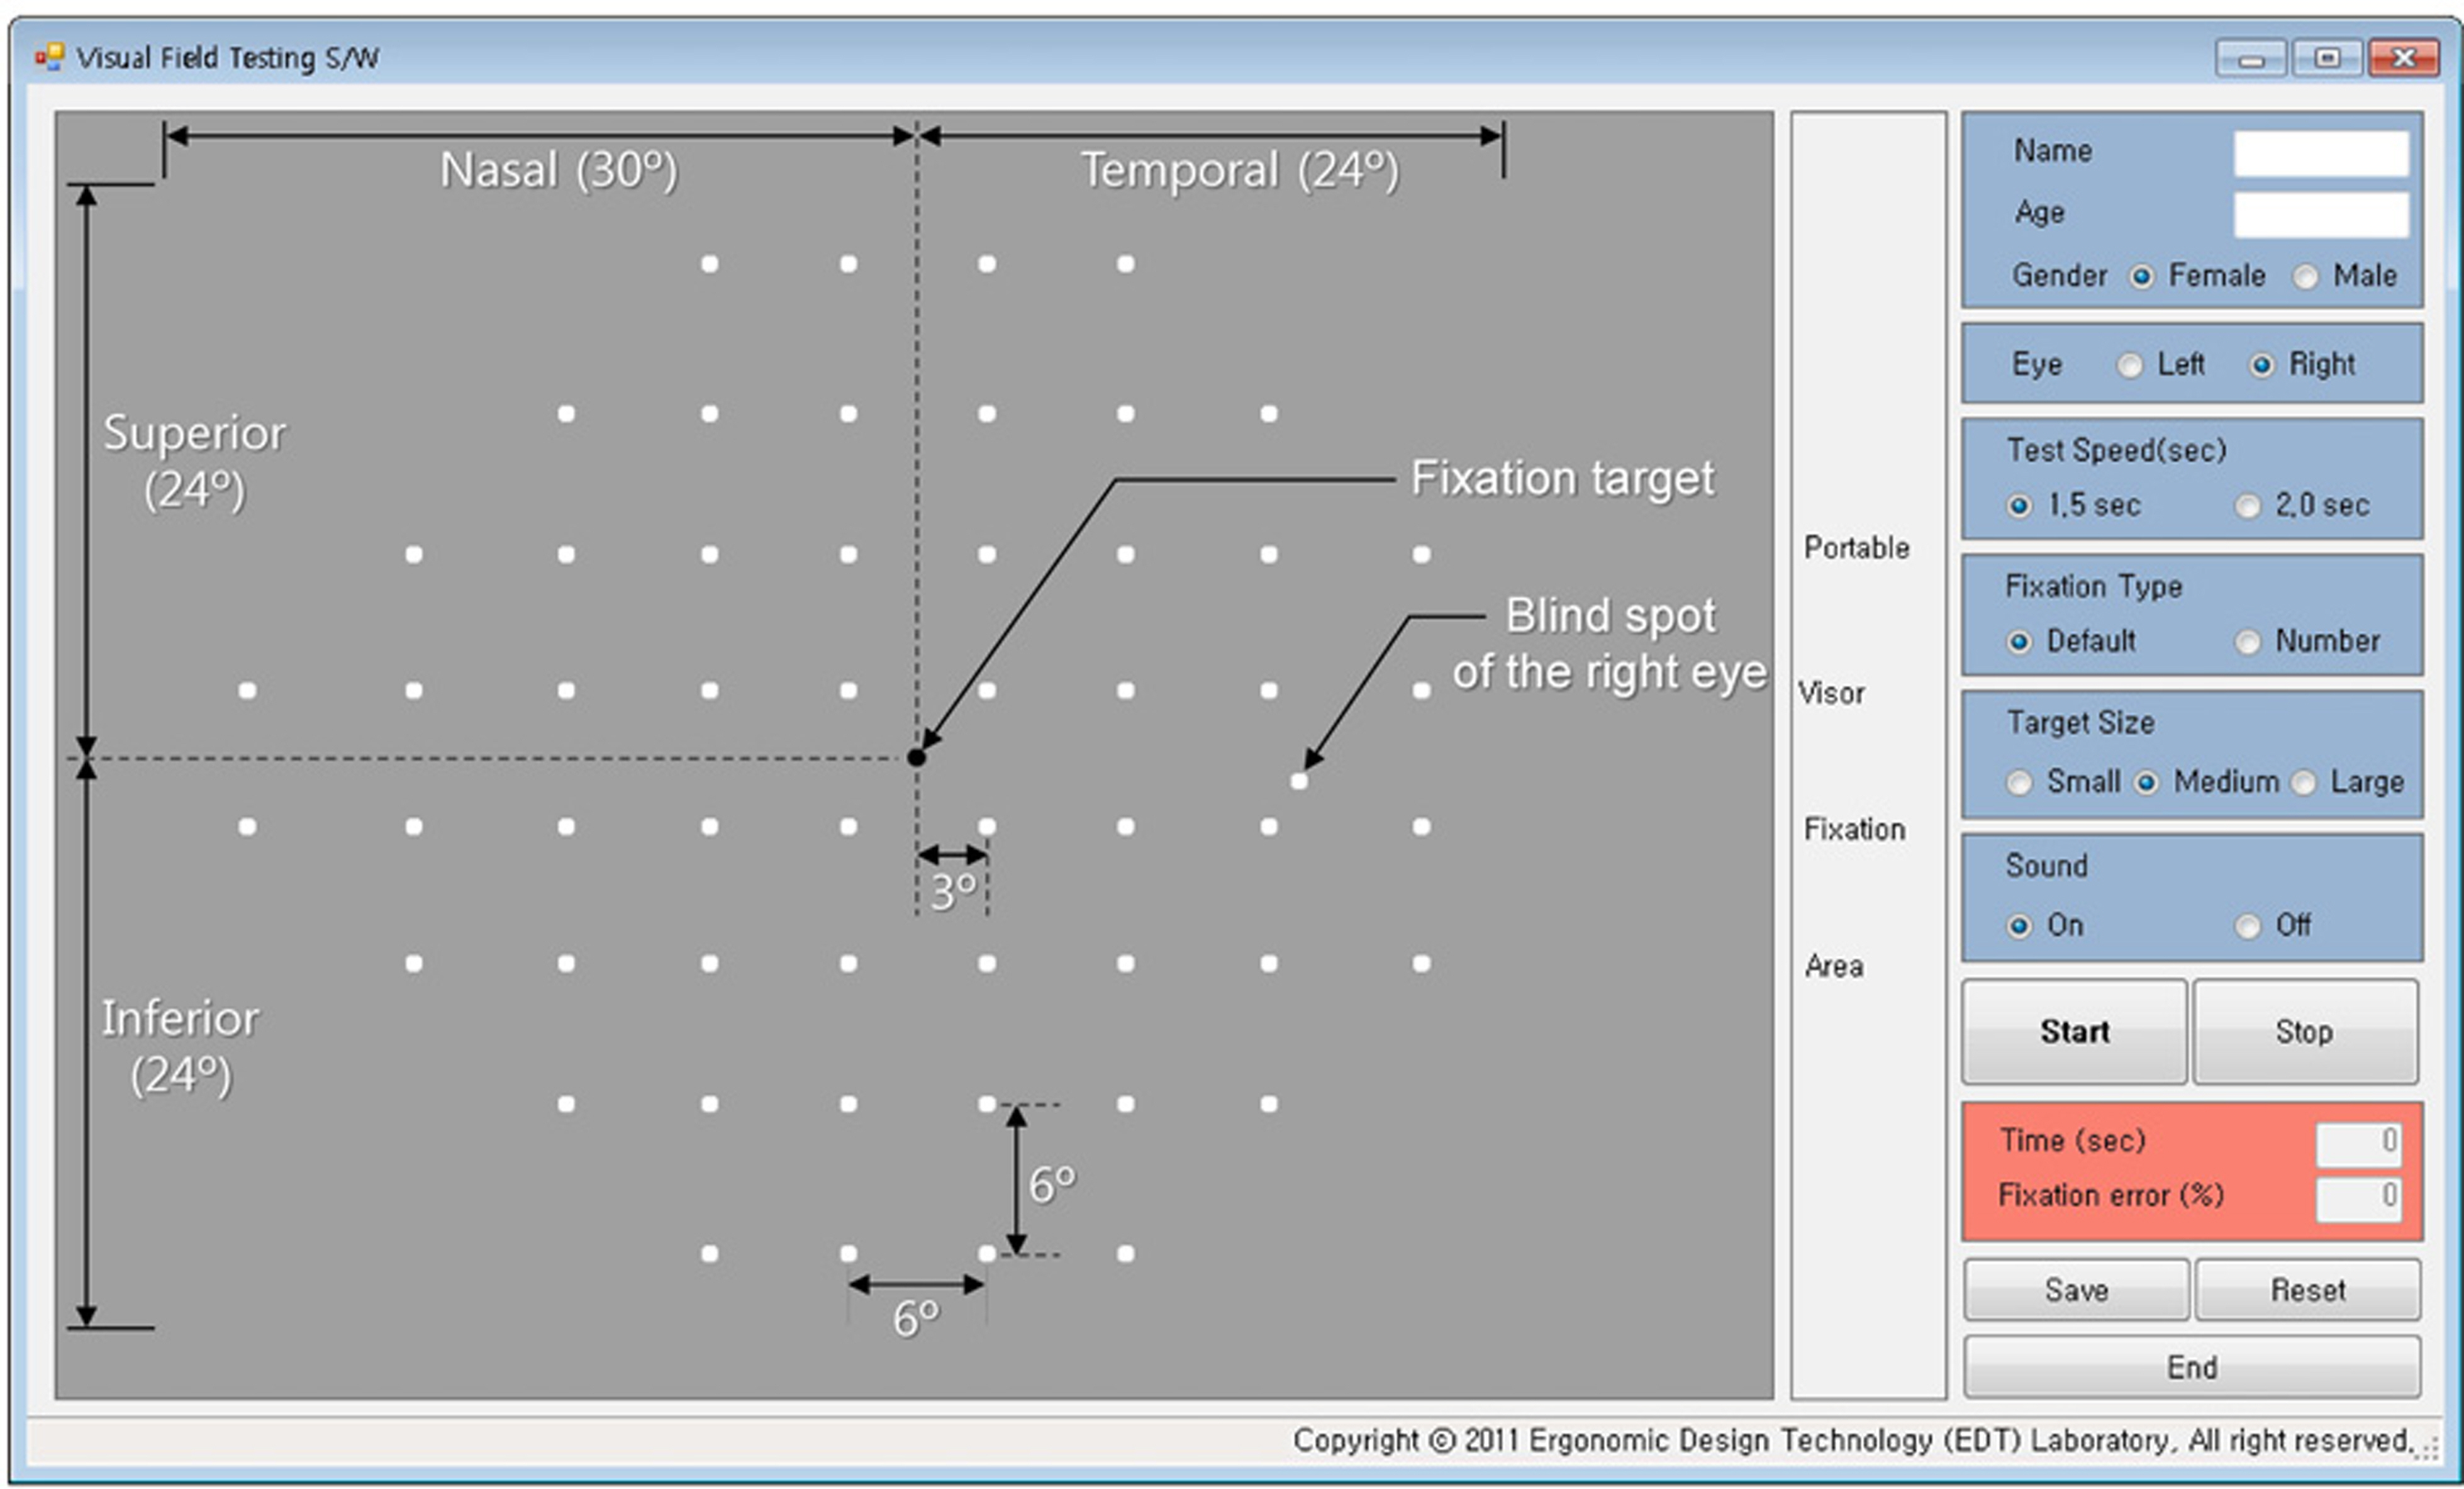
Figure 2. The target locations of the visual field testing S/W for the right eye. The visual field forms 24˚ superiorly, in-feriorly, temporally, and 30˚ nasally. The location of a blind spot was 1° superiorly and 16° temporally from the fixation target positioned at the center of a visual field area. The total number of target locations is 56 (1 for the fixation target, 54 for visual field targets, and 1 for blind spot).
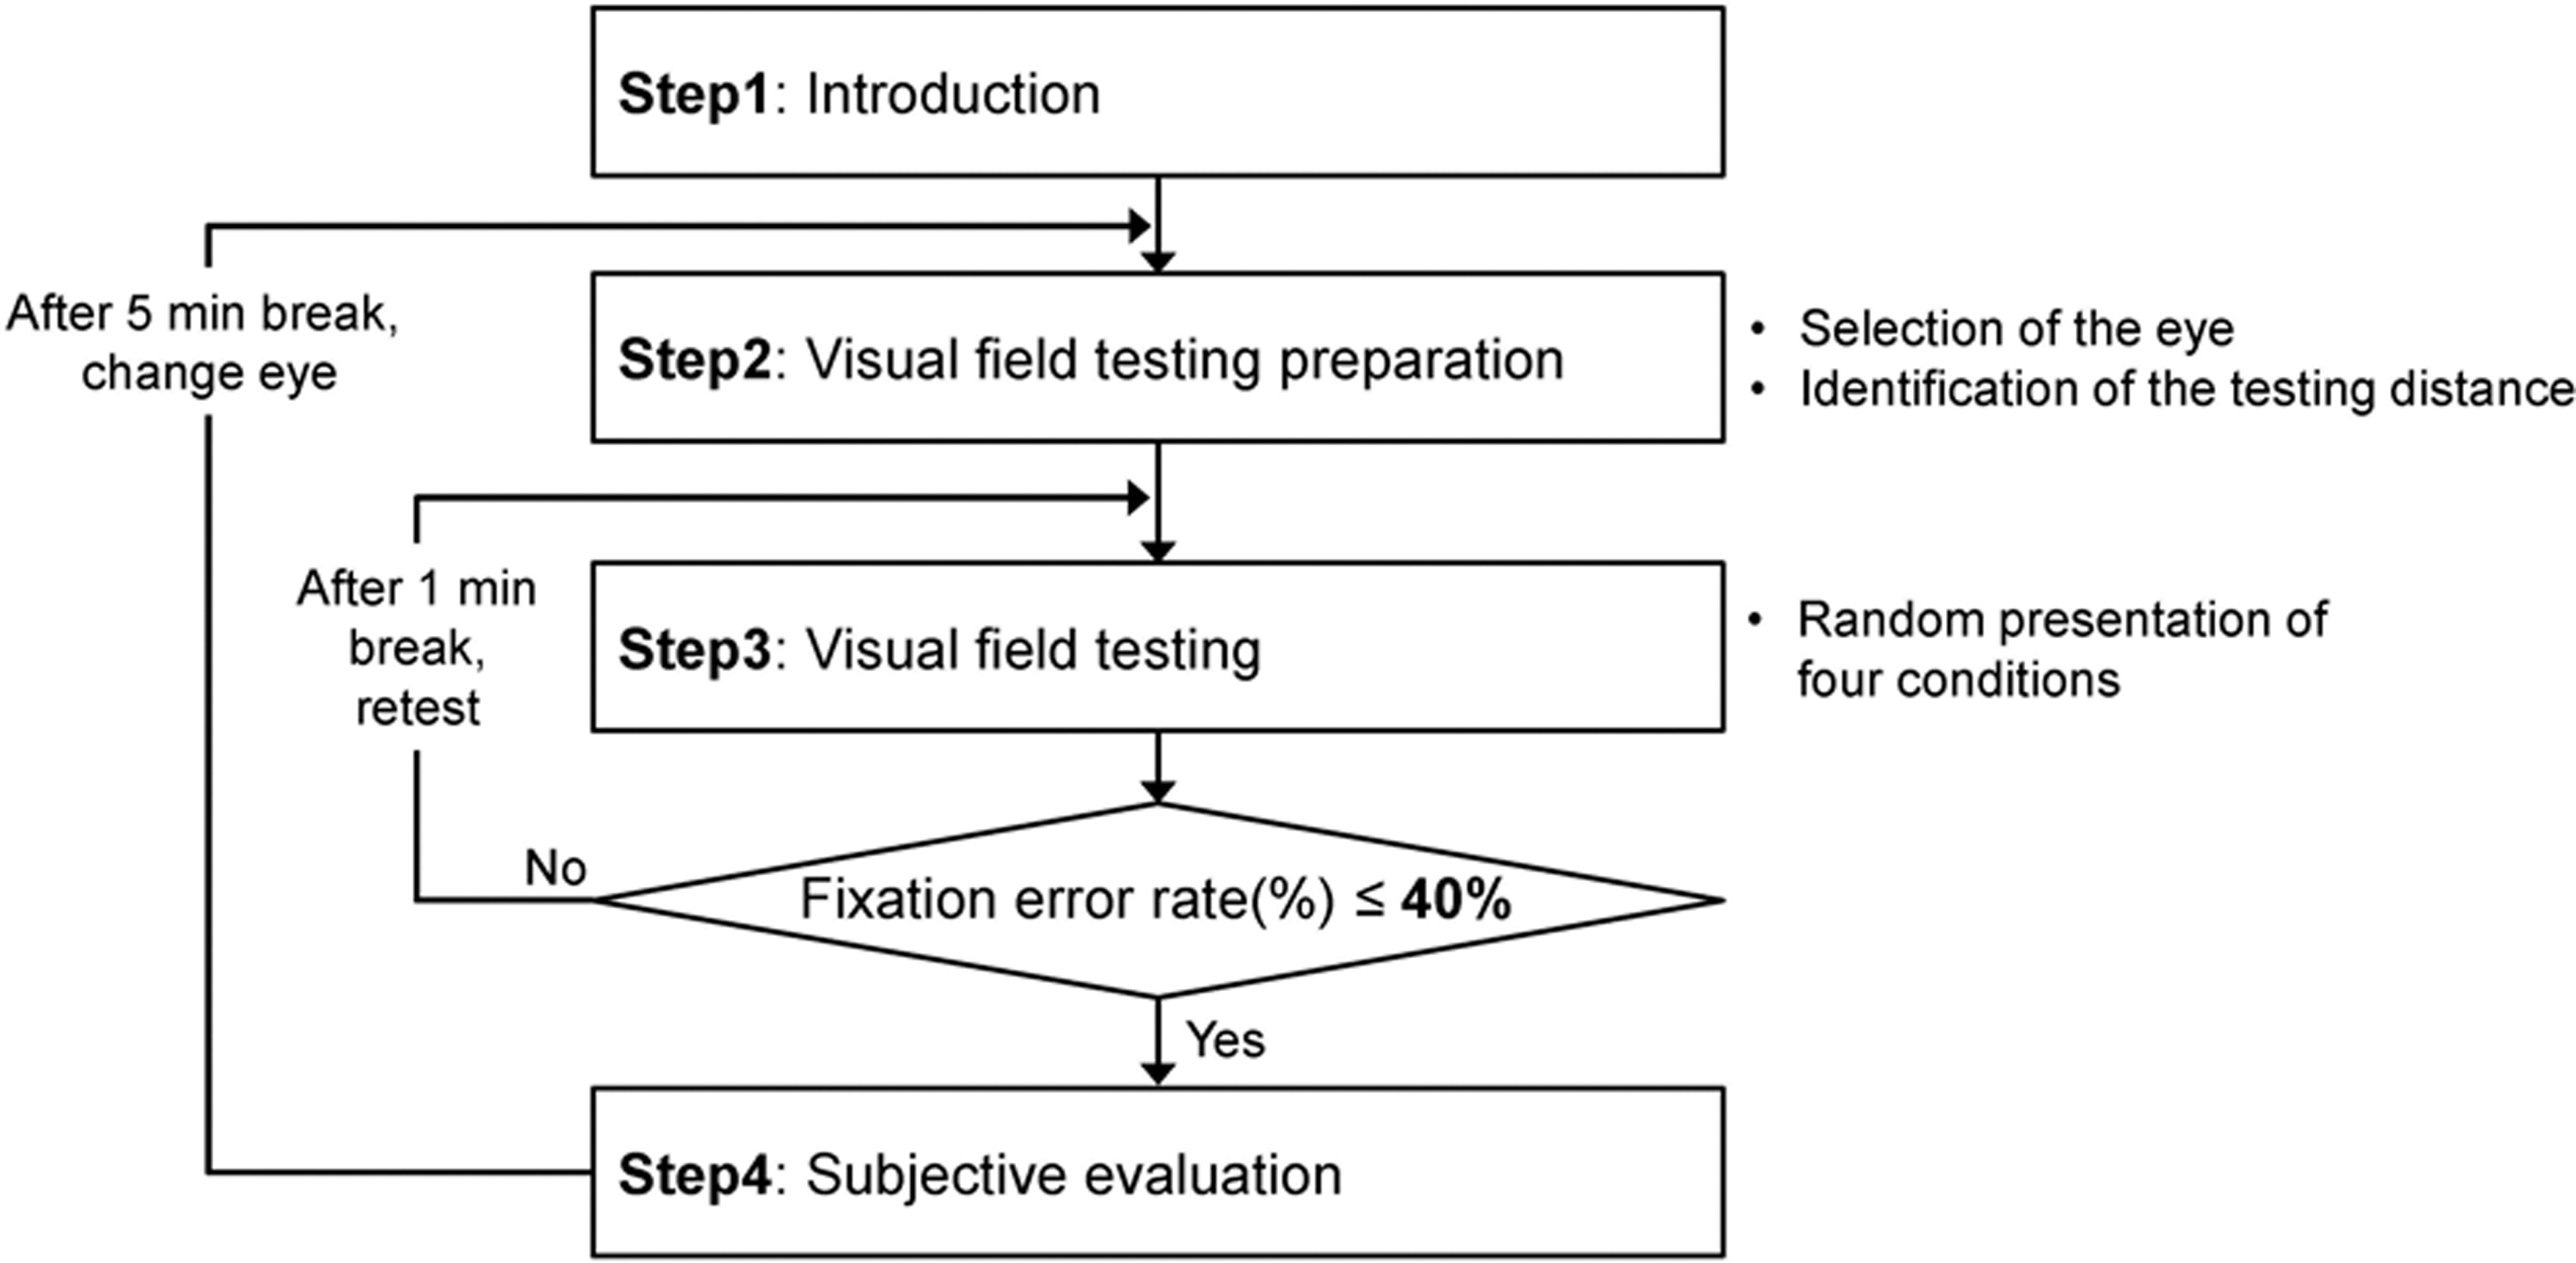
Figure 3. Experimental procedure. Four-step visual field testing is conducted: S1 = Introduction; S2 = Identification of the testing distance, alignment between the eye and the fix-ation target on the screen, and fixation of the face on the face support; S3 = Visual field testing randomly by 4 conditions (dot-on, dot-off, number-on, and number-off), 1 minute break among each condition; S4 = Evaluation of subjective sat-isfaction (7-point scale).
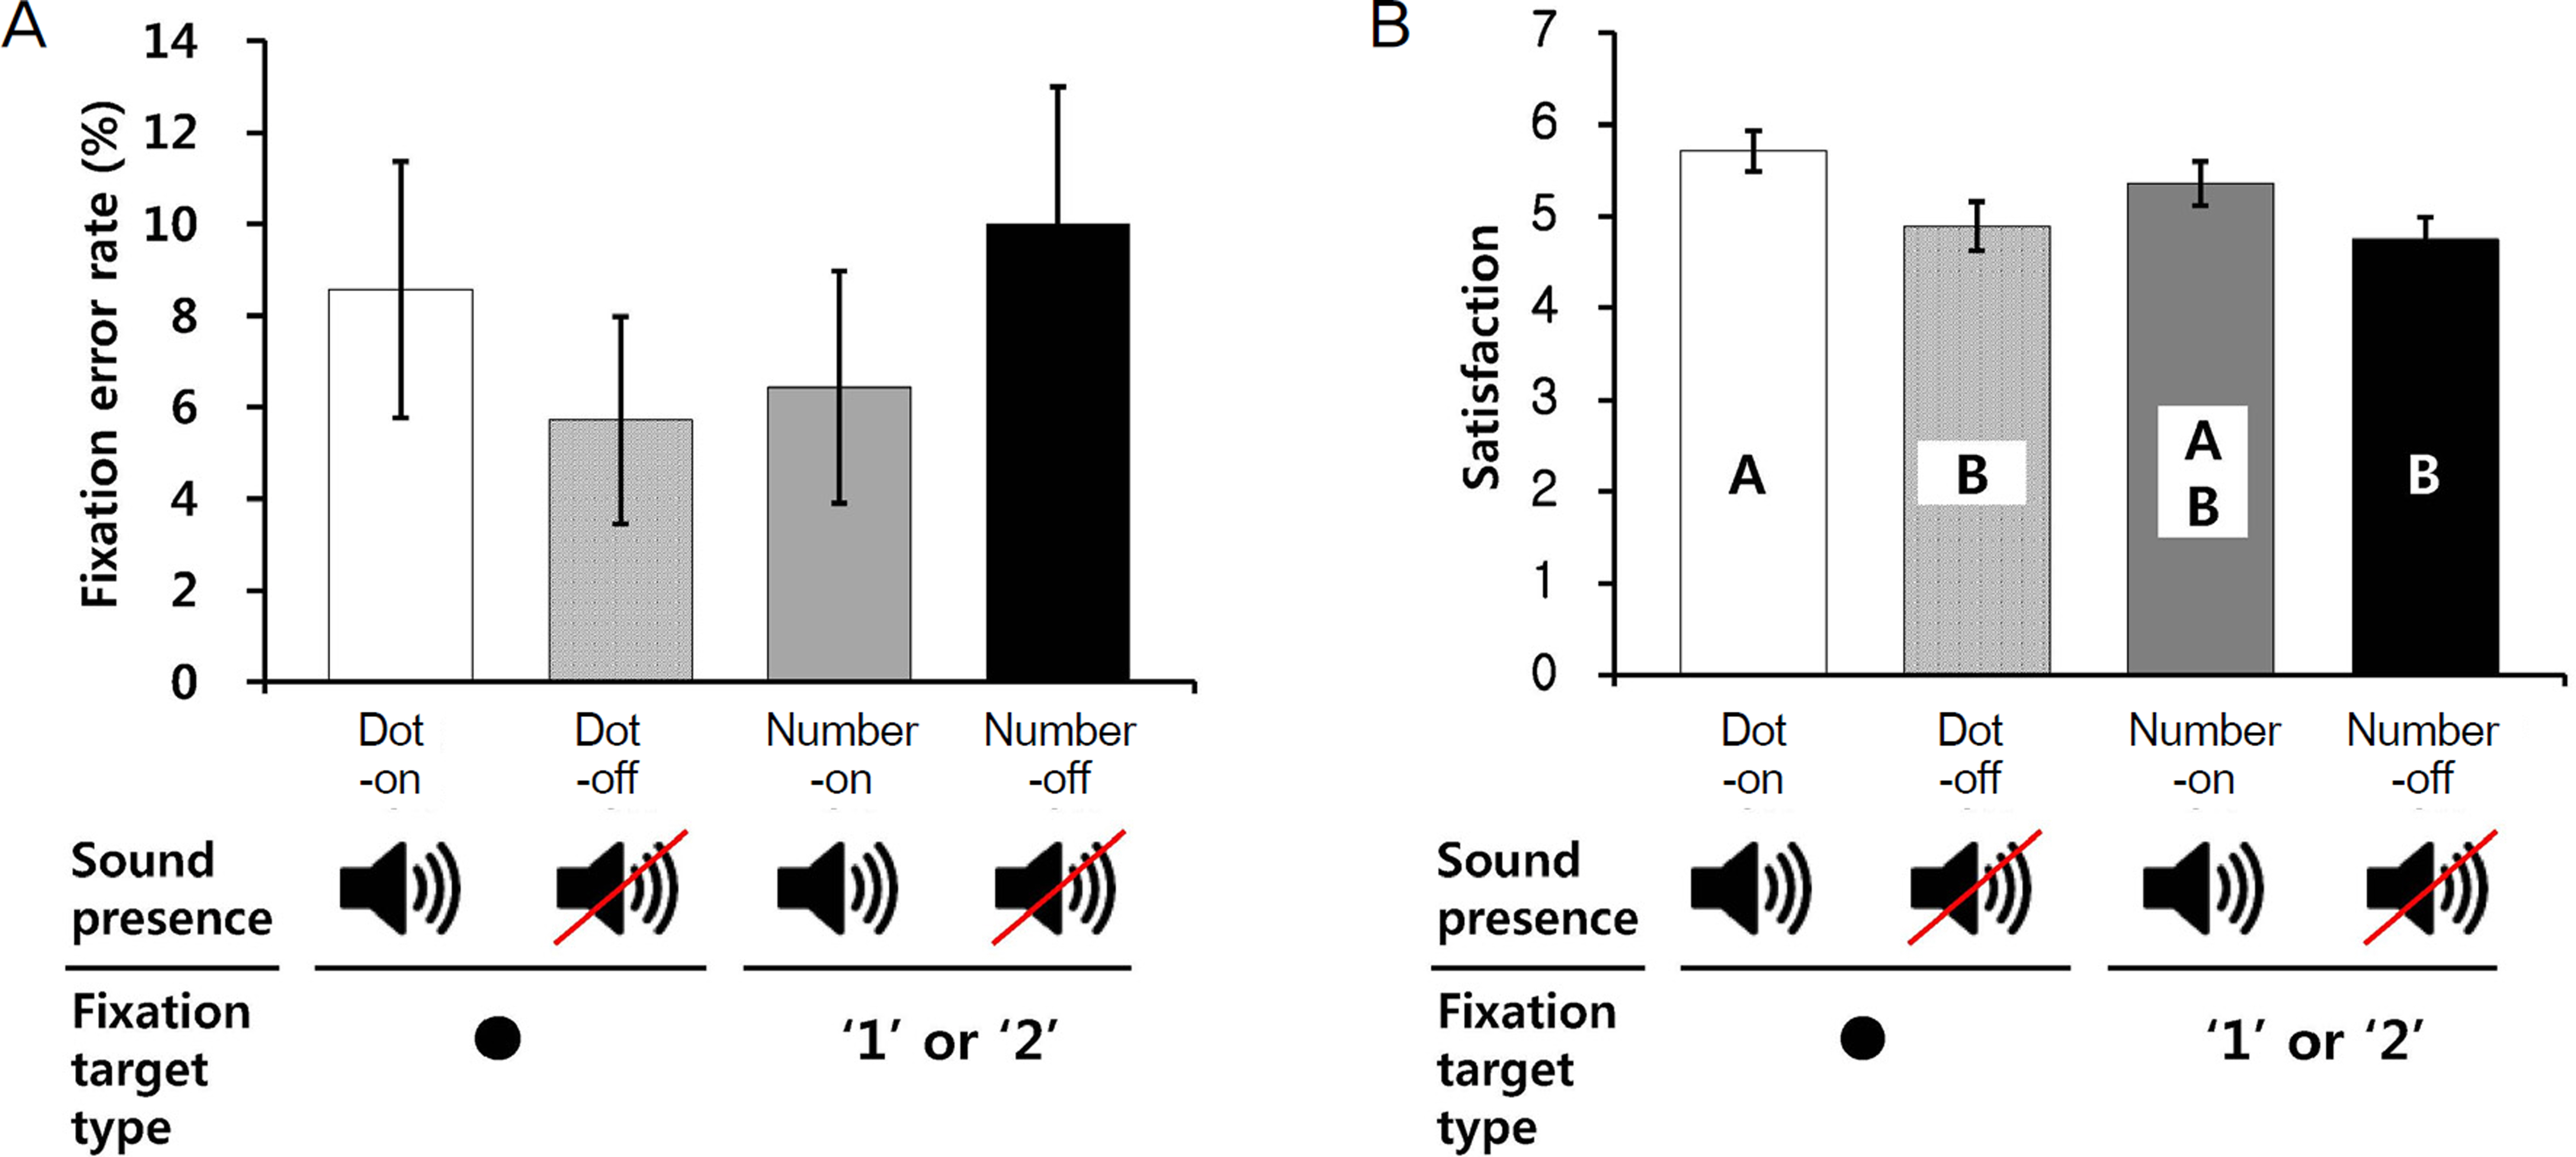
Figure 4. Results of visual field testing performance and subjective satisfaction. Dot-on condition: central target = dot and sound = on; dot-off condition: central target = dot and sound = off; number-on condition: central target = 1 or 2 and sound = on; number-off condition: central target = 1 or 2 and sound = off. (A) Fixation error rate (mean ± SE). (B) Subjective satisfaction by using 7-point scale (mean ± SE).
Figure 5. The rates of missing targets near the blind spots at the left eye (A) and right eye (B).
Reference
-
References
1. Lee J, Lee B, Kim Y. . The effect of eye fixation control method on visual field testing. In Proceedings of the 2011 Fall Conference of Ergonomics Society of Korea. 2011.2. Henson DB, Evans J, Chauhan BC, Lane C. Influence of fixation accuracy on threshold variability in patients with open angle glaucoma. Invest Ophthalmol Vis Sci. 1996; 37:444–50.3. Kim CH, Lee DC. Analysis of eye movement features in Korean recognition procedure. In Proceedings of the 1995 Spring Conference of Ergonomics Society of Korea. 1995.4. Lee J, Lee B, Kim Y. . Evaluation of an ergonomic gaze fix-ation induction method for effective visual field testing. In Proceedings of the 2012 Fall Conference of Ergonomics Society of Korea. 2012.5. Carl Zeiss Meditec Inc. Humphrey® Field Analyzer II-i series User Manual. 2005; 92.6. Anderson DR. Perimetry with and without automation. 104. 2nd ed. St. Louis: CV Mosby;1987.7. Choi JA, Lee NY, Park CK. Interpretation of the Humphrey Matrix 24-2 test in the diagnosis of preperimetric glaucoma. Jpn J Ophthalmol. 2009; 53:24–30.
Article8. Fan X, Wu LL, Ma ZZ. . Usefulness of frequency-doubling technology for perimetrically normal eyes of open-angle glaucoma patients with unilateral field loss. Ophthalmology. 2010; 117:1530–7.
Article9. Giuffré I. Frequency doubling technology vs. standard automated perimetry in ocular hypertensive patients. Open Ophthalmol J. 2009; 3:6–9.10. Kogure S, Toda Y, Tsukahara S. Prediction of future scotoma on conventional automated static perimetry using frequency doubling technology perimetry. Br J Ophthalmol. 2006; 90:347–52.
Article11. Nomoto H, Matsumoto C, Takada S. . Detectability of glau-comatous changes using SAP, FDT, flicker perimetry, and OCT. J Glaucoma. 2009; 18:165–71.
Article12. Brusini P. Frequency doubling technology staging system 2. J Glaucoma. 2006; 15:315–20.
Article13. Dersu I, Wiggins MN. Understanding Visual Fields, Part II; Humphrey Visual Fields. J Ophathalmic Med Technology. 2006; 2:1–10.14. Bengtsson B, Olsson J, Heijl A, Rootzén H. A new generation of algorithms for computerized threshold perimetry, SITA. Acta Ophthalmol Scand. 1997; 75:368–75.
Article15. Turpin A, McKendrick AM, Johnson CA, Vingrys AJ. Development of efficient threshold strategies for frequency doubling technology perimetry using computer simulation. Invest Ophthalmol Vis Sci. 2002; 43:322–31.16. Anderson AJ. Spatial resolution of the tendency-oriented peri-metry algorithm. Invest Ophthalmol Vis Sci. 2003; 44:1962–8.
Article17. Chan K, Lee TW, Sample PA. . Comparison of machine learning and traditional classifiers in glaucoma diagnosis. IEEE Trans Biomed Eng. 2002; 49:963–74.18. Moreno-Montañés J, Antón A, García N. . Glaucoma proba-bility score vs Moorfields classification in normal, ocular hyper-tensive, and glaucomatous eyes. Am J Ophthalmol. 2008; 145:360–8.
Article19. Wroblewski D, Francis BA, Chopra V. . Glaucoma detection and evaluation through pattern recognition in standard automated perimetry data. Graefes Arch Clin Exp Ophthalmol. 2009; 247:1517–30.
Article20. Wogalter M, Leonard S. Wogalter M, Dejoy D, Laughery K, editors. . Attention capture and maintenance. Warnings and risk com-munication. 4th ed. London: Taylor & Francis;2005; chap. 7.21. Fletcher W. The big blind spot syndromes. 1996 North American Neuro-Ophthalmology Society Annual Meeting. 1996; 1:59–65.22. Fasih U, Shaikh A, Shaikh N. . Evaluation of reliability of visu-al field examination in glaucoma patients. Pak J Ophthalmol. 2009; 25:145–51.
- Full Text Links
-
- Actions
-
Cited
- CITED
-
- Close
- Share
-
- Similar articles
-
- Reliability Indexes of Automated Perimetric Tests
- The Influence of Miotics on Visual Field in Glaucoma
- Usefulness of Computerized Objective Visual Acuity Test System Using Suppression Method
- Development of an LCD-Based Visual Field System
- Association of Abnormal Eye Gaze Pattern with Magical Ideation during Reality Evaluation in Patients with Schizophrenia
