Changes in Visual Field Index After Cataract Extraction
- Affiliations
-
- 1Department of Ophthalmology and Visual Science, Uijeongbu St. Mary's Hospital, College of Medicine, The Catholic University of Korea, Seoul, Korea. cassiopeia-su@hanmail.net
Abstract
- PURPOSE
To investigate the changes of visual field index (VFI) compared with mean deviation (MD) and pattern standard deviation (PSD) before and after cataract surgery.
METHODS
The present study included 77 eyes of 77 patients who were diagnosed with both glaucoma and cataracts and underwent cataract surgery. Preoperative and postoperative VFI, MD, and PSD were examined. Lens opacity type was classified as cortical, nucleosclerosis, or posterior subcapsular opacity (PSCO), and the MD, PSD, and VFI were compared before and after cataract surgery.
RESULTS
Preoperative and postoperative MD were -13.64+/-8.97, -11.94+/-9.67(p=0.113), PSD were 6.18+/-3.30, 5.91+/-3.31(p=0.344), and VFI were 67.00+/-33.43, 70.55+/-33.19(p=0.440), respectively. MD showed statistically significant difference in cortical and PSCO type before and after cataract surgery. PSD (p=0.025) and VFI (p=0.020) showed a statistically significant difference in cortical type.
CONCLUSIONS
VFI is an effective parameter to monitor the progression of glaucoma in cataract patients with nucleosclerosis and PSCO, but has limitations in cataract patients with cortical opacity.
Keyword
MeSH Terms
Figure
-

Figure 1. (A) 24–2 Visual field examination, 3 months before cataract surgery (MD=-6.52dB, PSD=9.09dB, VFI: 82%). (B) 24–2 Visual field examintion, 4 months after cataract surgery showing much better test results (MD= −5.07dB, PSD=4.45dB, VFI=91%).

Figure 2. Correlation between MD and VFI. MD and VFI showed positive correlation which is statistically significant (R2=0.96, p<0.005) (MD=mean deviation, VFI=visual field index).
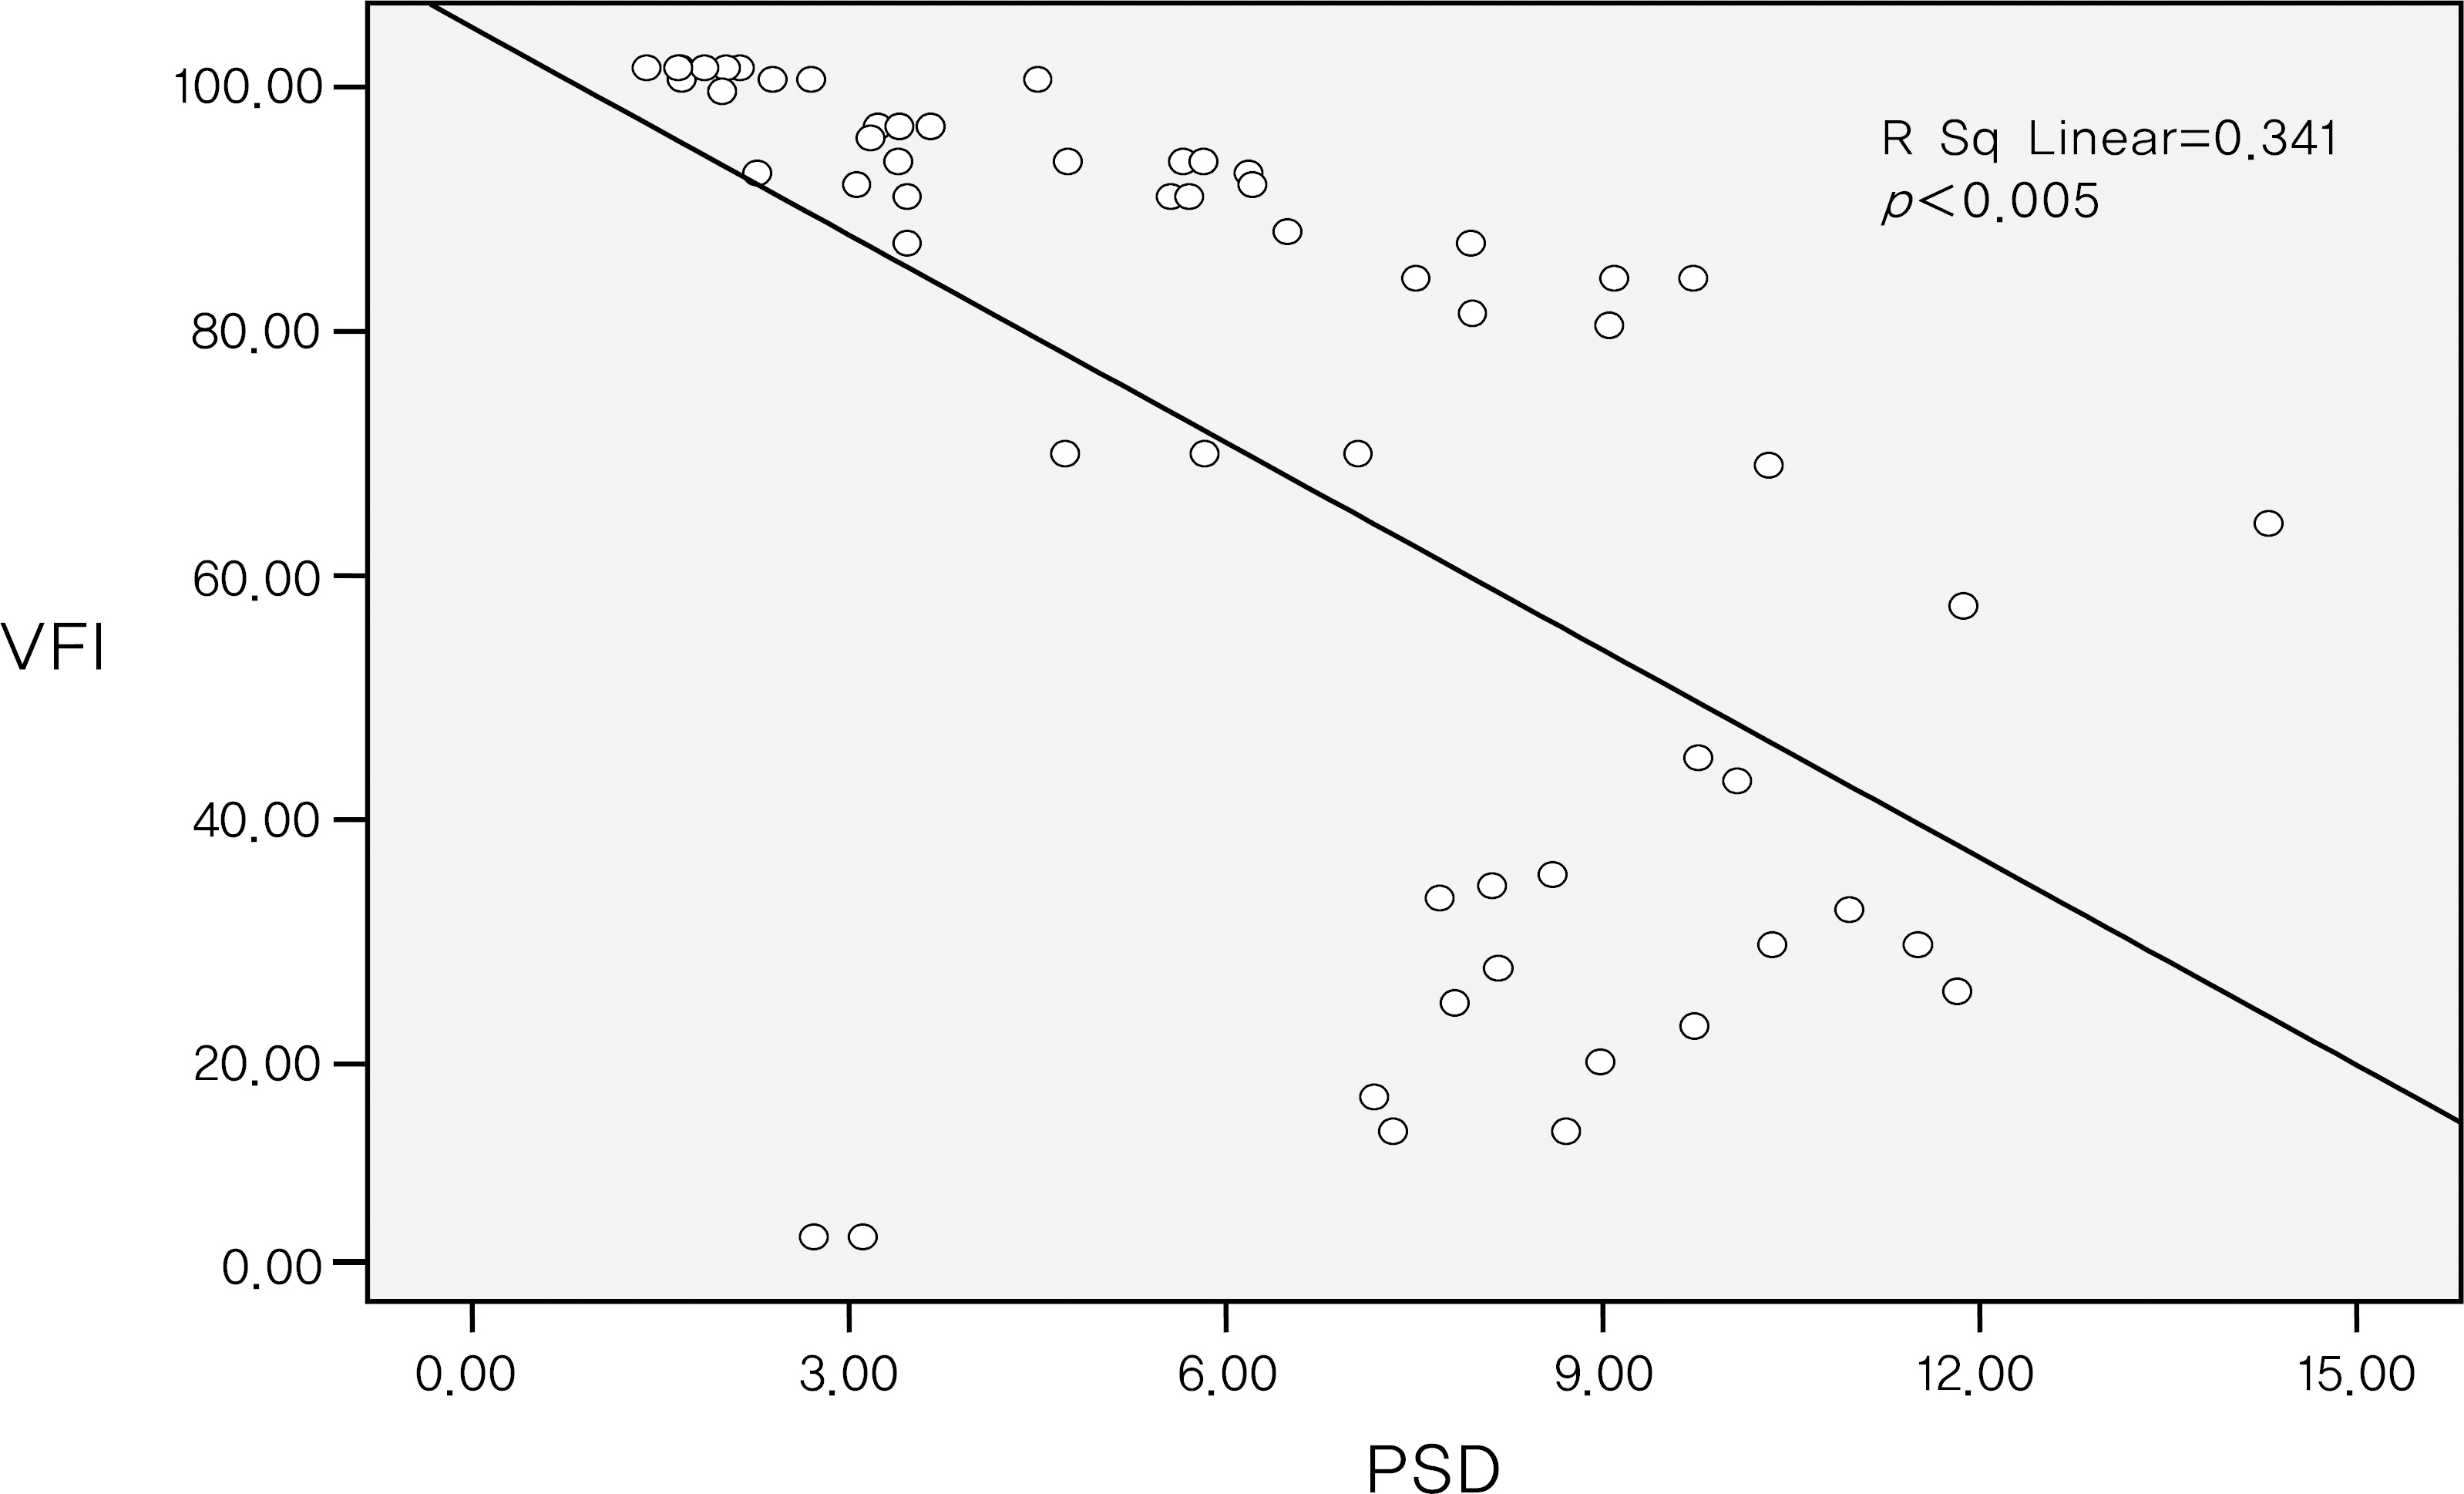
Figure 3. Correlation between PSD and VFI. PSD and VFI showed negative correlation which is statistically significant (R2=0.341, p<0.005). (PSD=pattern standard deviation, VFI=visual field index).

Figure 4. Correlation between difference in visual acuity and difference in VFI. Improvement of postoperative visual acuity was not related to difference in VFI (R2=0.002, p=0.68). (BCVA=best corrected visual acuity, VFI=visual field index).
Reference
-
References
1. Seong MC, Choi JW, Lee JE, et al. The relationship between parameters measured by optical coherence tomography and visual field indices. J Korean Ophthalmol Soc. 2008; 49:771–7.
Article2. Lichter PR, Musch DC, Gillespie BW, et al. Interim clinical outcomes in the Collaborative Initial Glaucoma Treatment Study comparing initial treatment randomized to medications or surgery. Ophthalmology. 2001; 108:1943–53.
Article3. Koucheki B, Nouri-Mahdavi K, Patel G, et al. Visual field changes after cataract extraction: the AGIS experience. Am J Ophthalmol. 2004; 138:1022–8.
Article4. Kim YY, Kim JS, Shin DH, et al. Effect of cataract extraction on blue-on-yellow visual field. Am J Ophthalmol. 2001; 13:2217–20.
Article5. Chen PP, Budenz DL. The effects of cataract extraction on the visual field of eyes with chronic open-angle glaucoma. Am J Ophthalmol. 1998; 125:325–33.
Article6. Hayashi K, Hayashi H, Nakao F, Hayashi F. Influence of cataract surgery on automated perimetry in patients with glaucoma. Am J Ophthalmol. 2001; 132:41–6.
Article7. Chiselita D, Marcu C, Apostol A, Nitu M. Effect of cataract surgery for visual field in glaucoma patients. Oftalmologia. 2007; 51:73–80.8. Rehman Siddiqui MA, Khairy HA, Azuara-Blanco A. Effect of cataract extraction on SITA perimetry in patients with glaucoma. J Glaucoma. 2007; 16:205–8.
Article9. Siddiqui MA, Azuara-Blanco A, Neville S. Effect of cataract extraction on frequency doubling technology perimetry in patients with glaucoma. Br J Ophthalmol. 2005; 89:1569–71.
Article10. Bengtsson B, Heijl A. A visual field index for calculation of glaucoma rate of progression. Am J Ophthalmol. 2008; 145:343–53.
Article11. Casas-Llera P, Rebolleda G, Muñoz-Negrete FJ, et al. Visual Field Index Rate and Event-Based Glaucoma Progression Analysis: Comparison in a Glaucoma Population. Br J Ophthalmol. 2009; 93:1576–9.
Article12. Arnalich-Montiel F, Casas-Llera P, Muñoz-Negrete FJ, Rebolleda G. Performance of glaucoma progression analysis software in a glaucoma population. Graefes Arch Clin Exp Ophthalmol. 2009; 247:391–7.
Article13. Diaz-Aleman VT, Anton A, de la Rosa MG, et al. Detection of visual-field deterioration by Glaucoma Progression Analysis and Threshold Noiseless Trend programs. Br J Ophthalmol. 2009; 93:322–8.
Article
- Full Text Links
-
- Actions
-
Cited
- CITED
-
- Close
- Share
-
- Similar articles
-
- Effect of Cataract Extraction on Visual Field Test in Patients with Glaucoma
- Clinical Evaluation of Traumatic Cataract with Corneal Laceration
- Clinical Analysis of Cataract Extraction in Behcet disease
- Evaluation of Combined Cataract and Glaucoma Operation
- Cataract Extraction after Penetrating Keratoplasty
