Investigation of Immune Biomarkers Using Subcutaneous Model of M. tuberculosis Infection in BALB/c Mice: A Preliminary Report
- Affiliations
-
- 1Biochemistry Research Laboratory, Central India Institute of Medical Sciences, 88/2 Bajaj Nagar, Nagpur 440 010, India. raj_ciims@rediffmail.com
- 2Department of Veterinary Microbiology and Animal Biotechnology, Nagpur Veterinary College, Nagpur 440 006, India.
- 3Environmental Genomic Unit, National Environmental Engineering Research Institute (NEERI), CSIR, Nehru Marg, Nagpur-440 020, India.
- KMID: 2168033
- DOI: http://doi.org/10.4110/in.2015.15.2.83
Abstract
- Evaluation and screening of vaccines against tuberculosis depends on development of proper cost effective disease models along with identification of different immune markers that can be used as surrogate endpoints of protection in preclinical and clinical studies. The objective of the present study was therefore evaluation of subcutaneous model of M.tuberculosis infection along with investigation of different immune biomarkers of tuberculosis infection in BALB/c mice. Groups of mice were infected subcutaneously with two different doses : high (2x10(6) CFU) and low doses (2x10(2) CFU) of M.tuberculosis and immune markers including humoral and cellular markers were evaluated 30 days post M.tuberculosis infections. Based on results, we found that high dose of subcutaneous infection produced chronic disease with significant (p<0.001) production of immune markers of infection like IFNgamma, heat shock antigens (65, 71) and antibody titres against panel of M.tuberculosis antigens (ESAT-6, CFP-10, Ag85B, 45kDa, GroES, Hsp-16) all of which correlated with high bacterial burden in lungs and spleen. To conclude high dose of subcutaneous infection produces chronic TB infection in mice and can be used as convenient alternative to aerosol models in resource limited settings. Moreover assessment of immune markers namely mycobacterial antigens and antibodies can provide us valuable insights on modulation of immune response post infection. However further investigations along with optimization of study protocols are needed to justify the outcome of present study and establish such markers as surrogate endpoints of vaccine protection in preclinical and clinical studies in future.
Keyword
MeSH Terms
Figure
-
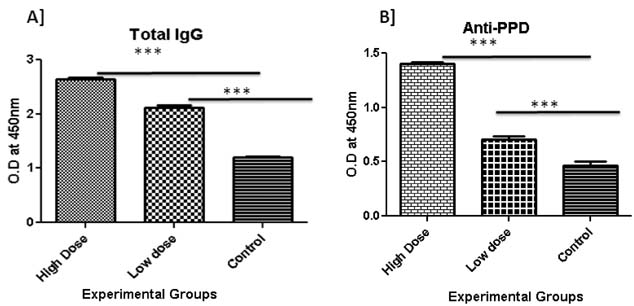
Figure 1 (A) Mean Total IgG and (B) anti-PPD levels in serum of mice (n=7, each group) in high dose, low dose and control groups. Antibody levels were estimated 30 days after development of TB infection. Paired t-test was used to compare and obtain statistical significance. Error bars indicate standard error of mean. **Represents significant (p<0.05) and ***represents highly significant (p<0.001) values.

Figure 2 Scatter plot of antibody levels against panel of MTB H37Rv antigens (a) Ag85B (b) 45kDa (c) Hsp 16 (d) GroEs (e) ESAT-6 and (f) CFP-10 in serum of mice (n=7, each group) after TB infection. Paired t-test was used to compare and obtain statistical significance. Error bars indicate standard error of mean. **Represent significant (p<0.05) and ***represents highly significant (p<0.001) values.

Figure 3 Mean mycobacterial Hsp levels (a) mHsp 16 (b) mHsp-65 and (c) mHsp-71 in serum of mice (n=7, each groups) in different dose groups. Error bars indicate standard error of mean. **Represents significant (p<0.05) and ***represents highly significant (p<0.001) values.
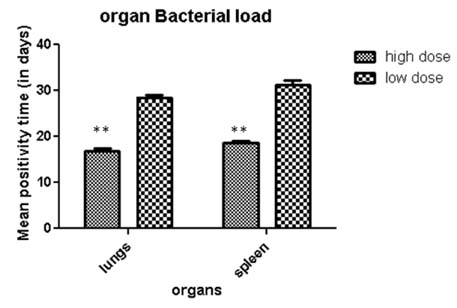
Figure 4 Shows mean growth time of MTB in lung and spleen homogenates of mice (n=7) collected 30 post MTB infection in different dose group. Mice from respective groups were sacrificed and mycobacterial load was determined by inoculating serially diluted lung homogenates in Middle brook 7H9 liquid medium and incubating at 37℃ in BacT/Alert system (Biomerieux) for 30 days. Bars represent mean time required for growth in BacT was taken as a correlate of load in respective organs of mice group. Data are shown as ±SD. **Represent significant (p<0.05) values.
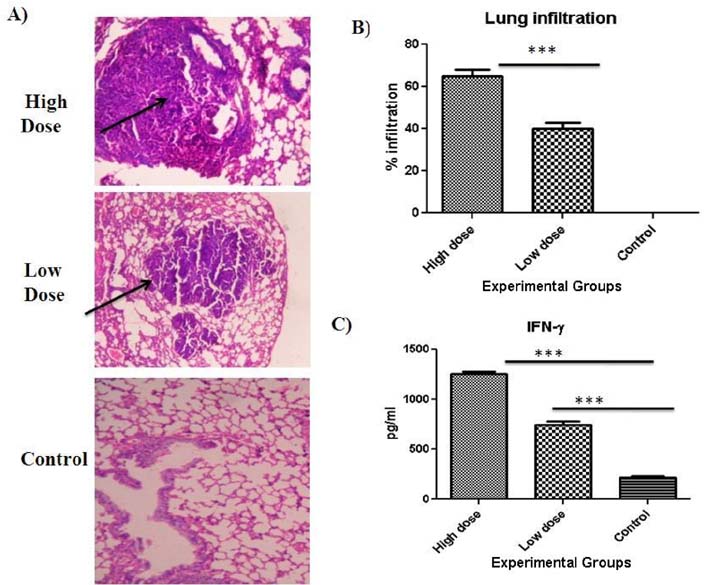
Figure 5 (A) Representative Histopathology of lungs section of mice (high dose, low dose and control) stained with hematoxylin and Eosin. (B) along with percentage lymphocytic infiltarion in different dose groups and control. Mice were sacrificed 30 days after MTB infection. Arrows indicate percentage of lesions covered in lungs. (C) Shows mean INF-γ levels in lung homogenates of mice at different dose groups. Errors bars indicate standard error of mean. **Represent significant (p<0.05) and ***represents highly significant (p<0.001) values.
Reference
-
1. Kashyap RS, Nayak AR, Husain AA, Gaherwar HM, Purohit HJ, Taori GM. Tuberculosis in India: the continuing challenge. Curr Sci. 2013; 105:597–606.2. Husain AA, Kashyap RS, Kalorey DR, Warke SR, Purohit HJ, Taori GM, Daginawal HF. Effect of repeat dose of BCG vaccination on humoral response in mice model. Indian J Exp Biol. 2011; 49:7–10.3. Parida SK, Kaufmann SH. Novel tuberculosis vaccines on the horizon. Curr Opin Immunol. 2010; 22:374–384.
Article4. Hoft DF. Tuberculosis vaccine development: goals, immunological design, and evaluation. Lancet. 2008; 372:164–175.
Article5. Morais Fonseca D, Rosada RS, e Paula MO, Wowk PF, Franco LH, Soares EG, Silva CL, Deperon Bonato VL. Experimental tuberculosis: designing a better model to test vaccines against tuberculosis. Tuberculosis (Edinb). 2010; 90:135–142.
Article6. Sugawara I, Udagawa T, Aoki T, Mizuno S. Establishment of a guinea pig model of latent tuberculosis with GFP-introduced Mycobacterium tuberculosis. Tohoku J Exp Med. 2009; 219:257–262.
Article7. Srivastava S, Ayyagari A, Dhole TN, Krishnani N, Nyati KK, Dwivedi SK. Progression of chronic pulmonary tuberculosis in mice intravenously infected with ethambutol resistant Mycobacterium tuberculosis. Indian J Med Microbiol. 2008; 26:342–348.
Article8. Fremond CM, Yeremeev V, Nicolle DM, Jacobs M, Quesniaux VF, Ryffel B. Fatal Mycobacterium tuberculosis infection despite adaptive immune response in the absence of MyD88. J Clin Invest. 2004; 114:1790–1799.
Article9. Bonanni D, Rindi L, Lari N, Garzelli C. Immunogenicity of mycobacterial PPE44 (Rv2770c) in Mycobacterium bovis BCG-infected mice. J Med Microbiol. 2005; 54:443–448.
Article10. Sharpe SA, McShane H, Dennis MJ, Basaraba RJ, Gleeson F, Hall G, McIntyre A, Gooch K, Clark S, Beveridge NE, Nuth E, White A, Marriott A, Dowall S, Hill AV, Williams A, Marsh PD. Establishment of an aerosol challenge model of tuberculosis in rhesus macaques and an evaluation of endpoints for vaccine testing. Clin Vaccine Immunol. 2010; 17:1170–1182.
Article11. Gupta UD, Katoch VM. Animal models of tuberculosis for vaccine development. Indian J Med Res. 2009; 129:11–18.12. Flynn JL. Immunology of tuberculosis and implications in vaccine development. Tuberculosis (Edinb). 2004; 84:93–101.
Article13. Shekhawat SD, Jain RK, Gaherwar HM, Purohit HJ, Taori GM, Daginawala HF, Kashyap RS. Heat shock proteins: possible biomarkers in pulmonary and extrapulmonary tuberculosis. Hum Immunol. 2014; 75:151–158.
Article14. Kolibab K, Yang A, Parra M, Derrick SC, Morris SL. Time to detection of Mycobacterium tuberculosis using the MGIT 320 system correlates with colony counting in preclinical testing of new vaccines. Clin Vaccine Immunol. 2014; 21:453–455.
Article15. Ottenhoff TH, Kaufmann SH. Vaccines against tuberculosis: where are we and where do we need to go. PLoS Pathog. 2012; 8:e1002607.
Article16. Kashyap RS, Nayak AR, Gaikwad S, Jain RK, Daginawala HF, Taori GM. Biomarkers in pulmonary and extra pulmonary tuberculosis. In : Proceedings of theInternational conference on Advances in developing Affordable Invitro molecular Diagnostics; 2013. p. 73–86.17. Abebe F, Bjune G. The protective role of antibody responses during Mycobacterium tuberculosis infection. Clin Exp Immunol. 2009; 157:235–243.
Article18. Zuniga J, Torres-García D, Santos-Mendoza T, Rodriguez-Reyna TS, Granados J, Yunis EJ. Cellular and humoral mechanisms involved in the control of tuberculosis. Clin Dev Immunol. 2012; 2012:193923.19. Kozakiewicz L, Chen Y, Xu J, Wang Y, Dunussi-Joannopoulos K, Ou Q, Flynn JL, Porcelli SA, Jacobs WR Jr, Chan J. B cells regulate neutrophilia during Mycobacterium tuberculosis infection and BCG vaccination by modulating the interleukin-17 response. PLoS Pathog. 2013; 9:e1003472.
Article20. Acosta A, Norazmi MN, Hernandez-Pando R, Alvarez N, Borrero R, Infante JF, Sarmiento ME. The importance of animal models in tuberculosis vaccine development. Malays J Med Sci. 2011; 18:5–12.
- Full Text Links
-
- Actions
-
Cited
- CITED
-
- Close
- Share
-
- Similar articles
-
- The Route of Leishmania tropica Infection Determines Disease Outcome and Protection against Leishmania major in BALB/c Mice
- Viscerotropic growth pattern of Leishmania tropica in BALB/c mice is suggestive of a murine model for human viscerotropic leishmaniasis
- Failure of immunization with Naegleria fowleri in mice born to immune mothers
- Leishmania tropica infection, in comparison to Leishmania major, induces lower delayed type hypersensitivity in BALB/c mice
- Intestinal mastocytosis and goblet cell hyperplasia in BALB/c and C3H mice infected with Neodiplostomum seoulense
