Non-Invasive in vivo Loss Tangent Imaging: Thermal Sensitivity Estimation at the Larmor Frequency
- Affiliations
-
- 1Department of Electrical and Electronic Engineering, Yonsei University, Seoul, Korea. donghyunkim@yonsei.ac.kr
- 2Center for Neuroscience Imaging Research, Institute for Basic Science, Sungkyunkwan University, Korea.
- KMID: 2161368
- DOI: http://doi.org/10.13104/imri.2016.20.1.36
Abstract
- Visualization of the tissue loss tangent property can provide distinct contrast and offer new information related to tissue electrical properties. A method for non-invasive imaging of the electrical loss tangent of tissue using magnetic resonance imaging (MRI) was demonstrated, and the effect of loss tangent was observed through simulations assuming a hyperthermia procedure. For measurement of tissue loss tangent, radiofrequency field maps (B1+ complex map) were acquired using a double-angle actual flip angle imaging MRI sequence. The conductivity and permittivity were estimated from the complex valued B1+ map using Helmholtz equations. Phantom and ex-vivo experiments were then performed. Electromagnetic simulations of hyperthermia were carried out for observation of temperature elevation with respect to loss tangent. Non-invasive imaging of tissue loss tangent via complex valued B1+ mapping using MRI was successfully conducted. Simulation results indicated that loss tangent is a dominant factor in temperature elevation in the high frequency range during hyperthermia. Knowledge of the tissue loss tangent value can be a useful marker for thermotherapy applications.
Figure
-
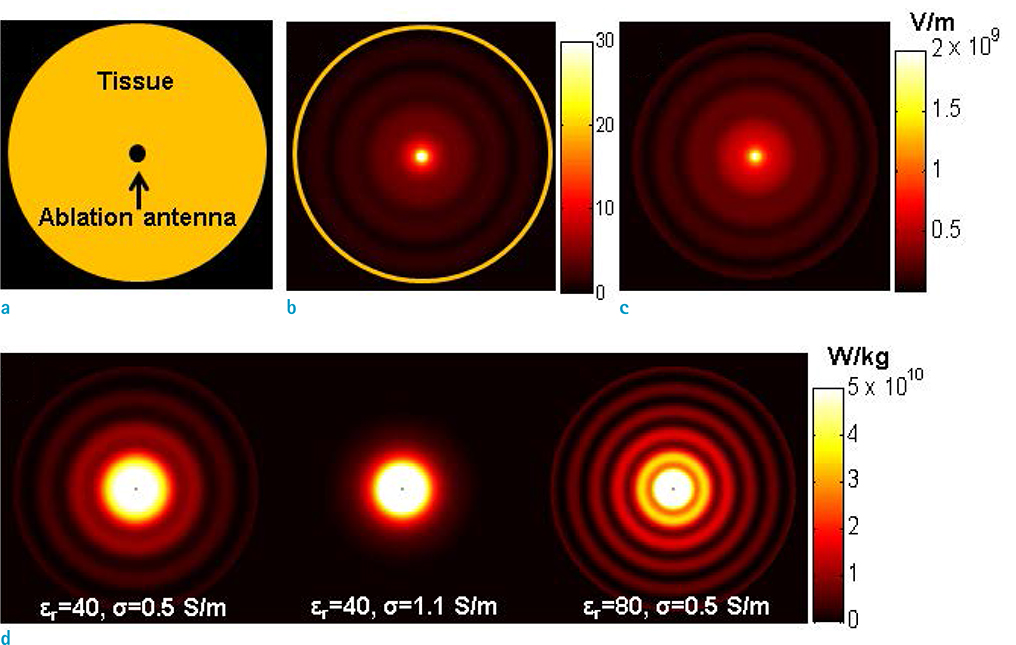
Fig. 1 Simulation results obtained at 915 MHz: (a) Phantom design, (b) B1+ magnitude (yellow ring denotes the tissue boundary, and the ablation antenna is placed in the center), (c) Ez (εr = 40, σ = 0.5 S/m), and (d) SAR values (Electrical properties are noted on each figure).
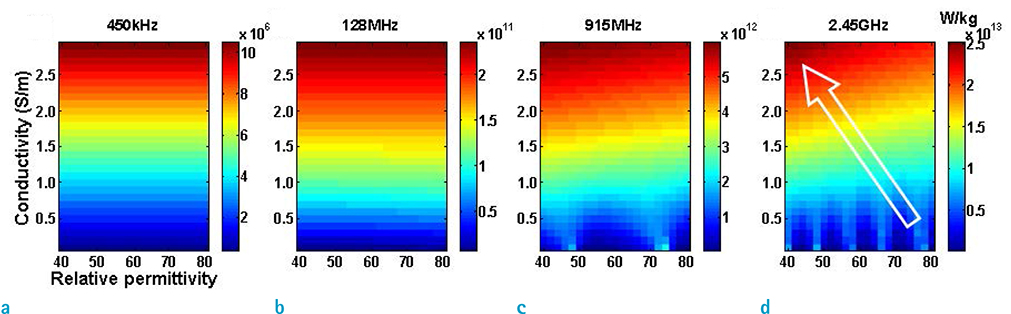
Fig. 2 Simulation results showing peak local SAR for ablation performed at four different frequencies. At lower frequencies, the peak local SAR (and thus temperature rise) was directly proportional to the conductivity (a, b). However, at the higher frequency ranges, used in microwave ablation, temperature elevation was more proportional to the loss tangent (c, d). The direction of the white arrow indicates increase of the loss tangent.
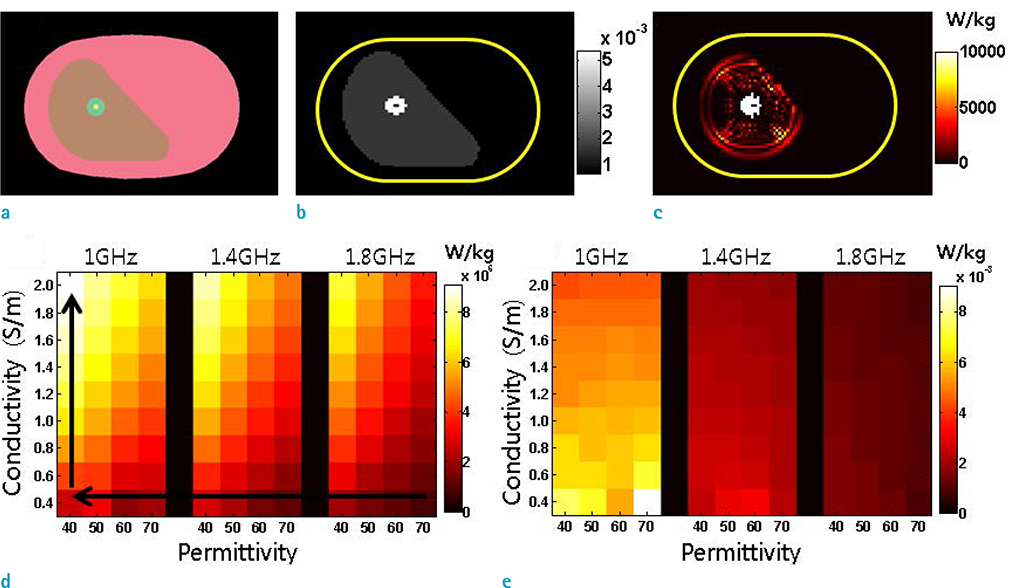
Fig. 3 Results of the liver model simulation: (a) Liver model (from outside to inside: muscle, liver, cancer, antenna), (b) Loss tangent map (cancer σ: 1.2 S/m, εr : 40, frequency: 1 GHz), (c) SAR map, (d) Average SAR in the cancer region, with increase of the loss tangent in the direction of the black arrow, and (e) Average SAR of the liver.
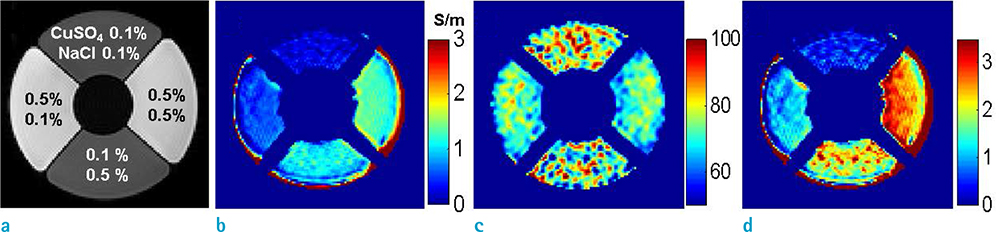
Fig. 4 Results of the phantom study: (a) MR image and the concentrations of CuSO4 and NaCl for each chamber, (b) conductivity image, (c) relative permittivity image, and (d) loss tangent image. The loss tangent image shows distinct contrast between each specific chamber. Since the permittivity processing is more sensitive to noise, the estimated permittivity map has larger standard deviation compared to the conductivity map.
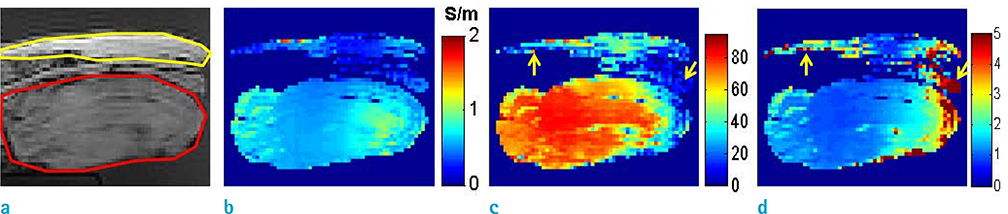
Fig. 5 Ex-vivo experiment results (shoulder of a pig). (a) MR image, with delineation of fat (yellow) and non-fat (red) regions. (b) Conductivity image. (c) Relative permittivity image. (d) Loss tangent image. Conductivity and permittivity of the fat showed low intensity compared to the non-fat. The loss tangent image, however, showed different contrast. Artifacts (yellow arrows) appeared due to the complex structure of the tissues.
Reference
-
1. van der Put RW, Kerkhof EM, Raaymakers BW, Jurgenliemk-Schulz IM, Lagendijk JJ. Contour propagation in MRI-guided radiotherapy treatment of cervical cancer: the accuracy of rigid, non-rigid and semi-automatic registrations. Phys Med Biol. 2009; 54:7135–7150.2. McDannold N, Clement GT, Black P, Jolesz F, Hynynen K. Transcranial magnetic resonance imaging-guided focused ultrasound surgery of brain tumors: initial findings in 3 patients. Neurosurgery. 2010; 66:323–332.3. Fuentes D, Walker C, Elliott A, Shetty A, Hazle JD, Stafford RJ. Magnetic resonance temperature imaging validation of a bioheat transfer model for laser-induced thermal therapy. Int J Hyperthermia. 2011; 27:453–464.4. Hynynen K, Pomeroy O, Smith DN, et al. MR imaging-guided focused ultrasound surgery of fibroadenomas in the breast: a feasibility study. Radiology. 2001; 219:176–185.5. Peyman A, Gabriel C, Benedickter HR, Frohlich J. Dielectric properties of human placenta, umbilical cord and amniotic fluid. Phys Med Biol. 2011; 56:N93–N98.6. Brace CL. Microwave tissue ablation: biophysics, technology, and applications. Crit Rev Biomed Eng. 2010; 38:65–78.7. Garrean S, Hering J, Saied A, Helton WS, Espat NJ. Radiofrequency ablation of primary and metastatic liver tumors: a critical review of the literature. Am J Surg. 2008; 195:508–520.8. Goldberg SN, Grassi CJ, Cardella JF, et al. Image-guided tumor ablation: standardization of terminology and reporting criteria. J Vasc Interv Radiol. 2009; 20:S377–S390.9. Haemmerich D. Biophysics of radiofrequency ablation. Crit Rev Biomed Eng. 2010; 38:53–63.10. Pennes HH. Analysis of tissue and arterial blood temperatures in the resting human forearm. J Appl Physiol. 1948; 1:93–122.11. Gajsek P, Hurt WD, Ziriax JM, Mason PA. Parametric dependence of SAR on permittivity values in a man model. IEEE Trans Biomed Eng. 2001; 48:1169–1177.12. Voigt T, Katscher U, Doessel O. Quantitative conductivity and permittivity imaging of the human brain using electric properties tomography. Magn Reson Med. 2011; 66:456–466.13. van Lier AL, Brunner DO, Pruessmann KP, et al. B1(+) phase mapping at 7 T and its application for in vivo electrical conductivity mapping. Magn Reson Med. 2012; 67:552–561.14. Seo JK, Kim MO, Lee J, et al. Error analysis of nonconstant admittivity for MR-based electric property imaging. IEEE Trans Med Imaging. 2012; 31:430–437.15. Choi N, Lee J, Kim MO, Shin J, Kim DH. A modified multiecho AFI for simultaneous B1(+) magnitude and phase mapping. Magn Reson Imaging. 2014; 32:314–320.16. van den Bergen B, Stolk CC, Berg JB, Lagendijk JJ, Van den. Ultra fast electromagnetic field computations for RF multi-transmit techniques in high field MRI. Phys Med Biol. 2009; 54:1253–1264.17. Christ A, Kainz W, Hahn EG, et al. The Virtual Family--development of surface-based anatomical models of two adults and two children for dosimetric simulations. Phys Med Biol. 2010; 55:N23–N38.18. Shin J, Kim MJ, Lee J, et al. Initial study on in vivo conductivity mapping of breast cancer using MRI. J Magn Reson Imaging. 2015; 42:371–378.19. Wen H. Noninvasive quantitative mapping of conductivity and dielectric distributions using RF wave propagation effects in high-field MRI. Proceedings of the SPIE. 2003; 5030:471–477.20. Hoult DI. The principle of reciprocity in signal strength calculations - a mathematical guide. Concept Magnetic Res. 2000; 12:173–187.21. Renou R, Ding M, Zhu H, Szymczyk A, Malfreyt P, Ghoufi A. Concentration dependence of the dielectric permittivity, structure, and dynamics of aqueous NaCl solutions: comparison between the Drude oscillator and electronic continuum models. J Phys Chem B. 2014; 118:3931–3940.22. Akilan C. Thermodynamic and related studies of aqueous copper (II) sulfate solutions. Australia: Murdoch University;2008. 87–134. PhD Dissertation.23. Weast RC, Astle MJ, Beyer WH. CRC handbook of chemistry and physics. 69th ed. Boca Raton, Florida: CRC Press;1988.24. Wolf AV. Aqueous solutions and body fluids. Their concentrative properties and conversion tables. New York: Hoeber Medical Division Harper & Row Publishers;1966.25. Huang L, Schweser F, Herrmann KH, Kramer M, Deistung A, Reichenbach JR. A Monte Carlo method for overcoming the edge artifacts in MRI-based electrical conductivity mapping. In : Proc 22nd Annual Meeting of ISMRM; Milan, Italy: 2014. p. 3190.26. Stollberger R, Wach P. Imaging of the active B1 field in vivo. Magn Reson Med. 1996; 35:246–251.27. Peyman A, Holden SJ, Watts S, Perrott R, Gabriel C. Dielectric properties of porcine cerebrospinal tissues at microwave frequencies: in vivo, in vitro and systematic variation with age. Phys Med Biol. 2007; 52:2229–2245.28. Cole KS, Cole RH. Dispersion and absorption in dielectrics I. Alternating current characteristics. J Chem Phys. 1941; 9:34.29. Peyman A, Gabriel C. Cole-Cole parameters for the dielectric properties of porcine tissues as a function of age at microwave frequencies. Phys Med Biol. 2010; 55:N413–N419.30. Solazzo SA, Liu Z, Lobo SM, et al. Radiofrequency ablation: importance of background tissue electrical conductivity--an agar phantom and computer modeling study. Radiology. 2005; 236:495–502.
- Full Text Links
-
- Actions
-
Cited
- CITED
-
- Close
- Share
-
- Similar articles
-
- Quantitative Conductivity Estimation Error due to Statistical Noise in Complex B1+ Map
- Visual Field Ratio According to Distance in the Near Tangent Screen Test
- High-contrast spectroscopic photoacoustic characterization of thermal tissue ablation in the visible spectrum
- Design of a stimulation protocol to predict temperature distribution in subcutaneous tissue using the finite element model
- Problems of Application to McBride Disability Evaluation in Loss of Visual Effciency Patients
