Quantitative Analysis of 3-Dimensional Volumetry and Histogram of Thyroid Gland on Neck Computed Tomography for Patients with Hashimoto's Thyroiditis
- Affiliations
-
- 1Department of Radiology, Haeundae Paik Hospital, Inje University College of Medicine, Busan, Korea. lkh770429@naver.com
- 2Department of Internal Medicine, Haeundae Paik Hospital, Inje University College of Medicine, Busan, Korea.
- 3Department of Radiology, Myongji Hospital, Seonam University College of Medicine, Goyang, Korea.
- 4Department of Radiology, Samsung Medical Center, Sungkyunkwan University School of Medicine, Seoul, Korea.
- KMID: 2130941
- DOI: http://doi.org/10.3348/jksr.2015.73.6.367
Abstract
- PURPOSE
To analyze three-dimensional (3D) volume and histogram of thyroid gland on neck computed tomography (CT) for patients with Hashimoto's thyroiditis.
MATERIALS AND METHODS
A total of 121 subjects who underwent neck CT between March 2013 and February 2014 were included in this study. These subjects were divided into the following two groups: 1) control group (n = 76); 2) Hashimoto's thyroiditis group (n = 45). Non-enhanced and contrast-enhanced CT images were obtained. On contrast-enhanced images, the 3D volume of thyroid gland was semi-automatically calculated. On CT histogram, attenuation number, mean, median, standard deviation (SD), and coefficient of variation (CV) of thyroid gland were calculated. These values were compared between the two groups.
RESULTS
Total 3D volume of thyroid gland was 14.9 +/- 4.8 cm3 in the control group, which was significantly (p = 0.002) lower than that (19.2 +/- 8 cm3) in the Hashimoto's thyroiditis group. On CT histogram, the mean, median, SD, and CV of thyroid gland on non-enhanced images were 95.8, 99.3, 21.7, and 0.226, respectively, in the control group and 72.2, 72.6, 19.6, and 0.28 in the Hashimoto's thyroiditis group (p < 0.05). Histogram parameters on contrast-enhanced images were not significantly (p > 0.05) different. Median at cut-off value of 83 revealed the largest Az value (Az: 0.905; 95% confidence interval: 0.837-0.951; sensitivity: 84.4%; specificity: 85.5%).
CONCLUSION
The Hashimoto's thyroiditis group had larger volume but lower CT attenuation number with more prominent parenchymal heterogeneity of thyroid gland than the control group.
MeSH Terms
Figure
-
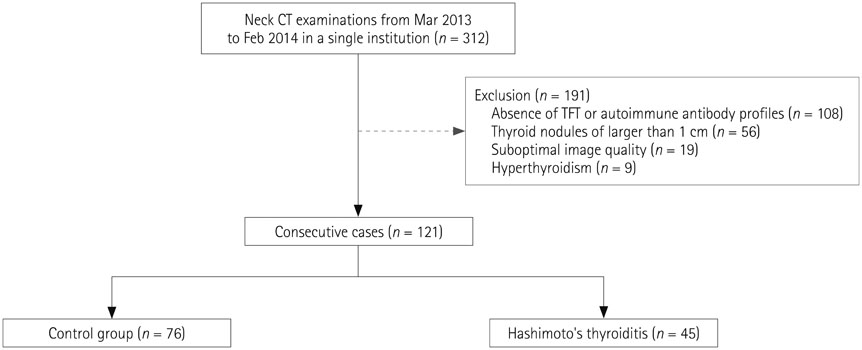
Fig. 1 Flow chart of the population. CT = computed tomography, TFT = thyroid function test

Fig. 2 A 54-year-old female with Hashimoto's thyroiditis. Thyroid gland revealing heterogeneously low attenuation in nonenhanced CT image (A) and heterogeneously well enhancement in contrast-enhanced CT image (B). On 3D CT volumetry (C), the actual shape of thyroid gland is revealed, including pyramidal lobe (arrow) and total volume of 17.1 cm3. Histogram (D) reveals the distribution of CT attenuation number in the entire thyroid gland, with mean of 49.6, median of 50, standard deviation of 13.34, and coefficient of variation at 0.27. CT = computed tomography, HU = Hounsfield unit, 3D = three-dimensional

Fig. 3 Box plots showing histogram parameters of CT attenuation number on nonenhanced CT images between the two groups, including mean (A), median (B), standard deviation (C), and coefficient of variation (D). Each box stretches from the 25th percentile at lower edge to the 75th percentile at upper edge. The median is shown as a line across the box. CT = computed tomography, CV = coefficient of variation, SD = standard deviation

Fig. 4 ROC curve of histogram parameters on non-enhanced CT images, including mean (Az: 0.896, 95% CI: 0.827-0.944, sensitivity: 91.1%, specificity: 81.6%), median (Az: 0.905, 95% CI: 0.837-0.951, sensitivity: 84.4%, specificity: 85.5%), SD (Az: 0.641, 95% CI: 0.548-0.726, sensitivity: 59.1%, specificity: 75%), and CV (Az: 0.664, 95% CI: 0.572-0.747, sensitivity: 36.4%, specificity: 90.8%). CT = computed tomography, CV = coefficient of variation, SD = standard deviation
Reference
-
1. Berghout A, Wiersinga WM, Smits NJ, Touber JL. Determinants of thyroid volume as measured by ultrasonography in healthy adults in a non-iodine deficient area. Clin Endocrinol (Oxf). 1987; 26:273–280.2. Delange F, Benker G, Caron P, Eber O, Ott W, Peter F, et al. Thyroid volume and urinary iodine in European schoolchildren: standardization of values for assessment of iodine deficiency. Eur J Endocrinol. 1997; 136:180–187.3. Shu J, Zhao J, Guo D, Luo Y, Zhong W, Xie W. Accuracy and reliability of thyroid volumetry using spiral CT and thyroid volume in a healthy, non-iodine-deficient Chinese adult population. Eur J Radiol. 2011; 77:274–280.4. Iida Y, Konishi J, Harioka T, Misaki T, Endo K, Torizuka K. Thyroid CT number and its relationship to iodine concentration. Radiology. 1983; 147:793–795.5. Kaneko T, Matsumoto M, Fukui K, Hori T, Katayama K. Clinical evaluation of thyroid CT values in various thyroid conditions. J Comput Tomogr. 1979; 3:1–4.6. Han YM, Kim YC, Park EK, Choe JG. Diagnostic value of CT density in patients with diffusely increased FDG uptake in the thyroid gland on PET/CT images. AJR Am J Roentgenol. 2010; 195:223–228.7. Zhang H, Graham CM, Elci O, Griswold ME, Zhang X, Khan MA, et al. Locally advanced squamous cell carcinoma of the head and neck: CT texture and histogram analysis allow independent prediction of overall survival in patients treated with induction chemotherapy. Radiology. 2013; 269:801–809.8. Wolf BS, Nakagawa H, Yeh HC. Visualization of the thyroid gland with computed tomography. Radiology. 1977; 123:368.9. Block MA. Surgery of thyroid nodules and malignancy. Curr Probl Surg. 1983; 20:133–203.10. Kim DW, Jung SJ, Ha TK, Park HK, Kang T. Comparative study of ultrasound and computed tomography for incidentally detecting diffuse thyroid disease. Ultrasound Med Biol. 2014; 40:1778–1784.11. Mizukami Y, Michigishi T, Hashimoto T, Tonami N, Hisada K, Matsubara F, et al. Silent thyroiditis: a histologic and immunohistochemical study. Hum Pathol. 1988; 19:423–431.12. Choi JY, Lee KE, Koo do H, Kim KH, Kim Ey, Bae DS, et al. Use of spiral computed tomography volumetry for determining the operative approach in patients with Graves' disease. World J Surg. 2014; 38:639–644.13. Hermans R, Bouillon R, Laga K, Delaere PR, Foer BD, Marchal G, et al. Estimation of thyroid gland volume by spiral computed tomography. Eur Radiol. 1997; 7:214–216.14. Lyshchik A, Drozd V, Reiners C. Accuracy of three-dimensional ultrasound for thyroid volume measurement in children and adolescents. Thyroid. 2004; 14:113–120.15. Gönczi J, Szabolcs I, Magyar E. [Sonographic volumetry of the thyroid]. Aktuelle Radiol. 1993; 3:283–285.16. Brunn J, Block U, Ruf G, Bos I, Kunze WP, Scriba PC. [Volumetric analysis of thyroid lobes by real-time ultrasound (author's transl)]. Dtsch Med Wochenschr. 1981; 106:1338–1340.17. Silverman PM, Newman GE, Korobkin M, Workman JB, Moore AV, Coleman RE. Computed tomography in the evaluation of thyroid disease. AJR Am J Roentgenol. 1984; 142:897–902.18. Kivikangas V, Lamberg BA, Mäenpää J. Thyroidal iodine and proteins in autoimmune thyroiditis. Scand J Clin Lab Invest. 1970; 25:263–268.19. Kamijo K. Clinical studies on thyroid CT number in chronic thyroiditis. Endocr J. 1994; 41:19–23.20. Aguirre DA, Behling CA, Alpert E, Hassanein TI, Sirlin CB. Liver fibrosis: noninvasive diagnosis with double contrast material-enhanced MR imaging. Radiology. 2006; 239:425–437.21. Choi JY, Kim H, Sun M, Sirlin CB. Histogram analysis of hepatobiliary phase MR imaging as a quantitative value for liver cirrhosis: preliminary observations. Yonsei Med J. 2014; 55:651–659.
- Full Text Links
-
- Actions
-
Cited
- CITED
-
- Close
- Share
-
- Similar articles
-
- Ultrasonographic Findings of Papillary Thyroid Cancer with or without Hashimoto's Thyroiditis
- A Case of Primary Thyroid Lymphoma Associated with Hashimoto's Thyroiditis
- Malignant Lymphoma Associated with Hashimoto's Thyroiditis
- A case of Hashimoto's thyroiditis coexisting with thyroid papillary and follicular carcinoma
- Thyroid MALT Lymphoma Associated with Thyroid Papillary Cancer
