Evaluation of Hemifield Sector Analysis Protocol in Multifocal Visual Evoked Potential Objective Perimetry for the Diagnosis and Early Detection of Glaucomatous Field Defects
- Affiliations
-
- 1Department of Ophthalmology, Hamad Medical Corporation, Doha, Qatar.
- 2School of Life and Health Sciences, Aston University, Birmingham, UK.
- 3Department of Medical Statistics & Epidemiology, Hamad Medical Corporation, Doha, Qatar. abener@hmc.org.qa
- 4Department of Public Health, Weill Cornell Medical College, Doha, Qatar.
- 5Department Evidence for Population Health Unit, School of Epidemiology and Health Sciences, The University of Manchester, Manchester, UK.
- KMID: 1792094
- DOI: http://doi.org/10.3341/kjo.2014.28.1.49
Abstract
- PURPOSE
Multifocal visual evoked potential (mfVEP) is a newly introduced method used for objective visual field assessment. Several analysis protocols have been tested to identify early visual field losses in glaucoma patients using the mfVEP technique, some were successful in detection of field defects, which were comparable to the standard automated perimetry (SAP) visual field assessment, and others were not very informative and needed more adjustment and research work. In this study we implemented a novel analysis approach and evaluated its validity and whether it could be used effectively for early detection of visual field defects in glaucoma.
METHODS
Three groups were tested in this study; normal controls (38 eyes), glaucoma patients (36 eyes) and glaucoma suspect patients (38 eyes). All subjects had a two standard Humphrey field analyzer (HFA) test 24-2 and a single mfVEP test undertaken in one session. Analysis of the mfVEP results was done using the new analysis protocol; the hemifield sector analysis (HSA) protocol. Analysis of the HFA was done using the standard grading system.
RESULTS
Analysis of mfVEP results showed that there was a statistically significant difference between the three groups in the mean signal to noise ratio (ANOVA test, p < 0.001 with a 95% confidence interval). The difference between superior and inferior hemispheres in all subjects were statistically significant in the glaucoma patient group in all 11 sectors (t-test, p < 0.001), partially significant in 5 / 11 (t-test, p < 0.01), and no statistical difference in most sectors of the normal group (1 / 11 sectors was significant, t-test, p < 0.9). Sensitivity and specificity of the HSA protocol in detecting glaucoma was 97% and 86%, respectively, and for glaucoma suspect patients the values were 89% and 79%, respectively.
CONCLUSIONS
The new HSA protocol used in the mfVEP testing can be applied to detect glaucomatous visual field defects in both glaucoma and glaucoma suspect patients. Using this protocol can provide information about focal visual field differences across the horizontal midline, which can be utilized to differentiate between glaucoma and normal subjects. Sensitivity and specificity of the mfVEP test showed very promising results and correlated with other anatomical changes in glaucoma field loss.
Keyword
MeSH Terms
-
Adult
Aged
*Early Diagnosis
Evoked Potentials, Visual/*physiology
Female
Follow-Up Studies
Glaucoma/complications/*diagnosis/physiopathology
Humans
Intraocular Pressure/*physiology
Male
Middle Aged
Reproducibility of Results
Retrospective Studies
Scotoma/*diagnosis/etiology/physiopathology
Visual Field Tests/*methods
Visual Fields/*physiology
Young Adult
Figure
-
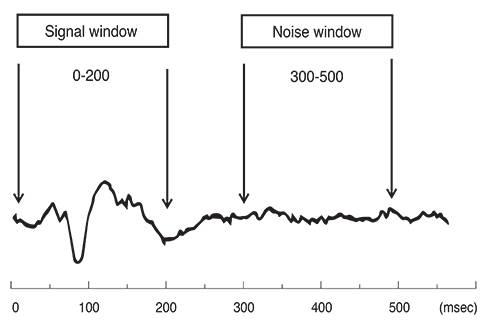
Fig. 1 The typical multifocal visual evoked potential signal is divided into two parts (windows) according to implicit time. The signal window between 0 to 200 msec and the noise window between 300 to 500 msec. Signal to noise ratio is calculated based on this division of the waveform.
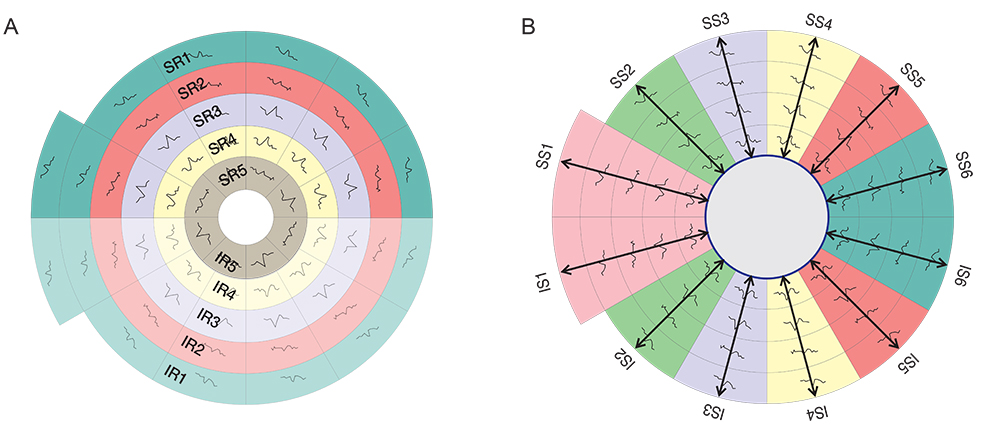
Fig. 2 The five allocated hemi-rings and their corresponding fellows in both hemispheres (A). The allocated six sectors and their corresponding fellows in both hemispheres (B). SR = superior hemi-ring; IR = inferior hemi-ring; SS = superior sector; IS = inferior sector.
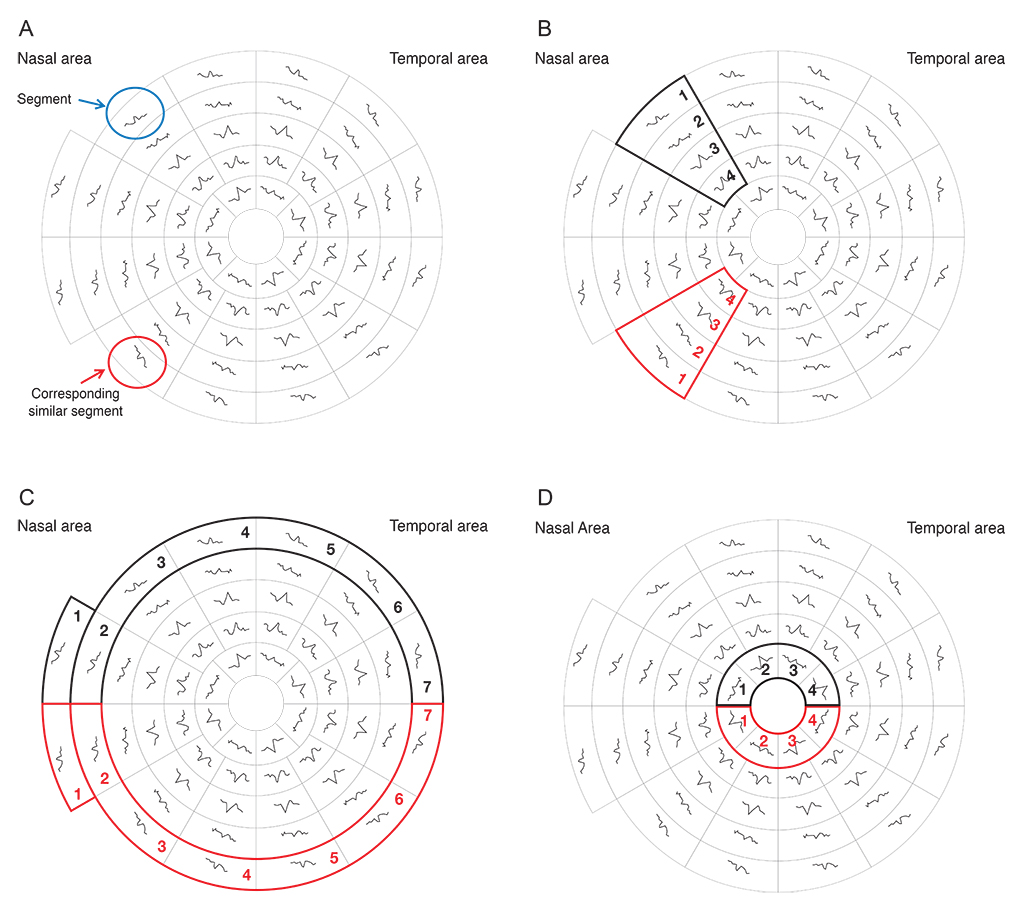
Fig. 3 The 58 segments of the right visual field. The field is divided into two identical hemifields across the horizontal meridian; each segment has a similar correspondent in the opposite hemifield. (A) Signal to noise ratio (SNR) value is calculated for each segment. The average SNR of wedge sectors (B) and semicircular sectors; peripheral and central sectors (C,D) are calculated to compare their values to fellow corresponding sectors on the opposite hemifield.

Fig. 4 Receiver operating characteristic analysis for the glaucoma suspect group by multifocal visual evoked potential testing in the glaucoma suspect group.

Fig. 5 Receiver operating characteristic analysis for the glaucoma group by multifocal visual evoked potential testing in the glaucoma suspect group.
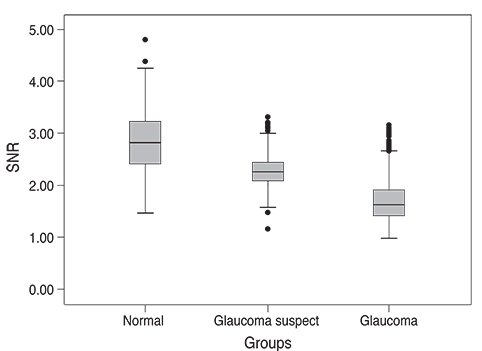
Fig. 6 Box plot of signal to noise ratio (SNR) values of multifocal visual evoked potential in normal, glaucoma suspect, and glaucoma groups. There was a significant difference between the mean values among the three study groups.
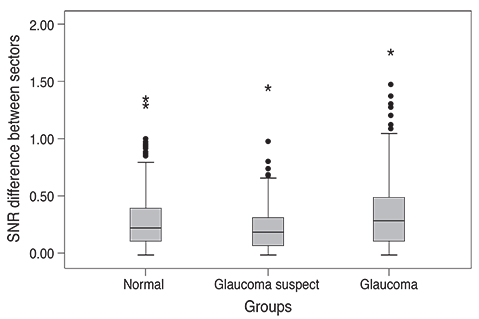
Fig. 7 Box plot of the difference in signal to noise ratio (SNR) values of multifocal visual evoked potential in normal, glaucoma suspect, and glaucoma groups. There was a significant difference between the mean values among the three study groups.
Reference
-
1. Kerrigan-Baumrind LA, Quigley HA, Pease ME, et al. Number of ganglion cells in glaucoma eyes compared with threshold visual field tests in the same persons. Invest Ophthalmol Vis Sci. 2000; 41:741–748.2. Quigley HA, Dunkelberger GR, Green WR. Retinal ganglion cell atrophy correlated with automated perimetry in human eyes with glaucoma. Am J Ophthalmol. 1989; 107:453–464.3. McKendrick AM, Turpin A. Combining perimetric suprathreshold and threshold procedures to reduce measurement variability in areas of visual field loss. Optom Vis Sci. 2005; 82:43–51.4. Punjabi OS, Lin SC, Stamper RL. Advances in mapping the glaucomatous visual field: from confrontation to multifocal visual evoked potentials. Int J Ophthal Vis Sci. 2005; 4:doi: 10.5580/11c8.5. McKendrick AM, Turpin A. Combining perimetric suprathreshold and threshold procedures to reduce measurement variability in areas of visual field loss. Optom Vis Sci. 2005; 82:43–51.6. Graham SL, Klistorner AI, Goldberg I. Clinical application of objective perimetry using multifocal visual evoked potentials in glaucoma practice. Arch Ophthalmol. 2005; 123:729–739.7. Thienprasiddhi P, Greenstein VC, Chu DH, et al. Detecting early functional damage in glaucoma suspect and ocular hypertensive patients with the multifocal VEP technique. J Glaucoma. 2006; 15:321–327.8. Thienprasiddhi P, Greenstein VC, Chen CS, et al. Multifocal visual evoked potential responses in glaucoma patients with unilateral hemifield defects. Am J Ophthalmol. 2003; 136:34–40.9. Hood DC, Greenstein VC. Multifocal VEP and ganglion cell damage: applications and limitations for the study of glaucoma. Prog Retin Eye Res. 2003; 22:201–251.10. Sharma AK, Goldberg I, Graham SL, Mohsin M. Comparison of the Humphrey swedish interactive thresholding algorithm (SITA) and full threshold strategies. J Glaucoma. 2000; 9:20–27.11. Bengtsson B, Heijl A. Comparing significance and magnitude of glaucomatous visual field defects using the SITA and Full Threshold strategies. Acta Ophthalmol Scand. 1999; 77:143–146.12. Heijl A, Bengtsson B, Patella VM. Glaucoma follow-up when converting from long to short perimetric threshold tests. Arch Ophthalmol. 2000; 118:489–493.13. Budenz DL, Rhee P, Feuer WJ, et al. Comparison of glaucomatous visual field defects using standard full threshold and Swedish interactive threshold algorithms. Arch Ophthalmol. 2002; 120:1136–1141.14. Sutter EE. The fast m-transform: a fast computation of cross-correlations with binary m-sequences. SIAM J Computing. 1991; 20:686–694.15. Chen CS, Hood DC, Zhang X, et al. Repeat reliability of the multifocal visual evoked potential in normal and glaucomatous eyes. J Glaucoma. 2003; 12:399–408.16. Baseler HA, Sutter EE, Klein SA, Carney T. The topography of visual evoked response properties across the visual field. Electroencephalogr Clin Neurophysiol. 1994; 90:65–81.17. Goldberg I, Graham SL, Klistorner AI. Multifocal objective perimetry in the detection of glaucomatous field loss. Am J Ophthalmol. 2002; 133:29–39.18. Klistorner A, Graham SL. Objective perimetry in glaucoma. Ophthalmology. 2000; 107:2283–2299.19. Bjerre A, Grigg JR, Parry NR, Henson DB. Test-retest variability of multifocal visual evoked potential and SITA standard perimetry in glaucoma. Invest Ophthalmol Vis Sci. 2004; 45:4035–4040.20. Leske MC, Heijl A, Hyman L, Bengtsson B. Early Manifest Glaucoma Trial: design and baseline data. Ophthalmology. 1999; 106:2144–2153.21. American Academy of Ophthalmology. Primary open-angle glaucoma. San Francisco: The Academy;2000. p. 322–329.22. Spry PG, Henson DB, Sparrow JM, North RV. Quantitative comparison of static perimetric strategies in early glaucoma: test-retest variability. J Glaucoma. 2000; 9:247–253.23. Aulhorn E, Harms H. Visual perimetry. In : Jameson D, Horvich LM, editors. Handbook of sensory physiology. Berlin: Springer-Verlag;1972. p. 102–145.24. Harwerth RS, Carter-Dawson L, Smith EL 3rd, Crawford ML. Scaling the structure: function relationship for clinical perimetry. Acta Ophthalmol Scand. 2005; 83:448–455.25. Hood DC, Bach M, Brigell M, et al. ISCEV standard for clinical multifocal electroretinography (mfERG) (2011 edition). Doc Ophthalmol. 2012; 124:1–13.26. Brigell MG. The visual evoked potential. In : Fishman GA, Birch DG, Holder GE, Brigell MG, editors. Electrophysiologic testing in disorders of the retina, optic nerve, and visual pathway. 2nd ed. San Francisco: Foundation of the American Academy of Ophthalmology;2001. p. 237–278.27. Rodarte C, Hood DC, Yang EB, et al. The effects of glaucoma on the latency of the multifocal visual evoked potential. Br J Ophthalmol. 2006; 90:1132–1136.28. Klistorner AI, Graham SL, Grigg J, Balachandran C. Objective perimetry using the multifocal visual evoked potential in central visual pathway lesions. Br J Ophthalmol. 2005; 89:739–744.29. Greenstein VC, Eggers HM, Hood DC. Multifocal visual evoked potential and automated perimetry abnormalities in strabismic amblyopes. J AAPOS. 2008; 12:11–17.30. Brindley GS. The variability of the human striate cortex. J Physiol. 1972; 225:1P–3P.31. Zhang X, Hood DC, Chen CS, Hong JE. A signal-to-noise analysis of multifocal VEP responses: an objective definition for poor records. Doc Ophthalmol. 2002; 104:287–302.32. Horn FK, Wakili N, Junemann AM, Korth M. Testing for glaucoma with frequency-doubling perimetry in normals, ocular hypertensives, and glaucoma patients. Graefes Arch Clin Exp Ophthalmol. 2002; 240:658–665.
- Full Text Links
-
- Actions
-
Cited
- CITED
-
- Close
- Share
-
- Similar articles
-
- Association of Retinal Nerve Fiber Layer Thickness Measured by Optical Coherence Tomography and Automatic Perimetry
- RNFL and Ganglion Cell Complex Thickness in Normal Hemifield According to the Severity of Glaucoma
- Correlation of OCT and Hemifield Pattern VEP in Hemianopia
- Scanning Laser Polarimetry Using Variable Corneal Compensation in Detection of Localized Visual Field Defects
- Study of Contralateral Eye of Normal Tension Glaucoma and a Unilateral Visual Field Defect
