Experimental Pulmonary Fat Embolism: Computed Tomography and Pathologic Findings of the Sequential Changes
- Affiliations
-
- 1Department of Radiology, Korea Lung Tissue Bank, Korea University College of Medicine, Korea University Guro Hospital, Seoul, Korea. keyrad@korea.ac.kr
- 2Department of Pathology, Korea Lung Tissue Bank, Korea University College of Medicine, Korea University Guro Hospital, Seoul, Korea.
- KMID: 1785831
- DOI: http://doi.org/10.3346/jkms.2008.23.4.691
Abstract
- This study was done to demonstrate the computed tomography (CT) and pathologic findings of the sequential changes for experimental pulmonary fat embolism (PFE), and to correlate the CT and pathologic findings of rabbit lung. PFE was induced by an intravenous injection of 0.2 mL linoleic acid in 24 rabbits. The rabbits were divided into 4 groups of 6 rabbits each. CT scans were obtained sequentially at 2 hr (n= 24), day 1 (n=18), day 3 (n=12) and day 7 (n=6) after fat embolization. The pathologic findings were analyzed and CT-pathologic correlation was done. CT scans showed bilateral ground-glass opacity (GGO), consolidation and nodule in all cases. The findings of PFE at 2 hr after fat embolization were areas of decreased attenuation, GGO, consolidation and nodule. These findings were aggravated on the follow- up CT after 1 day and 3 days. The follow-up CT revealed linear density in the subpleural lungs after 7 days. On CT-pathology correlation, wedge-shaped ischemic necrosis in the subpleural lungs correlated with nodule at 2 hr. GGO and consolidation at day 1 on CT correlated with congestion and edema, and these findings at day 3 were correlated with inflammation and hemorrhagic edema. The linear density in the subpleural lungs correlated with interstitial fibrosis and pleural contraction at day 7. In conclusion, PFE was caused by using linoleic acid which is kind of free fatty acid and this study served as one model of the occurrence of nontraumatic PFE. CT accurately depicted the natural evolution of PFE in the serial followup, and this correlated well with the pathologic findings.
Keyword
MeSH Terms
Figure
-
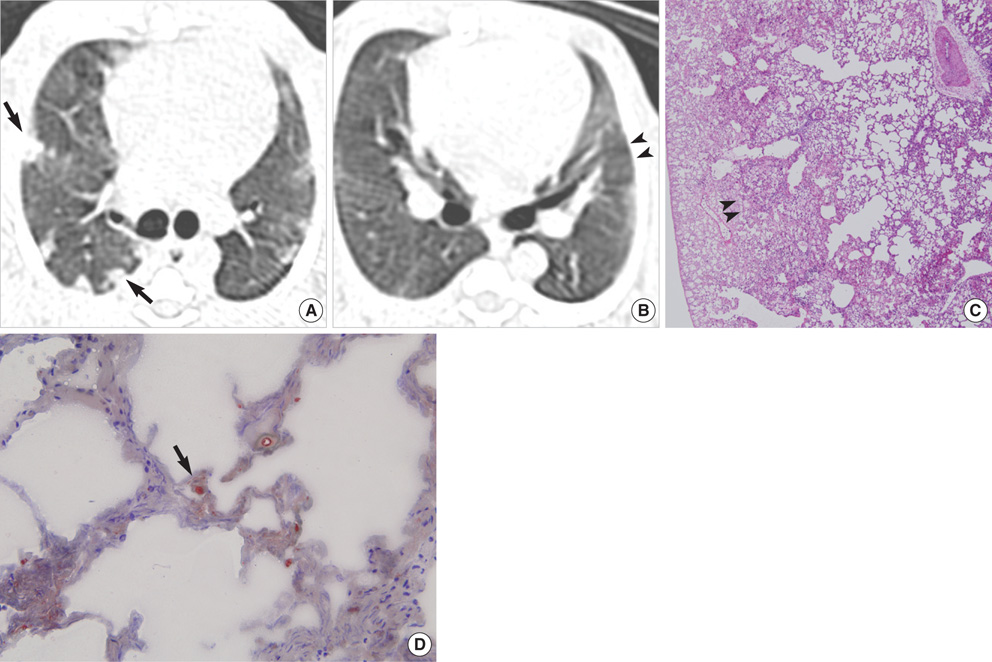
Fig. 1 CT and pathologic findings of 2 hr (group I) after fat embolization in a rabbit. (A, B) CT scan shows the bilateral ground glass opacity and nodules (arrows) in the subpleural lungs and the areas of decreased attenuation (arrowheads) in the peripheral lung. (C) Photomicrograph shows wedge shaped ischemic necrosis in the subpleural lungs (arrowheads) and mild congestion in the interstitium (H&E stain, × 40). (D) Oil red O stain ( × 400) shows the intravascular fat globule with homogeneous pinkish-colored materials (arrow).
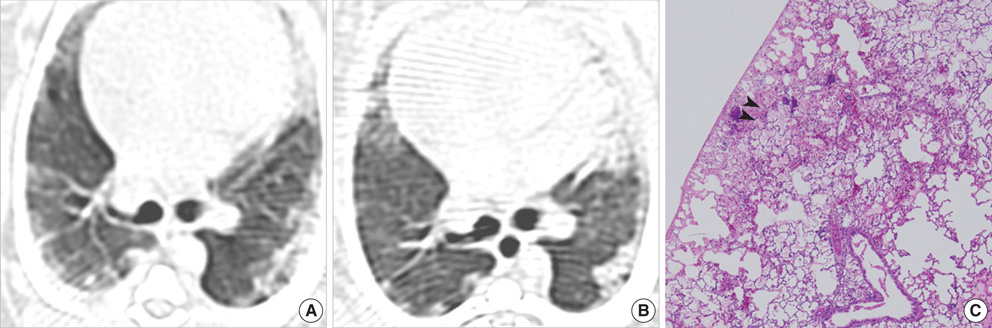
Fig. 2 CT and pathologic findings of sequential changes at 2 hr and day 1 (group II) after embolization in a rabbit. (A) CT scan obtained 2 hr after embolization shows bilateral multifocal ground glass opacities and consolidations. (B) CT scan obtained day 1 after embolization shows more aggravation of the distribution and the extent of the ground glass opacities and consolidations. (C) Photomicrograph shows the more extensive geographic infarction in the subpleural lungs and prominent congestion and edema (arrowheads) in the interstitium (H&E stain, × 40).

Fig. 3 CT and pathologic findings of sequential changes at 2 hr, day 1 and day 3 (group III) after fat embolization in a rabbit. (A) The CT scan obtained 2 hr after embolization shows GGO, patchy consoliodations and nodules in the subpleural lungs. (B) The CT findings are more extensive and aggravated at day 3. (C) The gross specimen represents the patchy areas of reddish and brownish discoloration of the surface in the subpleural lungs, and this was correlated with the alveolar hemorrhage and inflammation that was seen microscopically. (D) Photomicrograph shows more extensive inflammation (arrow) with hemorrhage and necrosis (arrowheads) in the interstitium (H&E stain, × 40). (E) Oil red O stain ( × 400) shows extravasated fat globules in the alveolar space or interstitium (arrow) with homogeneous pinkish-colored materials.

Fig. 4 CT and pathologic findings of sequential changes at 2 hr, day 1, day 3, and day 7 (group IV) after fat embolization in a rabbit. (A) The CT scan obtained 2 hr after embolization shows focal GGO at the subpleural lungs. (B) The CT scan obtained at day 7 after embolization shows resolution of the parenchymal abnormalities and the linear density (arrowheads) in the subpleural lungs. (C) The gross specimen represents the nearly complete resolution of patchy areas of reddish and brownish discoloration of the surface in the subpleural lungs. (D) The photomicrograph shows cord-like fibrosis of the interstitium (arrow) and pleural contraction (H&E stain, × 40). (E) Oil red O stain ( × 400) shows histiocytes with ingestion of fat globules.

Fig. 5 Extent of parenchymal abnormality on CT scan of sequential changes after fat embolization in rabbit Lung.
Reference
-
1. Moylan JA, Birnbaum M, Katz A, Everson MA. Fat emboli syndrome. J Trauma. 1976. 16:341–347.
Article2. Dines DE, Burgher LW, Okazaki H. The clinical and pathologic correlation of fat embolism syndrome. Mayo Clin Proc. 1975. 50:407–411.3. Batra P. The fat embolism syndrome. J Thorac Imaging. 1987. 2:12–17.
Article4. Shier MR, Wilson RF. Fat embolism syndrome: traumatic coagulopathy with respiratory distress. Surg Annu. 1980. 12:139–168.5. Baker PL, Pazell JA, Peltier LF. Free fatty acids, catecholamines, and arterial hypoxia in patients with fat embolism. J Trauma. 1971. 11:1026–1030.
Article6. Burhop KE, Selig WM, Beeler DA, Malik AB. Effect of heparin on increased pulmonary microvascular permeability after bone marrow embolism in awake sheep. Am Rev Respir Dis. 1987. 136:134–141.
Article7. Byrick RJ, Wong PY, Mullen JB, Wigglesworth DF. Ibuprofen pretreatment does not prevent hemodynamic instability after cemented arthroplasty in dogs. Anesth Analg. 1992. 75:515–522.
Article8. Nakata Y, Tanaka H, Kuwagata Y, Yoshioka T, Sugimoto H. Triolein-induced pulmonary embolization and increased microvascular permeability in isolated perfused rat lungs. J Trauma. 1999. 47:111–119.
Article9. Nakata Y, Dahms TE. Triolein increases microvascular permeability in isolated perfused rabbit lungs: role of neutrophils. J Trauma. 2000. 49:320–326.
Article10. Byrick RJ, Kay JC, Mullen JB. Pulmonary marrow embolism: a dog model simulating dual component cemented arthroplasty. Can J Anaesth. 1987. 34:336–342.
Article11. Baker PL, Kuenzig MC, Peltier LF. Experimental fat embolism in dogs. J Trauma. 1969. 9:577–586.
Article12. Gossling HR, Pellegrini VD Jr. Fat embolism syndrome: a review of the pathophysiology and physiological basis of treatment. Clin Orthop Relat Res. 1982. (165):68–82.13. Szabo G. The syndrome of fat embolism and its origin. J Clin Pathol Suppl (R Coll Pathol). 1970. 4:123–131.
Article14. Choi JA, Oh YW, Kim HK, Kang KH, Choi YH, Kang EY. Nontraumatic pulmonary fat embolism syndrome: radiologic and pathologic correlations. J Thorac Imaging. 2002. 17:167–169.
Article15. Arakawa H, Kurihara Y, Nakajima Y. Pulmonary fat embolism syndrome: CT findings in six patients. J Comput Assist Tomogr. 2000. 24:24–29.
Article16. Malagari K, Economopoulos N, Stoupis C, Daniil Z, Papiris S, Muller NL, Kelekis D. High-resolution CT findings in mild pulmonary fat embolism. Chest. 2003. 123:1196–1201.
Article17. Derks CM, Jacobovitz-Derks D. Embolic pneumopathy induced by oleic acid. A systematic morphologic study. Am J Pathol. 1977. 87:143–158.18. Park SJ, Sung DW, Jun YH, Oh JH, Ko YT, Lee JH, Yoon Y. Pulmonary fat embolism induced intravenous injection of autologous bone marrow in rabbit: CT and pathologic correlation. J Korean Radiol Soc. 1999. 41:303–311.
Article19. Berrigan TJ Jr, Carsky EW, Heitzman ER. Fat embolism. Roentgenographic pathologic correlation in 3 cases. Am J Roentgenol Radium Ther Nucl Med. 1966. 96:967–971.20. King EG, Wagner WW Jr, Ashbaugh DG, Latham LP, Halsey DR. Alterations in pulmonary microanatomy after fat embolism. In vivo observations via thoracic window of the oleic acid-embolized canine lung. Chest. 1971. 59:524–530.21. Muangman N, Stern EJ, Bulger EM, Jurkovich GJ, Mann FA. Chest radiographic evolution in fat embolism syndrome. J Med Assoc Thai. 2005. 88:1854–1860.22. Feldman F, Ellis K, Green WM. The fat embolism syndrome. Radiology. 1975. 114:535–542.
Article23. Gurd AR. Fat embolism: an aid to diagnosis. J Bone Joint Surg Br. 1970. 52:732–737.
Article
- Full Text Links
-
- Actions
-
Cited
- CITED
-
- Close
- Share
-
- Similar articles
-
- An Experimentally Induced Fat Embolism in the Rabbit Lung: High-resolution CT and Pathologic Findings
- High Resolution Computerized Tomographic and Pathologic Findings of Pulmonary Fat Embolism after Long Bone Fracture of Rabbit
- Pulmonary Embolism Associated with Total Hip Replacement for the Fracture of Femur Neck
- Pulmonary Fat Embolism Induced Intravenous Injection of Autologous Bone Marrow in Rabbit: CT and Pathologic Correlation
- Comparison of Contrast-enhanced Spiral CT Scan and Pulmonary Angiogra p hy in Diagnosing Pulmonary Embolism: An Experimental Study in Pig Models
