Dynamic Contrast Enhanced Magnetic Resonance Imaging of Diffuse Spinal Bone Marrow Infiltration in Patients with Hematological Malignancies
- Affiliations
-
- 1Department of Radiology, Renmin Hospital of Wuhan University, Wuhan, China. zhayunfei@hotmail.com
- 2Department of Radiology, Renmin Hospital of Wuhan University, Wuhan, China.
- 3Department of Radiology, the First Affiliated Hospital, Sun Yat-Sen University, Guangzhou, China.
- KMID: 1783195
- DOI: http://doi.org/10.3348/kjr.2010.11.2.187
Abstract
OBJECTIVE
To investigate the significance of the dynamic contrast enhanced magnetic resonance imaging (DCE-MRI) parameters of diffuse spinal bone marrow infiltration in patients with hematological malignancies.
MATERIALS AND METHODS
Dynamic gadolinium-enhanced MR imaging of the lumbar spine was performed in 26 patients with histologically proven diffuse bone marrow infiltration, including multiple myeloma (n = 6), acute lymphoblastic leukemia (n = 6), acute myeloid leukemia (n = 5), chronic myeloid leukemia (n = 7), and non-Hodgkin lymphoma (n = 2). Twenty subjects whose spinal MRI was normal, made up the control group. Peak enhancement percentage (Emax), enhancement slope (ES), and time to peak (TTP) were determined from a time-intensity curve (TIC) of lumbar vertebral bone marrow. A comparison between baseline and follow-up MR images and its histological correlation were evaluated in 10 patients. The infiltration grade of hematopoietic marrow with plasma cells was evaluated by a histological assessment of bone marrow.
RESULTS
Differences in Emax, ES, and TTP values between the control group and the patients with diffuse bone marrow infiltration were significant (t = -11.51, -9.81 and 3.91, respectively, p < 0.01). Emax, ES, and TTP values were significantly different between bone marrow infiltration groups Grade 1 and Grade 2 (Z = -2.72, -2.24 and -2.89 respectively, p < 0.05). Emax, ES and TTP values were not significantly different between bone marrow infiltration groups Grade 2 and Grade 3 (Z = -1.57, -1.82 and -1.58 respectively, p > 0.05). A positive correlation was found between Emax, ES values and the histological grade of bone marrow infiltration (r = 0.86 and 0.84 respectively, p < 0.01). A negative correlation was found between the TTP values and bone marrow infiltration histological grade (r = -0.54, p < 0.01). A decrease in the Emax and ES values was observed with increased TTP values after treatment in all of the 10 patients who responded to treatment (t = -7.92, -4.55, and 5.12, respectively, p < 0.01).
CONCLUSION
DCE-MRI of spine can be a useful tool in detecting diffuse marrow infiltration of hematological malignancies, while its parameters including Emax, ES, and TTP can reflect the malignancies' histological grade.
MeSH Terms
-
Adolescent
Adult
Aged
Bone Marrow Neoplasms/pathology
Child
Contrast Media/*diagnostic use
Female
Gadolinium DTPA/diagnostic use
Hematologic Neoplasms/*pathology
Humans
Image Enhancement/methods
Leukemia/*pathology
Lymphoproliferative Disorders/*pathology
Magnetic Resonance Imaging/*methods
Male
Middle Aged
Observer Variation
Prospective Studies
Spinal Neoplasms/*pathology
Young Adult
Figure
-
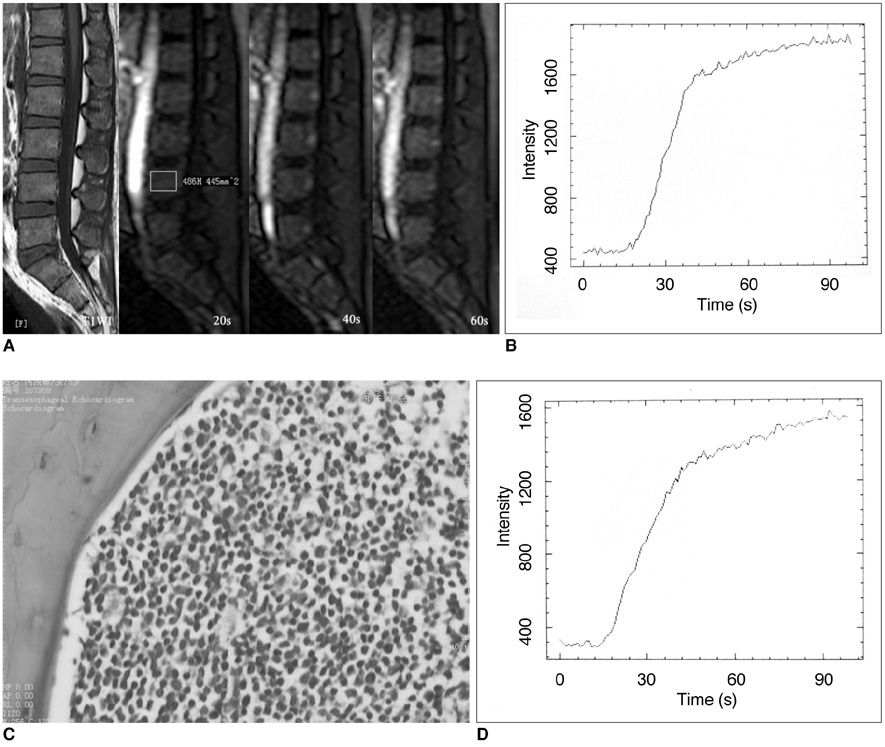
Fig. 1 25-year-old man with acute lymphoblastic leukemia. A. Precontrast T1-weighted spin-echo image of lumbar spine shows no signal intensity changes, however dynamic contrast-enhanced MRI perfusion imaging of TFE-T1 weighted image obtained at 20 sec, 40 sec and 60 sec after gadopentetate dimeglumine bolus injection shows enhancement of vertebral bone marrow (Emax = 256.12%, ES = 10.68% and TTP = 20 sec). B. L4 vertebral body of same patient shows TIC with initial rapidly rising slope, followed by second slow rising phase. C. Bone marrow biopsy image of same patient with acute lymphoblastic leukemia shows severe tumor cell infiltration (Hematoxylin & Eosin staining, ×200). D. Decreased Emax and ES values with increased TTP values (Emax = 192.56%, ES = 7.56% and TTP = 25 sec) were observed after treatment in same patient who responded well to treatment. TFE = turbo field echo, Emax = peak enhancement percentage, ES = enhancement slope, TTP = time to peak, TIC = time-intensity curve
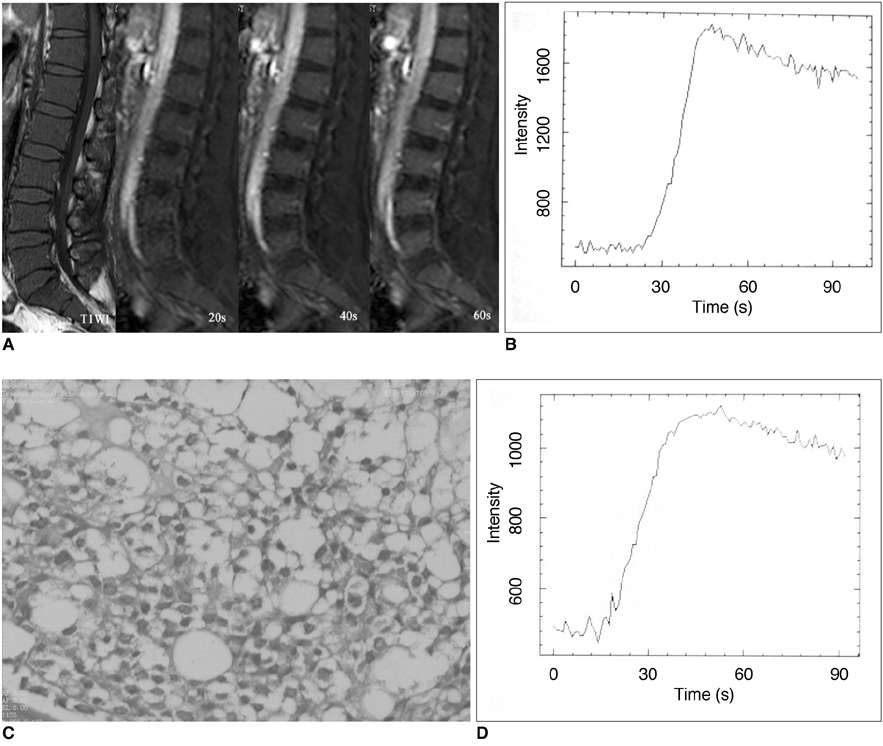
Fig. 2 50-year-old patient with acute myeloid leukemia. A. Pre-contrast T1-weighted spin-echo image of lumbar spine shows diffuse low signal intensity consistent with bone marrow infiltration. Dynamic contrast-enhanced MRI perfusion imaging of TFE-T1 weighted image obtained at 20 sec, 40 sec and 60 sec after gadopentetate dimeglumine bolus injection shows enhancement in vertebral bone marrow (Emax = 225.58%, ES = 10.74% and TTP = 22 sec). B. L3 vertebral body of same patient shows TIC with rapidly rising slope (wash-in) during initial short period. C. Bone marrow biopsy image of same patient (Fig. 3) with acute myeloid leukemia shows moderate tumor cell infiltration (Hematoxylin & Eosin staining, ×400). D. Decreased Emax and ES values with increased TTP values (Emax = 135.35%, ES = 5.12% and TTP = 26.5 sec) were observed after treatment in same patient who responded well to treatment. TFE = turbo field echo, Emax = peak enhancement percentage, ES = enhancement slope, TTP = time to peak, TIC = time-intensity curve
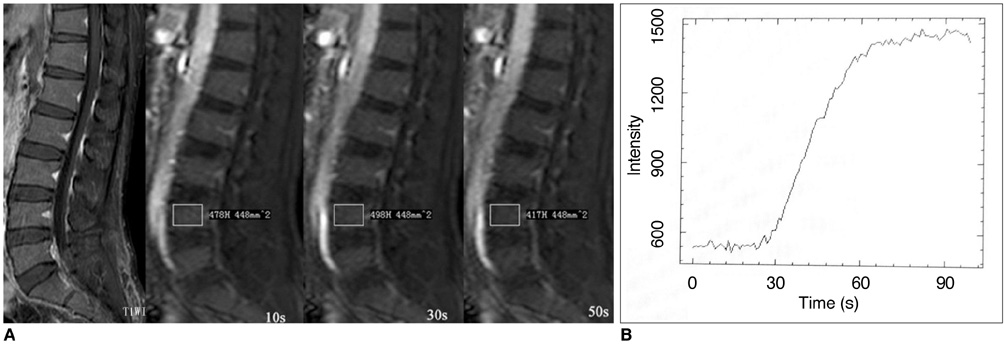
Fig. 3 35-year-old man in normal control group. A. Dynamic contrast-enhanced MRI perfusion imaging of TFE-T1 weighted image obtained at 10 sec, 30 sec and 50 sec after gadopentetate dimeglumine bolus injection shows enhancement in vertebral bone marrow (Emax = 116.42%, ES = 4.67% and TTP = 30.5 sec). B. Vertebral body of L4 of same patient shows TIC with initial slowly rising slope followed by platform phase. TFE = turbo field echo, Emax = peak enhancement percentage, ES = enhancement slope, TTP = time to peak, TIC = time-intensity curve
Reference
-
1. Stäbler A, Baur A, Bartl R, Munker R, Lamerz R, Reiser MF. Contrast enhancement and quantitative signal analysis in MR imaging of multiple myeloma: assessment of focal and diffuse growth patterns in marrow correlated with biopsies and survival rates. AJR Am J Roentgenol. 1996. 167:1029–1036.2. Vande Berg BC, Lecouvet FE, Michaux L, Ferrant A, Maldague B, Malghem J. Magnetic resonance imaging of the bone marrow in hematological malignancies. Eur Radiol. 1998. 8:1335–1344.3. Lecouvet FE, Vande Berg BC, Michaux L, Malghem J, Maldague BE, Jamart J, et al. Stage III multiple myeloma: clinical and prognostic value of spinal bone marrow MR imaging. Radiology. 1998. 209:653–660.4. Zhang L, Mandel C, Yang ZY, Yang Q, Nibbs R, Westerman D, et al. Tumor infiltration of bone marrow in patients with hematological malignancies: dynamic contrast-enhanced magnetic resonance imaging. Chin Med J. 2006. 119:1256–1262.5. Nosàs-Garcia S, Moehler T, Wasser K, Kiessling F, Bartl R, Zuna I, et al. Dynamic contrast-enhanced MRI for assessing the disease activity of multiple myeloma: a comparative study with histology and clinical markers. J Magn Reson Imaging. 2005. 22:154–162.6. Rahmouni A, Montazel JL, Divine M, Lepage E, Belhadj K, Gaulard P, et al. Bone marrow with diffuse tumor infiltration in patients with lymphoproliferative diseases: dynamic gadoliniumenhanced MR imaging. Radiology. 2003. 229:710–717.7. Moulopoulos LA, Maris TG, Papanikolaou N, Panagi G, Vlahos L, Dimopoulos MA. Detection of malignant bone marrow involvement with dynamic contrast-enhanced magnetic resonance imaging. Ann Oncol. 2003. 14:152–158.8. Moehler TM, Hawighorst H, Neben K, Egerer G, Hillengass J, Max R, et al. Bone marrow microcirculation analysis in multiple myeloma by contrast-enhanced dynamic magnetic resonance imaging. Int J Cancer. 2001. 93:862–868.9. Baur A, Bartl R, Pellengahr C, Baltin V, Reiser M. Neovascularization of bone marrow in patients with diffuse multiple myeloma: a correlative study of magnetic resonance imaging and histopathologic findings. Cancer. 2004. 101:2599–2604.10. Hillengass J, Wasser K, Delorme S, Kiessling F, Zechmann C, Benner A, et al. Lumbar bone marrow microcirculation measurements from dynamic contrast-enhanced magnetic resonance imaging is a predictor of event-free survival in progressive multiple myeloma. Clin Cancer Res. 2007. 13:475–481.11. Chen WT, Ting-Fang Shih T, Hu CJ, Chen RC, Tu HY. Relationship between vertebral bone marrow blood perfusion and common carotid intima-media thickness in aging adults. J Magn Reson Imaging. 2004. 20:811–816.12. Lee SH, Cho N, Kim SJ, Cha JH, Cho KS, Ko ES, et al. Correlation between high resolution dynamic MR features and prognostic factors in breast cancer. Korean J Radiol. 2008. 9:10–18.13. Montazel JL, Divine M, Lepage E, Kobeiter H, Breil S, Rahmouni A. Normal spinal bone marrow in adults: dynamic gadolinium-enhanced MR imaging. Radiology. 2003. 229:703–709.
- Full Text Links
-
- Actions
-
Cited
- CITED
-
- Close
- Share
-
- Similar articles
-
- Dynamic Contrast-Enhanced MR Imaging of Tietze’s Syndrome: a Case Report
- MR Imaging of the Bone Marrow
- Postoperative Chylothorax: the Use of Dynamic Magnetic Resonance Lymphangiography and Thoracic Duct Embolization
- A Case of Nonsecretory Multiple Myeloma with Atypical Imaging Features
- Dynamic Contrast-Enhanced MRI and Its Applications in Various Central Nervous System Diseases
